
American Journal of Marketing Research, Vol. 1, No. 3, October 2015 Publish Date: Aug. 10, 2015 Pages: 183-188
The Selection of Winning Stocks Using Principal Component Analysis
Carol Anne Hargreaves*, Chandrika Kadirvel Mani
Business Analytics, Institute of Systems Science, National University of Singapore, Singapore, Singapore
Abstract
One of the primary challenges with stock selection is the identification of the best stock features to use for the selection of winning stocks. Typically, there are easily more than 50 variables that can be used for stock selection. Many stock investors prefer to keep stock selection as simple as possible and therefore are interested in identifying a few stock variables to use for the identification of winning stocks. Principal Component Analysis is a statistical technique that reduces a large number of inputs of data to a few factors. Once the factors are established, they are displayed in a perceptual map. The perceptual map provides a clear picture of the winning stocks that should be selected for trading.
Keywords
Stocks, Principle Component Analysis, Key Factors, Perceptual Maps, Australian Stock Market, Reliability Analysis, Return on Investment, Stock Portfolio
Received: July 9, 2015
Accepted: July 31, 2015
Published online: August 9, 2015
@ 2015 The Authors. Published by American Institute of Science. This Open Access article is under the CC BY-NC license. http://creativecommons.org/licenses/by-nc/4.0/
Contents
1. Introduction
Investment in the stock market is regarded as high risks and high gains and so attracts a large number of investors. However, information regarding a stock is normally complex and has a lot of uncertainty, making it a challenge to select winning stocks. Although the selection of winning stocks is a challenge, principle component analysis and perceptual mapping can guide an investor in identifying winning stocks from losing ones
There are many methods by which investors choose stocks. While some investors use economic data to select their stocks, other use technical data with the help of charts to determine whether a stock is good or not, and others rely on fundamental data such as financial ratios (e.g. return on equity ROE, return on assets, ROA, etc) to determine winning stocks, and others use a combination of technical and fundamental information. While there are many ways in which one can select stocks, what counts, is the method that is simple to understand and use and at the same time proves accurate in returning good money.
Everyone wants to make money using stocks, but, many do not have the technical skills and stock market knowledge to make good decisions and merely select stocks on pure gut feel.
The purpose of this paper is to test whether the application of principal component analysis to a large number of input variables, can sensibly reduce this large number of input variables to just a few factors. In this sense, principal component analysis will simplify the investor’s time and costs as only a few input variables from a large set of input variables will now need to be captured, cleaned and maintained by the investor. The paper is structured into 6 sections. While Section 1 is the introduction, Section 2 gives a brief literature review, Section 3 the objectives of the study, Section 4 a brief overview of the statistical methods used, Section 5 the statistical analysis results, after which Section 6 presents the conclusion.
2. Literature Review
Wang [1], explored the application of principle components of Shanghai stock exchange 50 index by means of functional principal component analysis (FPCA). Wang [1] reduced dimension to a finite level using FPCA and extracted the most significant components of the data and some relevant statistical features of related datasets. FPCA has proved to be successful at extracting the main variance factors.
Further, Mbeledogu [2], also used principal component analysis technique was to reduce 19 stock data variables to 9 stock data variable for stock prediction system for Nigerian stock exchange data. The main task of feature extraction is to select or combine the features that preserve most of the information and remove the redundant components in order to improve the efficiency of the subsequent classifiers without degrading their performances. The result exhibited PCA’s advantage of quantifying the importance of each dimension for describing the variability of a data set. This paper by Mbeledogu [2] further supports the use of principle component analysis for the identification of the most important factors and in the process, considerably reducing the number of input data variables to an efficient and sufficient amount.
In addition, Loretan [3], also applied principle component analysis on daily frequency observations on spot exchange rates, stock market indexes, and long term and short term interest rates for nine countries. Loretan [3] also showed that principal components analysis may be used to reduce the effective dimensionality of the scenario specification problem in several cases. Wang [4] applied principle component analysis to the Korean composite stock price index (KOSPI) and the Hangseng Index (HIS) to reduce the data points into two components and observed that the co-movement stocks formed a cluster in a biplot using components generated from PCA.
The above four authors have all successfully demonstrated the reduction of the input variables to a reduced number, but have not shown or demonstrated how reliable the new factors are. Further, it is unknown whether the new factors, make intuitive sense or not. The resulting factors were also not named. We will enhance the application of principle component analysis in reducing the number of input variables but also demonstrate and the new factors make intuitive sense and that the new factors are reliable through the application of Cronbach Alpha. Cronbach Alpha is a reliability measure that scales the data and determines whether the factor loadings are in agreement with each other or not. The Cronbach Alpha is a numeric number that lies between 0 and 1. The closer the Cronbach Alpha is to one, the more reliable is the factor. As a rule of thumb, a Cronbach Alpha of at least 0.7 is acceptable to confirm the reliability of each of the new factors and the overall PCA model.
3. Objective of Study
The main objective of the study is to identify the most important factors that indicate a winning stock. This paper will demonstrate that using a scientific statistical approach we are able to select stocks much faster and in a smarter way ensuring a significant increase in return on investment and outperforming the Australian Stock Market.
In this paper, we aim to find the important factors which contribute to the upward trend movement of the Australian Health Care sector stocks. There are many fundamental and financial data available for each of the stocks in the stock market on related websites such as yahoo finance and the Australian Securities Exchange (ASX), and it is really difficult and time consuming to understand the fundamentals and financial data of each and every stock.
Our aim is to help shorten the process and time in identifying a good stock by reducing the number of variables to analyse and to analyse only the key factor variables. We chose 22 variables which contained fundamental or financial information and performed a Principal Component Analysis to reduce the 22 variables to a considerably fewer number of variables.
4. Methodology
4.1. Data Collection
The financial indicator data for the months of January, February and March for the year 2015, was collected from yahoo finance by web scraping using webscraper.io [5]. Data is collected for all of the 101 stocks in the Australian Health Care sector.
The Trend variable is collected from ASX. The upward trend indicates that it is a good stock and hence the variable trend was coded as 1. The downward trend or sideways trend indicates not a good stock and hence the variable trend was coded as 0 for such stocks.
4.2. Data Cleaning
Once the data was collected, we formatted the data in a structured format so that we could further process and analyse the data using statistical tools. We next checked for the presence of incorrect, incomplete and duplicate data.
Out of 22 variables, 15 variables had some missing data and 8 variables had complete data. Further, 86 cases had some missing data and only 15 cases had complete data. Totally there were 262 missing values which is equivalent to 11.28%.
Little’s MCAR test, tests the null hypothesis that data is missing completely at random [8].
We tested whether the data was missing at random or systematically missing (biased) using Little’s MCAR test. In our case the p value was .973 which was highly insignificant. Little’s MCAR test proved that the data was missing completely at random. When the data are missing completely at random, then list wise deletion does not add any bias, but it does decrease the power of the analysis by decreasing the effective sample size.
In order to maintain the sample adequacy we decided to impute the missing data. The missing data was imputed using the Expectation Maximization method [6] as this method overcomes the biased estimates and under estimation of standard errors.
Note that the stocks that were not currently trading, stocks that had a volume less than 10000 and stocks with a price less than 10 cents are removed from the analysis.
4.3. Principal Component Analysis
With a large number of variables, there are many pair-wise correlations between the variables. To interpret the data in a more meaningful way, we used the dimension reduction technique, Principal Component Analysis, in order to reduce a large number of variables into a fewer number of factors. The resulting factors are an interpretable linear combination of the input variables.
The IBM SPSS Statistics 22 standard software was used to perform the Principal Component Analysis (PCA). Initially all the 22 variables were used for the PCA analysis. The variables which are highly singular and multi-collinear were identified from the correlation values and removed for further analysis. The initial eigenvalues and the scree plot were used to understand the approximate number of components (factors) that could be extracted.
The sample should be adequate for the PCA analysis which could be verified by the Kaiser-Meyer-Olkin (KMO) Measure of Sampling Adequacy test for which the expected value is above 0.5. This test verifies whether the original variables can be factorised efficiently by comparing the correlation values between variables and those of the partial correlation.
Bartlett's test also tests the variables relationship strength. It does this by testing the null hypothesis that the correlation matrix is an identity matrix. An identity matrix is a matrix in which all of the diagonal elements are 1 and all off diagonal elements are 0. The expected result is to be significant so that we can reject the null hypothesis [9].
In order to extract meaningful factors, eigenvalues greater than one helped to identify the number of factors. There is a rule of thumb that the meaningful factors should contribute at least 70% to the total variance. There are many types of methods that can be used for PCA. Methods such as Varimax, Direct Oblimin, Quartimax, Equamax or Promax [7] are typically considered as they influence how the components are loaded with different variables.
The rotation method helps to make the final factors that are extracted more interpretable. For this study, we used the varimax rotation method. Variables which had no or low loadings (less than 0.45) were removed one by one and the principal component analysis procedure was repeated several times until we achieved variables loading on to the factors to have eigenvalues greater than 1, their proportion of total variance explained at least greater than 70% and the variables loaded in the rotated component matrix is greater than at least 0.7.
Further, the sample should be adequate for the PCA analysis to be valid. Sample adequacy is usually validated by the Kaiser-Meyer-Olkin (KMO) Measure of Sampling Adequacy test. If the KMO measure is above 0.5, we may conclude that the sample is adequate.
4.4. Reliability Analysis
The Cronbach's alpha coefficient helps to measure the internal consistency of the data [10].
Once we are satisfied that the extracted factors are meaningful with high loadings, also explaining maximum variability of the underlying data for the adequate sample, we need to measure the reliability of the factors. The expected Cronbach's alpha coefficient value should be greater than 0.7 in order to confirm that the factors are reliable and consistent.
5. Statistical Analysis Results
5.1. Results of the Principal Component Analysis
Table 1. KMO and Bartlett’s Test.
| KMO and Bartlett's Testa | ||
| Kaiser-Meyer-Olkin Measure of Sampling Adequacy. | .570 | |
| Bartlett's Test of Sphericity | Approx. Chi-Square | 50.648 |
| df | 6 | |
| Sig. | .000 | |
| a. Only cases for which Trend_Jan = 1 are used in the analysis phase. | ||
Bartlett’s sphericity test (shown in Table 1) is significant and indicates that the data can be reduced to form factors with at least two variables loading onto each component. Further, the KMO measure was also computed as 0.570 which indicates that the sample size is sufficient for the application of principal component analysis.
According to the results of PCA (Table 2), there were 2 factors resulting from 22 variables with eigenvalues greater than 1. The first two factors explained 94.270% of the total variation. See table 2 below.
Table 2. Principle Component Analysis Total Variance Explained.
| Total Variance Explaineda | ||||||||||
| Component | Initial Eigenvalues | Extraction Sums of Squared Loadings | Rotation Sums of Squared Loadings | |||||||
| Total | % of Variance | Cumulative % | Total | % of Variance | Cumulative % | Total | % of Variance | Cumulative % | ||
| dimension | 1 | 2.592 | 64.795 | 64.795 | 2.592 | 64.795 | 64.795 | 1.932 | 48.290 | 48.290 |
| 2 | 1.179 | 29.475 | 94.270 | 1.179 | 29.475 | 94.270 | 1.839 | 45.981 | 94.270 | |
| 3 | .163 | 4.081 | 98.351 | |||||||
| 4 | .066 | 1.649 | 100.000 | |||||||
| Extraction Method: Principal Component Analysis. | ||||||||||
| a. Only cases for which Trend_Jan = 1 are used in the analysis phase. | ||||||||||
Table 3. Rotated Component Matrix.
| Rotated Component Matrixa,b | ||
| Component | ||
| 1 | 2 | |
| ReturnonAssets | .970 | |
| ReturnonEquity | .960 | |
| RevenuePerShare | .949 | |
| BookValuePerShare | .931 | |
| Extraction Method: Principal Component Analysis. Rotation Method: Varimax with Kaiser Normalization. | ||
| a. Rotation converged in 3 iterations. | ||
| b. Only cases for which Trend_Jan = 1 are used in the analysis phase. | ||
We have used the varimax rotation as we were able to achieve simple structure of uncorrelated components. According to the Rotated Component Matrix (Table 3), the factor 1 had the variables Return on Assets and Return on Equity loaded highly which we termed, "Management Effectiveness" and factor 2 had the variables Revenue per Share and Book Value per Share loaded highly which we termed, "Common Share Value".
As can be seen from the above results, with the help of principal component analysis, we were able to identify that Return on Assets, Return on Equity, Revenue per Share and Book Value per Share are the important variables that contribute towards the upward trend movement of the stocks. Also we were able to name the factors 1 and 2 as Management Effectiveness and Common Share Value respectively. This is pictorially depicted in the below figure 1.
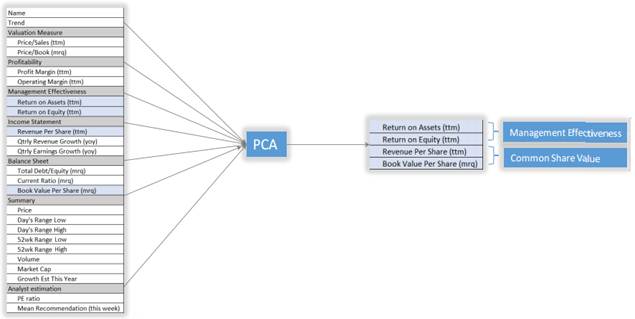
Figure 1. Variables and Factors from Principle Component Analysis.
5.2. Reliability Analysis
For Cronbach Alpha, the closer the value is to 1, the better the reliability of the factor. The Cronbach’s Alpha co-efficient value for the factor, Management Effectiveness (Return on Equity and Return on Assets) was 0.838 which is very good and confirms the reliability of Management Effectiveness as a factor.
The Cronbach’s Alpha co-efficient value for Common Share Value (Revenue per Share and Book Value per Share) was 0.762 which is good and confirms the reliability of Common Share Value as a factor.
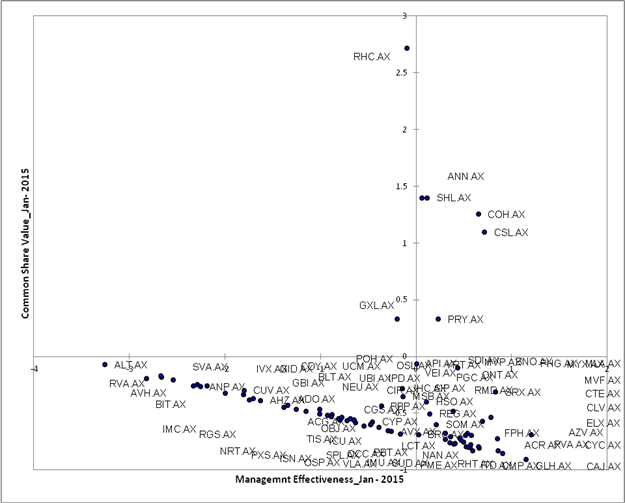
Figure 2. Perpetual Map using the Factors from PCA.
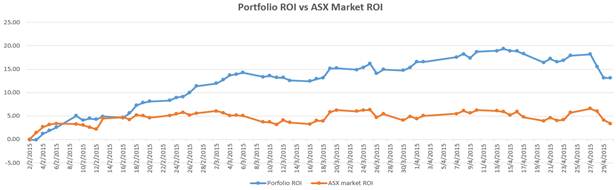
Figure 3. Portfolio ROI vs ASX Market ROI.
We are interested in stocks that are high in Management Effectiveness and also high in Common Share Value. We denote winning stocks as the ones that are high in Management Effectiveness and also have high in Common Share Value when compared with the other Australian health care sector stocks. From the above perceptual map, as seen in figure 2, the health care stocks such as ANN.AX, SHL.AX, COH.AX, CSL.AX and PRY.AX are considered as winning stocks.
The principal component analysis procedure discussed above was repeated for the months of February and March and was the results were consistent. This confirms that the results were not by chance as they repeatedly, for all 3 months gave the same factors and winning stocks.
We then tested how good the winning stocks were by paper trading with the winning stocks in the Australia stock market. The resulting return on investment (ROI) for the portfolio of stocks for January, February and March respectively was 11.38%, 15.36% and 13.12% whereas the ROI for ASX were 5.58%, 4.11% and 3.35% respectively. These results demonstrate that the PCA has effectively selected winning stocks that can give an investor a good return on investment. The Figure 3 below illustrates the comparison of ASX and our portfolio ROI.
6. Conclusion
Our research has demonstrated that we can reduce twenty two stock market fundamental variable indicators to four important variables namely Return On Investment, Return on Equity, Book Value per Share and Revenue per Share. These four variables are sufficient in accurately identifying stock with an upward trend movement.
Further, we learnt from the principle component analysis that the above four variables loaded as two key important factors. We named the factors 1 and 2 as Management Effectiveness and Common Share Value respectively.
With the results from the principle component analysis and the perceptual map, we could clearly identify the stocks that were high in Management Effectiveness and high in Common Share Value. The healthcare stocks, ANN.AX, SHL.AX, COH.AX, CSL.AX and PRY.AX were considered as winning stocks.
From the stock paper trading in February 2015, March 2015 & April 2015, we further demonstrated repeatedly that our systematic and scientific approach to select winning stocks proved effective as the ROIs for the February 2015, March 2015 & April 2015 were statistically significantly higher than the respective ASX ROIs.
In a nutshell, we have shown that stocks which have good management effectiveness and high common share value may be considered winning stocks. Investment firms/brokers may use this approach to save time and make money.
References
- Wang, Z., Sun, y., Stockli, P. (2014). "Functional Principal Components Analysis of Shanghai Stock Exchange 50 Index".Discrete Dynamics in Nature and Society Volume 2014 (2014), Article ID 365204, 7 pages
- Mbeledogu, N.N., Odoh, M., Umeh, M.N. (2012). "Stock feature extraction using Principle Component Analysis". International Conference on Computer Technology and Science. IACSIT Press, Singapore DOI: 10.7763/IPCSIT.2012.V47.44
- Loretan, M. (1997). "Generating market risk scenarios using principle component analysis: methodological and practical considerations". Federal Reserve Board. https://www.bis.org/publ/ecsc07c.pdf
- Wang, Y., In-Chan Choi. (2013)." Market Index and stock price direction prediction using Machine Learning Techniques: An empirical study on the KOSPI and HSI". Science Direct. Pages 1-13. http://arxiv.org/pdf/1309.7119v1.pdf
- Kadirvel Mani Chandrika (2015) Web scraping in a simple way. http://chandrikakadirvelmani.blogspot.sg/2015/04/web-scraping-in-simple-way.html.
- Expectation Maximization Method. http://www.psych-it.com.au/Psychlopedia/article.asp?id=267.
- James Dean Brown. "Choosing the Right Type of Rotation in PCA and EFA". JALT Testing & Evaluation SIG Newsletter. 13-November,2009(p.20-25) http://jalt.org/test/PDF/Brown31.pdf
- Missing data mechanism. http://www.uvm.edu/~dhowell/StatPages/Missing_Data/Missing.html
- KMO & Bartlett’s sphericity test. http://eric.univ-lyon2.fr/~ricco/tanagra/fichiers/en_Tanagra_KMO_Bartlett.pdf, http://staff.neu.edu.tr/~ngunsel/files/Lecture%2011.pdf.
- Mohsen Tavakol and Reg Dennick."Making sense of Cronbach's alpha". International Journal of Medical Education 2011; 2:53-55. ISSN:2042-6372,DOI:10.5116/ijme.4dfb.8dfd, http://www.ijme.net/archive/2/cronbachs-alpha.pdf


