
American Journal of Marketing Research, Vol. 1, No. 3, October 2015 Publish Date: Aug. 3, 2015 Pages: 130-135
Product as the Main Marketing Tool
Romana Hricova*
Department of Manufacturing Management, Faculty of Manufacturing Technologies with a Seat in Presov, Technical University of Kosice, Bayerova, Presov, Slovak Republic
Abstract
Nowadays, marketing is considered one of the main tasks of each business. It is not only an important element of business because its mission is to satisfy customers, but also strong tool in the business competition. Every company which wants to make a business successful must pay attention to product, product quality and know how to sell the products. The article deals with part of product portfolio in chosen Slovakian company, where is shown, how company has to work on its portfolio. Analysis was used to divide 37 selected products which were ranked according to profitability above the cost of production and annual sales volume in four quadrants of the matrix. This division allows the company subsequently adjusts their product portfolio, optimize it and take action according to how beneficial the product is. As it turns out, it is important not only profitability, but annual volume sales of the product as well. Finally, recommendations for individual quadrants allow company to stabilize its portfolio, to stop unnecessarily lose out on those products that do not produce income, but on the other hand, sensitivity select those products, where there is a chance to propose measures for improvement.
Keywords
Product, Matrix, Quadrant, Product Placement
Received: July 9, 2015
Accepted: July 20, 2015
Published online: August 2, 2015
@ 2015 The Authors. Published by American Institute of Science. This Open Access article is under the CC BY-NC license. http://creativecommons.org/licenses/by-nc/4.0/
1. Introduction
As companies tend to compete for customers, it is necessary to use all available means to obtain customer loyalty. If companies use modern means of marketing their success is growing. Companies are using marketing tools, but without a good product their efforts are often in vain. It is therefore necessary that every business should always first have in mind the product, know its life cycle and give it proper attention.
Companies focus on needs that can be understood as recognition of specific shortcoming or discrepancy, which brings a strong desire to lessen it. Sellers always try to recognize the needs, demands and wishes of the market. Needs turn into wants by specifying it so that it is possible to satisfy. It is absolutely fundamental to be able to distinguish between needs, wants and demand.
People satisfy their wants and needs by distinct products. A product can be described as everything that can be provided to a person that one may satisfy their need or want. Products provided can be goods, services or even ideas.
Customers choose among numberless products that can satisfy a specific need. The product whose value is found the highest is chosen by customers. The value is given by the degree to which a specific product is able to satisfy customers´ needs. The success of the offer depends on the value and satisfaction a product offers to the target customer. Customers choose among a wide range of products those that declare to grant the highest value. For this purpose the value can be understood as the ration of what a customer gets and what he gives in return.
It is evident that nowadays there are no sellers able to satisfy every customer in the market. That is the reason why sellers often deal with the issue of market segmentation. They try to find such groups of people who have similar needs and wants and often also the same behaviour. In order to define such groups of customers for specifying market segments in consumers markets, demographic and psychometric information can be used. Marketing specialists must decide which segment is the best market opportunity and thus enables the best satisfaction of market needs. Only after that the company can prepare market offers for each chosen segment. The offer must then be presented to potential customers as an important utility.
Conventionally markets used to be understood as places where sellers and buyers met in order to exchange their goods. Economists generally characterize markets as sets of buyers and sellers who take part in transactions of certain groups or classes of products. Market managers, however, know that sellers form various branches and buyers are those who create markets.
Seller is a person who looks for reaction (attention, intention to buy, choice or intention to obtain something as a gift) from the group of those who can be identified as potential customers, i.e. a group of people as a party willing to buy or get something.
2. Objectives of the Articles
Objectives of the article can be divided to primary and secondary objectives. The primary objective is to show how to divide a selected group of products according to the monitoring indicators in the chosen company. In general, it is appropriate to divide the products according to whether there is accordance with the company strategy & level of the company production. Because the company could not provide all the information required, therefore, was selected group of 37 products included in the matrix according to profitability and total annual sales. As secondary objective there is a task to propose concrete solutions within individual quadrants into which they have been randomly assigned.
3. Literature Review
3.1. Marketing Mix
The term "marketing mix" was made popular by professor Neil Borden of Harvard Business School in 1964 in his article "The Concept of the Marketing Mix" (Borden, 1964). After James Culliton (Jain, 2009) described a marketing manager as a "mixer of ingredients", Borden started using the term "marketing mix" in his lectures in the late 1940s. The ingredients of Borden’s marketing mix were: product planning, pricing, branding, distribution channels, personal selling, advertising, promotion, packaging, display, servicing, physical handling, fact finding and analysis. E. Jerome McCarthy (Jerome, 1960) later grouped these tools into four categories. Kotler and Armstrong (2010) defined marketing mix as the set of controllable tactical marketing tools – product, price, place, and promotion – that the company blends to produce the response it wants in the target market. Those are today known as the 4P model. At present there are several different approaches to marketing mix. For example Young & Pagoso (2008) write, that components of marketing mix may be grouped as 5P's, namely as product, price, place, promotion and people.
Kotler & Armstrong (2010, p.72) explained the marketing mix as something what must be driven by the marketing strategy. The marketing strategy helps to identify the target customer for the products. During market segmentation (Kotler & Armstrong, 2010) different groups of consumers are identified according to their needs.
To know company's main segment could be basic advantage as company can adapt product following customers’ requirements.
3.2. Product as a Main Part of Marketing Mix
In the case of focusing on engineering production, the product is most often followed in its materialized form. The product is characterized by a complex of tangible and intangible parameters. Kotler and Armstrong (2005) defined a product as anything that can be use to attracts attention, acquisition, use or consumption to satisfy a want or a need.
There are many decisions which must be done when company decides to market products. And every single decision usually has a long term impact of the product success.
If we take the product as the major component of the marketing mix, without which the other components cannot exist and are not therefore bound, then it is obvious that the product must be given the highest priority.
Especially nowadays companies tend to make difficult decisions about their products. Some of them must reduce their new product development and marketing budgets at all (Kotler & Caslione, 2009). Efforts to improve products profitability often affect customers. It's the marketer’s responsibility to ensure that negative impacts are avoided or minimized and that new procedures are carefully presented to customers (Lovelock & Wright, 1999). Of course the impact could be positive or negative. Positive impact should be promoted as a new advantage. Negative must be reduced to the lowest level and if it possible, the company should compensate the customers. Marketers must very carefully control the position of the products, how to exploit the company's resources and how to configure the product mix so that each product complements the other (Needham, 1996).
4. Methodology
The data used in the following analysis were obtained directly from the chosen company. A company whose part of production was selected as suitable for analysis has been at the electro-technical market for more than 60 years and has become a well-established producer of low- and high-voltage products, such as main circuit breakers up to 125A, cam switches, switchgears, surge guards, wiring devices, outdoor and indoor disconnectors and isolating switches. At the same time the company manages its own tool shop, in which tools and moulds are produced. The company has been given ISO quality management system certificates and other certificates which confirm that the company produces top-quality products. An active role the company plays in relation to its customers is proved by the fact that it currently exports to over 30 countries worldwide.
4.1. Data Analysis – General Matrix
If we want to analyze the product, it must be clear where the product is placed in terms of profitability and what can be expected from the product in the future. The product can be in the company at different stages of the life cycle, its production can be profitable or unprofitable, and so on. It is therefore useful to find the right place for every product in the matrix in figure 1:
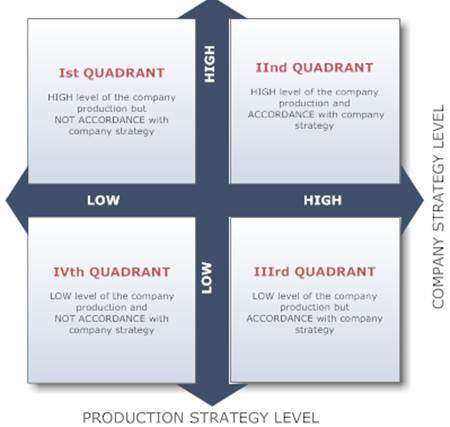
Fig. 1. Basic product matrix.
Source: Author
Quadrant 1
All products that belong to the first quadrant are very important for the company. Huge sources are invested to their production although the products are not in accordance with the company strategy. Because of it is very topical to pay attention to integration of products into the organization's strategic objectives. Usually the products belonging there have high technical and technological level.
Quadrant 2
Products belonging there are basement of the company's production because of the highest annual turnover. The company on its own behalf must invest additional money and paid special attention to investments, as keeping this position as long as possible is priority of the company's management. The products in the second quadrant create the company's "skeleton".
Quadrant 3
Customers are interested in products that belong to the third quadrant but products themselves are of average profitability. On the other hand, they still earn enough to be in the third quadrant. Many companies customarily use the profit to finance production of products in the third quadrant from the profit obtained from the first and second quadrants. This decision helps to keep products in their long-term profitability. But also there exists another solution that can bring higher profitability – to apply outsourcing. Outsourcing should reduce production costs.
Quadrant 4
The worst quadrant, here belong the products with low profitability and annual turnover. Also the products are not following the strategy of the company. For that reason the company has to seriously decide whether it continues of stops the production of such products.
Let’s follow the most disputable third quadrant. Products here are following the company's strategy, but their profitability is very low. The company wants to keep the production as there is still a part of customers interested in the products, but on the other hand, other products are paying off.
4.2. Matrix Adaptation in Particular Company
To adapt the matrix in our particular company, a group of products was chosen. The company provided information; example is shown in Table 1. The data is given in percent. The company provided information on the profitability above their own cost of production, profitability above their own full cost of production (subtracting their own overhead) and annual sales volume. The profitability of these selected products was calculated as the average of the selling price and the cost.
Table 1. Example of chosen products for analysis.
| No | Product name | Profitability above cost of production | Profitability above full cost of production | Annual sales volume |
| 1 | Single-pole switch white | 70.9% | 55.7% | 27 495 |
| 2 | Reversing alternating switch white | 51.7% | 36.5% | 16 734 |
| 3 | Single-pole switch | 80.7% | 64.7% | 32 439 |
Analysis was carried out on group of 37 products from electric switches and modular devices. An annual sale basically shows how important the product is for the company.
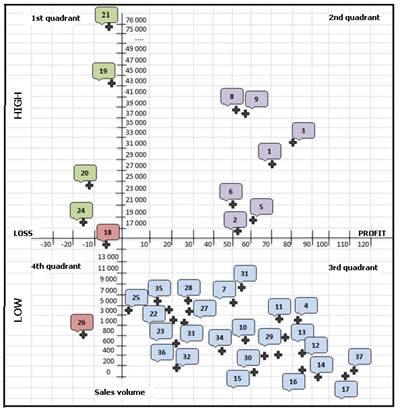
Fig. 2. Product placement in the matrix following profitability above cost of production.
Source: Author
In the first quadrant there are products which are in high losses, and are not at all convenient for the company. But their sales volume is high, and two of the items are even best-selling products of the selected group.
In the second quadrant there are products that not only have high profitability, but also their sales volume is high. Therefore they comply with the company strategy because customers are buying these products, they are in demand, and popular with customers. From the perspective of the company it is the most important quadrant because products placed here are produced in high volumes, allowing to reduce fixed costs. At the same time these products bring high profit. The only problem seems to be the fact that only 7 out of 37 products were placed in this quadrant, which represents less than 20%.
24 products were placed in the third quadrant, which represents the largest volume of sales of selected products, almost 65%. That is why these products are as important as those in the first quadrant. Although the volume of their production is not as high, their production is in line with the corporate strategy and their profitability is still interesting for the company.
The fourth quadrant appears to bring the highest risk. In this quadrant there are products that do not bring profit to the company and also their annual sales volume is low. Taking into account the profitability above their own production costs, then there are only two products, which are placed in this quadrant that the company should seriously consider as for future production. It is questionable whether the two products have a place in the manufacturing portfolio, as they are not only a loss for the company, but their volume is not high.
Taking into account the profitability above their own full cost of production, then the alignment of products in the matrix gently moves to the left, which brings in focus the products that absolutely necessarily need changes.
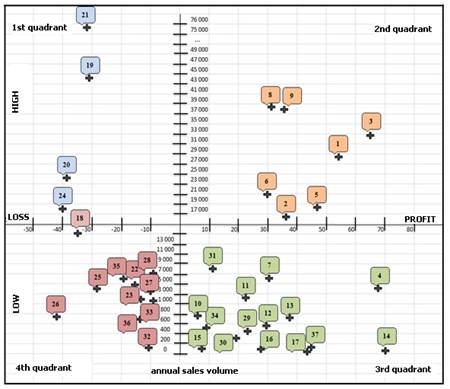
Fig. 3. Product placement in the matrix following profitability above full cost of production.
Source: Author
After taking into account company´s full production cost (i.e. also the budgeted overhead costs), the matrix gains a new dimension; especially the problematic quadrants one and four, where changes must take place.
5. Results & Discussion
The first quadrant contains four products, which bring the highest loss, but in two cases (i.e. 50%) they are products with the highest sales volume. Therefore, the best solution appears to be a modification of the marketing mix. As the company did not provide accurate information about costs, a recommendation may be only in general terms. In terms of product, it is necessary:
• to look for new (more economical) modifications and materials,
• if a product is manufactured in several versions: the company should cease to produce several versions of the same product and stay at only one basic version,
• to look for other options for reducing production costs
Distribution can also be modified in these terms:
• finding a cheaper supplier (cheaper suppliers) material(s) or components,
• finding new ways of selling their products (e.g. their own store, e-shop...)
As for prices, there is not much room for manipulation, since the price increase would discourage existing customers. On the contrary, a reduction in prices with a view to higher sales could be a double-edged sword, as the marketability would not increase but reduced prices would increase losses even further. Here is only one general recommendation – to provide quantity discounts.
Regarding the promotion, the following measures could be done:
• introduce promotions for regular customers purchasing large volumes (e.g. bulk discount),
• make offers to potential clients,
• create loyalty program...
Regarding the products from the third quadrant, it would be appropriate to cease the manufacture of these products in-house and move to outsourcing. When selecting an appropriate manufacturer, the company would not have to completely lose control over the goods, but it would save resources necessary for the manufacture of these unprofitable products.
6. Conclusion
The article focuses on product analysis of the chosen company. Primary reason why is necessary to make the analysis was showing, how important is known, where exactly the product belongs. Knowing their products, the marketing mix bound to them and being able to work with it effectively are very important points in today's modern company. It is also a challenge how to be profitable, not to produce loss, and managed to maintain the gained place in the turbulent environment of today's market. Companies must continuously evaluate their marketing mixes, work with them and modify them according to the changing market.
References
- Borden, N.H. (1964). The Concept of the Marketing Mix, Journal of Advertising Research, Vol. 4, June 1964, pp. 2‐7.
- McCarthy, Jerome E. (1960). Basic Marketing. A Managerial Approach. Homewood, IL: Richard D. Irwin.
- Balog, Michal – Straka, Martin (2014). Application of the logistics principles for the company Omega, s.r.o. in crisis time. In: Acta Logistica. Volume 1, No. 1 (2014), p. 17-21. ISSN 1339-5629
- Jain, Ashok (2009). Principles of Marketing. V. K. India Enterprises, p.76. ISBN 978-81-88597-98-7
- Kotler, P. & Caslione, J.A. (2009). Chaotics: The Business of Managing and Marketing in the Age of Turbulence. AMACOM, a division of American Management Association, New York, 1st edition. ISBN 978-0-8144-1521-4
- Kotler, P. & Armstrong, G. (2010) Principles of Marketing. 13th (Global) ed. Boston: Pearson Education, Inc.
- Kotler, P., & Armstrong, G. (2005). Marketing: An introduction, New Jersey: Pearson Education Incorporation.
- Lovelock, Ch., H. & Wright, L. (1999). Principles of Service Marketing and Management. Prentice Hall, 1999, 414 p.
- Young, F. C. & Pagoso C.M. (2008). Rex Book Store, Inc. 1st edition. ISBN 978-971-23-5063-4
- Needham, Dave (1996). Business for Higher Awards. Oxford, England: Heinemann.


