
American Journal of Marketing Research, Vol. 1, No. 4, December 2015 Publish Date: Sep. 19, 2015 Pages: 208-214
Analysis of Hotel Guest Satisfaction Ratings and Reviews: An Application in Singapore
Carol Anne Hargreaves*
Institute of Systems Science, National University of Singapore, Singapore, Singapore
Abstract
The hotel industry in Singapore is an important part of the hospitality and tourism infrastructure and a strategic part of Singapore’s growth story. Hotels are primarily viewed as a service industry with intangible areas of guest experience and service levels. The research objective of this paper is to better understand the hotel guest satisfaction and the areas that hotel management can change, in order to get better results. For this purpose, an analysis of hotel guest satisfaction ratings based on attributes such as Location, Sleep quality, Rooms, Service quality, Value for money and Cleanliness was performed. Further, text analysis of customer reviews was also performed to better understand the positive and negative sentiments of hotel guests. We focused on identifying the attributes that differentiate one hotel from another, and then using these attribute insights to make recommendation to hotel management, on how they can improve their operations, guest satisfaction and generally differentiate themselves from their competition. Data from an online website, Trip Advisor, was used to analyse and compare customer ratings and reviews on five hotels. Statistical data analysis techniques were used to identify the key attributes that are most important in choosing hotels and are critical to focus on in order to ensure guest satisfaction expectations are met. Based on text analytics, the key results from this study indicated that hotel guests look for a good room and a hotel with a pool and good service. Based on the ratings analysis, the most important attributes for guest satisfaction turned out to be Rooms, Value for money and Location.
Keywords
Hotel Guest Satisfaction, Hotel Reviews, Hotel Industry, Service Quality, Hotel Ratings, Text Analytics, Singapore
Received: July 7, 2015
Accepted: September 8, 2015
Published online: September 17, 2015
@ 2015 The Authors. Published by American Institute of Science. This Open Access article is under the CC BY-NC license. http://creativecommons.org/licenses/by-nc/4.0/
1. Introduction
With the easy access to technology and information, IT has enabled all aspects of the hotel industry with choice and identification of a hotel, hotel recommendations and booking of hotel accommodation using web and mobile based applications. Reviews, price comparisons and accelerated bookings have provided hotels with a potential rich source of guest data. Use of this data is providing deep consumer behavioural insights.
Further, the Singapore Tourism Board (STB) (2014) reports statistics on a quarterly basis and helps promote the industry both domestically and more importantly in
financial terms, internationally. According to the STB in Q4 2014, it supported 3.9 million visitors and S$1.366 million of accommodation Tourism Receipts with gazetted hotels registering S$800 million, an occupancy rate of 88% and a Rev PAR of S$228.
In line with many industries, the market environment is challenging and continues to evolve at an increasing pace. Increased disposable income is rising and consumers are searching search for experiential leisure and therefore demand more quality and consistency in guest experience. In choosing hotels as a destination the management needs to ensure that both the tangible and intangible aspects of the properties meet and preferably exceed expectations of their guests, whilst maintaining a profitable and productive business. They also need to manage their online presence and their guest feedback mechanisms to protect their brand reputations and ensure continued guest loyalty.
According to Choi, et al. (2001), the reason for focusing on service quality is because it has been demonstrated that the more satisfied the guests are, the more likely they will return or prolong their hotel stay Other studies have place the location and price far lower than the intangible experience and service quality received by the guest in creating return visits and loyalty.
According to Singapore Tourism Board (2014), in the
Singapore hotel industry, the average occupancy rate is 85.5% for 2014, which is much higher than the Asia Pacific region of 68.6 reported by Statistica. The higher occupancy rate leads to a tight supply at certain times with prices being elevated and guest expectations for value therefore also elevated.
In this paper a comparative study has been done on 5 hotel’s data from an online website, Trip Advisor, and analyses are based on the 6 attributes, location, sleep quality, rooms, service quality, value for money and cleanliness. A comparative study has also been done on the five major hotels using perceptual mapping, factor analysis and text analytics. The objective of this study was to understand the satisfaction levels of the hotel customers. The study measured customer satisfaction on ratings on six attributes using a Likert type scale.
Reviews were obtained from each of the 5 hotels to better understand what customers like and dislike about each hotel. Section 2 outlines the Literature Review, Section 3 outlines the research objective; followed by Section 4, covering the data source and description; Section 5 exhibits the empirical analysis and results; Finally, Section 6 summarises the main conclusions.
2. Literature Review
It should be noted that service quality and customer satisfaction are distinct concepts, although they are closely related. The relationship between quality and satisfaction is complex. Some authors have described it as Siamese twins (Jamali, 2007). Although, there still remain a lot of unresolved questions, it can be concluded that service quality and customer satisfaction can be perceived as separate concepts that have causal ordering.
Perceptual mapping when used correctly perceptual mapping can identify opportunities, enhance creativity, and direct marketing strategy to the areas of investigation most likely to appeal to customers. The statistical techniques select relative values for two, three, or four perceptual dimensions such that distance between products best corresponds to measured similarity. Perceptual maps offer a unique ability to communicate market structure analysis, illustrating the complex relationships among marketplace competitors and the criteria used by buyers in making purchase decisions and recommendations.
Choi and Chu (2001) concluded that staff quality, room qualities and value are the top three hotel factors that determine traveller’s satisfaction. Naomi Kasolowsky (2014) advocated that commitment to the customer should happen first every time in order to earn true loyalty. And further, that loyalty given purposefully, as a measurable cornerstone of your business, will yield far greater results than that which is doled out in meager, begrudging portions. Providing services those customers prefer is a starting point for providing customer satisfaction.
According to Goodman (2014), hotels must build a voice of the customer process that gathers information from across the entire customer lifecycle from multiple data sources and that integrates the process into a single, unified picture of customer experience. To ensure impact and the secure resources needed to deliver a strong customer experience, the process must quantify the revenue and word of mouth impact of problems and opportunities.
Customer data has always been important to create and manage a lasting customer relationship. Big data, digital and technology play a role in driving customer centricity. Hotels that use customer data and master customer relationship management as an organisational competency will thrive.
According to Williams (2014), Hotels need to go beyond the, what and why, with the intention of helping hotels to delve into the how. How to define measurement platforms, and how to bring a customer centric business strategy to life. We hope to also highlight in this paper, the types of problems hotel customers experience and highlight the opportunities for hotel management to respond to customer reviews and ratings and thereby improve both the customer experience and the hotel ratings and review.
3. Research Objectives and Focus Issues
There are many aspects to measure a hotels’ performance in terms of its customer experience and customer satisfaction. Customer feedback in terms of ratings and reviews was collected from 5 hotels located in Singapore from 2005 to 2014 using Trip Advisor online travel agency data. The fundamental issue for the survival and growth of hotels is measurement and management of services quality and customer experience.
The objective of this study is to analyse the customer ratings and reviews using statistical analysis, and to identify for each of the 5 Singaporean hotels, the attributes ratings by customers on location, sleep quality, room maintenance, service quality, value for money, cleanliness and overall. Further, to identify attributes on which each of the hotel stands out, factors which can be improved and the factors which influence customer satisfaction.
Text analysis was also performed to better understand the positive and negative sentiments of customer. The positive and negative sentiments will help the hotel management to better understand what the customers think of their hotel and of their services. Hence, the text analytic results will provide better insights for the hotel management, and management will be better able to make better decisions on which areas to focus on for improvements.
4. Data Source Description
The dataset contains 14 175 review records from September 2005 to September 2014 and has been sourced from the TripAdvisor online review website. Each of the review record provides a textual description of the reviewer’s comments on the hotel experience and overall ratings (1 to 5) for individual attributes such as location, sleep quality, rooms, service, value, cleanliness. Basic demographic information of the reviewer has also been collected.
The 5 hotels are:
5-Star: Raffles, Fullerton, Marina Bay Sands (MBS)
4-Star: Holiday Inn
3-Star: IBIS Bencoolen
Guests were classified into 5 segments – 1 for business travel, and 4 segments for leisure travellers classified by type of travel companions – couple, family, friends or solo. 90% of data were from the last 5 years (2010-2014), 53% are MBS guests. Of these 9,928 (70%) contain complete ratings for analysis.
Guests were asked to rate the respective hotels on 7 dimensions - Location, Service, Value, Sleep Quality, Room, Cleanliness and an "Overall" rating.
The top 5 locations from which customers came:
1. Singapore
2. Sydney, Australia
3. Melbourne, Australia
4. Perth, Australia
5. London, United Kingdom
Based on customer ratings we calculated an average rating per hotel for each attribute as shown in figure 1. We can draw some conclusions based on these calculations. Overall rating in hotel data shows a significant difference between Raffles hotel and other hotels.
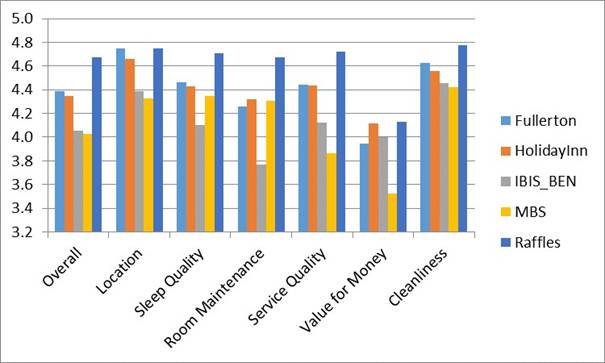
Figure 1. Comparison of attribute ratings by Hotel.
In general all five hotels have an overall rating that is greater than 4 out of 5 which means customers are satisfied with their stay. Raffles Hotel outperforms all the other hotels in almost all the attributes, hence it has the highest ratings.
79% of Raffles hotel customers gave the highest rating for overall hotel satisfaction. For the Location Attribute, both Fullerton and Raffles Hotel are tied at 4.75 which is the highest ratings however these ratings are not markedly significant compared to other hotels.
Around 12% of Marina Bay Sands hotel customers are dissatisfied with the hotel and received a rating of 1 and 2. Marina Bay Sands has the lowest overall rating that includes the lowest rating for Location, Service, Value and Cleanliness attributes.
Around 56% of customers of the Ibis Bencoolen Hotel gave them a rating of 4.Ibis Bencoolen Hotel has the lowest rating for the attributes Sleep Quality and Room.
Ratings for cleanliness for all hotels are almost similar, there is no markedly significant difference, difference between them in terms of cleanliness, as the standard deviation is 0.14. except for Raffles Hotel, which is slightly higher than the other hotels.
Using the analysis of variance technique, we compare the overall rating of the five hotels. There was a statistical significant difference on overall rating of five hotels. This means that the 5 hotels do differ on the ‘overall’ attribute ratings by customers. Based on the ratings by customers, we can recommend the following:
IBIS_BEN: Room parameters are affecting IBIS’s ratings. IBIS is also average when it comes to value for money. Major improvement in room conditions with a slight reduction in prices will improve IBIS’s ratings.
MBS: Costumers perceive that MBS provides low value for money. Even though costumers have commented on the services provided by MBS like Infinity pool, etc., its high pricing is a major concern area.
Holiday Inn and Fullerton: Both these hotels score well in value for money but are average when it comes to room parameters. By improving room parameters, these hotels can increase their ratings.
Raffles: Raffles scores heavily in all parameters and is therefore perceived highly. The following observations were made, couples constitute the maximum share of guests in all hotels (with Raffles being the highest) except Holiday Inn. Majority of Holiday Inn’s guests are people travelling with their families. Further, the majority of the customers from all segments prefer to stay in MBS except solo travellers who prefer staying at the IBIS. Cost might be one of the reasons for this as IBIS is an economy hotel. See figure 2 below.
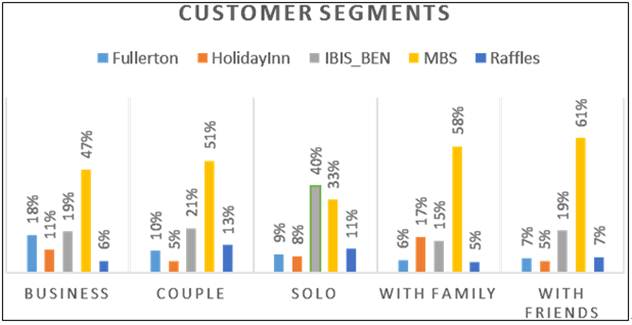
Figure 2. Customer Segments.
5. Text Analytics – Management Improvement Areas
In order to further understand customer sentiments, text analysis was performed on the reviews. In text analysis, the reviews given by customers were compared for all the hotels using the mined the data.
The following steps were followed for text mining:
1. Extraction of text
2. Removal of unwanted characters such as commas, hyphen, etc.
3. Removal of white spaces
4. Remove stop words such as for, at, etc.
5. Stem words such as impressive and impress are the same
6. Remove domain specific words such as hotel, room, pool, etc.
7. Remove very sparse words e.g. words which occur infrequently
One simple technique of text mining is to form a Word Cloud. We used R in order to form the word cloud in figure 4 below.
Based on the text analysis, the most frequently used words were room, stay, pool, Singapore and service. This indicated that people are looking for a good room and a hotel with a pool and good service above other factors. (Please refer to figure 4 below).
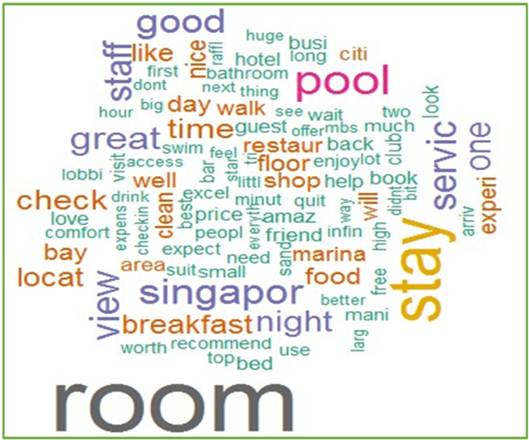
Figure 3. Text Analysis Word Cloud.
We take two hotels as our example. The Ibis Bencoolen and Marina Bay Sands are analyzed as they have the lowest rating on hotel attributes compared to the other three hotels. Word cloud of Ibis Bencoolen review is depicted in 4 below.
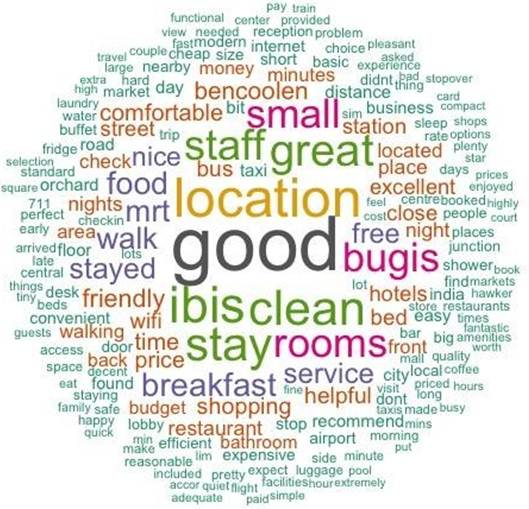
Figure 4. Text Analysis Word Cloud for IBIS Benecoole.
Overall customer review shows that customers are satisfied with Ibis Bencoolen. This is proven by the frequent occurrence of the word "good". Room size that is described by the word "small" can be the weakness of the hotel property. This is reflected on the lowest ‘Room’ rating among the five hotels as shown in figure 1. This is further supported by some reviews that complain about the room size.
Marina Bay Sands hotel review points out following issues.
See figure 5 below.
• Customers are impressed by the world renowned hotel facility, infinity pool, which offers a great view.
• Word of "Service has been used many times by customers. This shows customer dissatisfaction as Marina Bay Sands has the lowest rating on customers
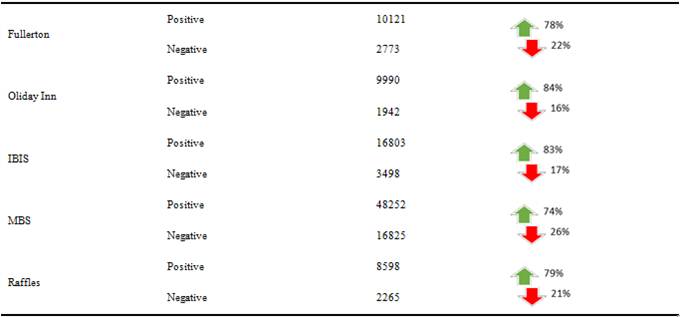
We calculated the sentiments on the basis of a standardized English word list of positive and negative words (Please refer to github): A happy review will have a higher proportion of positive words than negative words as seen in table 1 below:
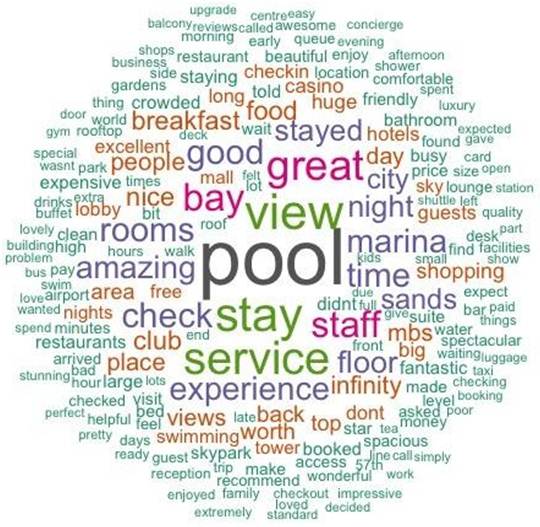
Figure 5. Text Analysis Word Cloud for Marina Bay Sands.
Table 1. Sentiment Analysis by Hotel.
Negative Sentiment Analysis
Based on the 15 037 data points gathered on all the negative comments on the 5 hotels, MBS have the most negative feedback of approximately 60%. On top of this feedback, approximately 60% of MBS negative comments are from general dissatisfaction; pricing and billing come second, follow by product functioning, attitude and lastly service knowledge.
IBIS_BEN hotel ranks 2 in overall negative comments with about 15% as general dissatisfaction as the main concern. Both Fullerton and Raffles hotel score about the same at approximately 9% and both with general dissatisfaction as the main top hits. Holiday Inn is the best out of the 5 hotels with approximately 8% as general dissatisfaction, but also with general dissatisfaction as the main concern. All hotels show the same pattern that general dissatisfaction is the overall main concern.
Most of the Fullerton hotel’s comments come mainly from customers who travel as a couple or business trip that contribute for approximately 60% from the overall of 1365 negative comments. General dissatisfaction is a main concern that needs to work on to improve. Both pricing and billing is also a concern as it comes second to overall negative feedback.
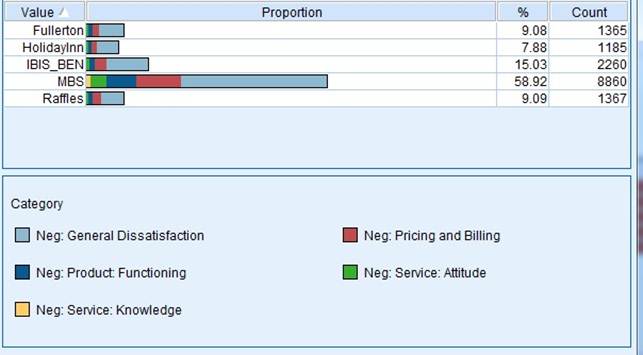
Figure 6. Negative Sentiments.
Holidy Inn hotel with 21% "as a couple", 18% "on business" and 45% "with family" are the 3 main contributor to overall comments that summed up at approximately 85% of overall comments. General dissatisfaction, pricing and billing are top 2 factors to be considered for improvement.
Customers who travel as a couple got the highest negative feedback for IBIS_BEN hotel. Customer segments of "on business", "with family" & "solo" are all above 10% from overall comments. General dissatisfaction followed by price & billing are the top 2 factors that received the most feedback. The negative comments on service might also need to draw hotel management’s attention to improve the quality of service in order to improve customer retention.
Top 3 category on MBS hotel comes from the "as couple" segment, then the "with family" segment, follow by the "on business" segment. The top three customer segments comments contribute to approximately 75% to the overall comments. General dissatisfaction, pricing and billing are still top 2 factors. It is recommended that service quality can be improved by having more adequate training on customer service for the front desk.
The negative feedback for Raffles hotel came from the "as couple" segment and it contributes to about 50% of the overall comments. "General dissatisfaction" and "Pricing and Billing" were also seen as the two main concerns.
6. Conclusion
Based on the TripAdvisor data from September 2005 to September 2014, we found the following:
Location:
• Fullerton and Raffles reviewers love the location of these hotels where 97% of these reviewers have given a high rating for their locations.
• MBS has maximum reviewers who are unhappy with the location (3%) Room:
• Only 1% of the Holiday Inn reviewers have rated the hotel low for the room quality, while IBIS has received the highest percent of low ratings from its reviewers for the same (5%)
• Raffles reviewers seem overall satisfied with the room quality as 93.5% of its reviewers have given an overall high rating.
• On the other hand, only 18% of IBIS reviewers have rated 5 for its rooms.
Sleep Quality:
• More than 70% of the reviewers for the hotels have given overall high ratings for the sleep quality in the hotels. However, Raffles has a significantly higher percent of reviewers rating it an overall high rating (95%) which is much higher than the other 4 hotels.
• Only 1.6% of the Holiday Inn reviewers have rated low for its sleep quality while 5% of the MBS reviewers have rated low for MBS Sleep quality.
Service:
• 94% of the Raffles reviewers have given high ratings for service which is the highest among the 5 hotels while only 68% of the MBS reviewers gave high ratings for MBS.
• Holiday Inn has the least percent of low reviews from its reviewers (1.77%) while MBS has the highest percent of low reviews from its
• reviewers (15.85%)
• 84% of the Raffles reviewers have given the best rating to Raffles for its service which is much higher than the other 4 hotels.
Value:
IBIS has the highest percentage of people rating
1 for value as compared to the other 4 - 14%
• 82% of the raffles reviewers think that the hotel is overall value-for-money which is much higher than the others while only 53% of the MBS reviewers who think the same about MBS.
• 18% of the MBS reviewers do not think that MBS is value-for-money, which is much higher than the other 4 hotels.
Clean:
• Raffles does not have any 1 rating for cleanliness
• Out of 723 ratings for Raffles cleanliness, 84% have rated 5, much higher as compared to the other 4. Ibis has the least rating of 5 - 53%
• MBS has lowest percentage of good rating from the total ratings for cleanliness - 87% & 95% of the ratings for Raffles are good (4, 5) for raffles.
Activities and experiential nature of the location
There were several negative comments for each of the five hotels. What can hotel managers do about those negative comments? Recommendation could be made:
a. Make adjustments and find the solution to improving customer service quality by training staff to
b. on how to respond to customers negative feedback.
c. Begin to track the negative comments over time and measure the progress in reducing negative sentiment.
d. Reward staff for their efforts in improving customer service quality and experience.
Overall, Raffles hotel appears to have the highest ratings given by most of customers. Based on the frequency of words in customer reviews and the insights from customer ratings, we see that room and service are important variables for consideration. The major keywords from the 5 hotels that were specially emphasized on were, Hotel, Room, Staff, View, Great, Good, Services, Location. Hotel managers should therefore, at the minimum strive to exceed customer expectations on these attributes.
References
- Choi, T. Y. and Chu, R. (2001), "Determinants of hotel guests satisfaction and repear partronage in the Hong Kong hotel industry", International Journal of Hospitality Management, 20, 277-297.
- http://www.stb.gov.sg/statistics-and-market-insights/marketstatistics/2014hs(updated%2007apr15).pdf.
- www. statista. com/statistics/266741/occupancy-rate-of-hotels-worldwide-by-region.
- Goodman, J.A. (2014). Customer Experience 3.0: High Profit Strategies in the Age of Techno Service. American Management Association.
- Williams, D. (2014) Connected CRM: Implementing a Data-Driven, Customer Centric Business Strategy. Wiley.
- Choi, T. Y., & Chu, R. (2001). Determinants of hotel guests' satisfaction and repeat patronage in the Hong Kong hotel industry. International Journal of Hospitality Management, 20: 277-297. 18. Jamali, D. (2007). A study of customer satisfaction in the context of a public private partnership. International Journal of Quality & Reliability Management, 24(4): 370-385.
- www. tripadvisor. com.
- Shwu-Ing Wu, Pei-Chi Li (2011). The relationships between CRM, RQ and CLV based on different hotel preferences. International Journal of Hospitality Management 30 262-271.
- Naomi Kasolowsky (2014). Maintaining Customer Loyalty. Consumer Connection Brand Loyalty. Marketing Insights. January/February. 18-19.
- Tito Conti (2013). Viewpoint. Planning forcompetitive customer value. The TQM Journal. Vol.No. 3. Pp. 224-243.
- Shwu-Ing Wu, Jui-Ho Chen (2012). Comparison between hotels and motels using CRM effect model. An empirical study in Taiwan. International Journal of Hospitality Management 31. 1254-1263.
- https://github.com/jeffreybreen/twitter-sentiment-analysis-tutorial-201107/tree/master/data/opinion- lexicon-English).


