
American Journal of Marketing Research, Vol. 1, No. 2, August 2015 Publish Date: Jul. 20, 2015 Pages: 70-78
Analysis of the Structure and Conduct of Paddy Rice Marketing in Benue State, Nigeria
Abah Daniel Abah1, *, Abu Godwin Anjeinu2, Ater Peter Iorhon2
1Department of Agribusiness, College of Management Sciences, University of Agriculture, Makurdi, Benue State, Nigeria
2Department of Agricultural Economics, College of Agricultural Economics and Extension, University of Agriculture, Makurdi, Benue State, Nigeria
Abstract
The broad objective of this study was to analyse the structure and conduct of rice marketing in Benue State, Nigeria. A total of two hundred and forty questionnaires were administered to the respondents in the three geopolitical Zones of the State using a multi-stage sampling procedure. The objectives were achieved using descriptive statistics and Lorenz Curve. The study found that majority (65.4%) are small holder farmers with sales income of 200,000 Naira or less per annum. Most respondents are members of marketing associations, source information through middlemen and sell their paddy based on current prices. The results further showed that there is freedom of entry and exit into the market as well as, lack of adequate marketing information. There is inequality in the market power concentration. The Gini Coefficient for Zone A (0.53) is higher than Zone B (0.46) and Zone C (0.46). The market structure was found to be oligopsonistic. Majority of the respondents sell their paddy immediately after harvest, they rely on family or personal sources for business finance, they have attended training related to their business, they sell improved varieties of paddy and they do not collude to fix prices, nor advertise their paddy for sale. The study recommends that government should provide financial support to foster farmer-operated rice processing facilities.
Keywords
Analysis, Structure, Conduct, Paddy, Rice, Marketing, Nigeria
Received: June 19, 2015
Accepted: July 2, 2015
Published online: July 16, 2015
@ 2015 The Authors. Published by American Institute of Science. This Open Access article is under the CC BY-NC license. http://creativecommons.org/licenses/by-nc/4.0/
Contents
1. Introduction 2. Methodology 2.1. The Study Area 2.2. Population and Sampling Procedure 2.3. Data Collection Techniques 2.4. Data Analysis Techniques 3. Results and Discussion 3.1. Structure of the Paddy Rice Market in Benue State 3.2. Market Conduct for Paddy Rice in Benue State 4. Conclusion and Recommendation
1. Introduction
Agricultural sector in Nigeria was the major source of revenue and the dominant sector of the economy before the early 1970s (Abu et al., 2001). It was the major development drive of the economy employing over 80% of the active population (Adegboye, 2004). It also contributed over 60% to the nation’s Gross Domestic Product (GDP) and provided almost 100% of the economy’s food requirement, raw materials to industries, and the country’s export earnings among others (Abu et al., 2001). However, when oil became a major export earner for the country, agriculture’s contribution to GDP began to decline from over 60% in the early 1970s to less than 26% in 2007 (Aigbokhan, 2001; CBN, 2007). The major agricultural products were cassava, corn, rice, millet, cocoa, groundnut, palm oil, rubber, sorghum, yam and livestock (Aminu and Anono, 2012). Today, rice is the most important staple food and the most common cereal food crop in Nigeria (Akpokodje et al., 2001; NCRI, 2004). In West Africa sub-region, Nigeria is the largest producer of rice (Oyinbo et al., 2013). About 5.4 million metric tons of rice is consumed annually in Nigeria. Of these, local production accounts for only 2.3 million metric tons per annum while the remaining 3.1 million metric tons is imported. This makes Nigeria the second largest importer of rice in the world after Indonesia (Adejumo-Ayibiowu, 2010; FAO, 2013). The average yield for rice in the country was 0.96 MT/ha in 2004 against 2.1 MT/ha in the mid-1980s. This showed a decline in yield of 54% below the peak yields of the 1980s and is only 23% of world average yield of 4.1 MT/ha (IFDC, 2008).
Market performance includes the relative efficiency of production (that is, price relative to the average cost of production). Marketing ought to provide access to irrigated land, appropriate farm inputs and market information including agricultural best practices and pricing in the Nigerian rice market. According to Bain (1951), industry structure drives industry conduct, which in turn drives industry performance. Therefore, the inability of marketing to perform this function and stimulate production is an indication of inefficiency of the marketing structure.
Bamidele et al. (2010) reported that successive governments in Nigeria have intervened in the rice sector by increasing import tariffs so that local production could be encouraged to stem the prevailing supply deficit. This protectionist policy of successive governments did not yield the desired result (Adejumo-Ayibiowo, 2010) due to its failure to address the inefficiency of the rice market structure. Market performance is a reflection of the impact of structure and conduct on product prices, costs, volume and quality of output (Hill, 1997). To improve the performance of rice marketing will require proper planning and decision-making which is dependent on adequate empirical knowledge of the market structure and the behavior of the various actors in the marketing system (Dessalegn et al., 1998). In various attempts to provide information on the rice market in Nigeria and to recommend appropriate solutions on how to improve rice marketing structure, many scholars have carried out studies on aspects of rice marketing in the country. However, the scholars’ works on the structure and conduct of paddy rice marketing in Nigeria are still limited. This study seeks to achieve the following objectives: (i) to examine the market structure of paddy rice marketers in Benue State; and (ii) to examine the market conduct of paddy rice marketers in the study area.
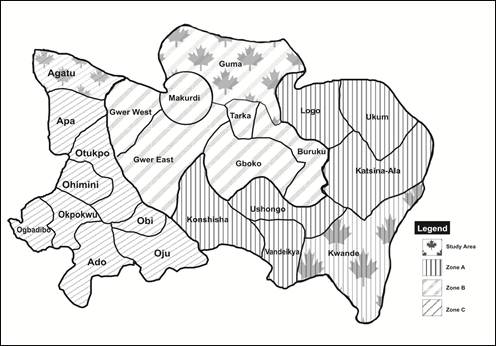
Figure 1. Map of Benue State Showing the Study Area.
Source: Modified from https://www.onlinenigeria.com
2. Methodology
2.1. The Study Area
The study area is Benue State. Benue State is one of the 36 States of Nigeria. There are 23 Local government Areas in the State and it’s headquarter is Makurdi. The State lies in the Southern Guinea Savanna between latitudes 6°25' N and 8°8' N and longitudes 7°47' E and 10° E (Onlinenigeria, 2003) and is generally low land estimated to be 5.09 million hectares. The arable land in the State is estimated to be 3.8 million hectares (Benkad, 1998). The State has a population of 4,219,244 people according to 2006 census figures (NPC, 2007), 413,159 of which are made up of farm families (BNARDA, 1998).
Benue State is divided into three geopolitical zones sometimes referred to as agricultural zones namely; Zone A, Zone B and Zone C. Kwande Local Government Area is located in Zone A while Guma Local Government Area and Agatu Local Government Area are located in Zone B and Zone C respectively. Farming is the major occupation of the indigenes of the State and Kwande (Zone A), Guma (Zone B) and Agatu (Zone C) are the Local Government Areas with the highest intensification in rice production in the State. The map of Benue State showing the Local Governments is shown in Figure 1.
2.2. Population and Sampling Procedure
The population of this study is the rice farmers in Benue State. This population is made up of rice farmers in the three geopolitical Zones namely Zones A, B and C. A multi-stage sampling procedure was adopted for this study. The first stage was the purposive selection of one Local Government Area each from the three geopolitical Zones of Benue State based on rice intensification. The second stage was the purposive selection of two markets in each of the three Local Government Areas earlier selected based on rice intensification. The third stage was the random selection of respondents from the rice farmers in the markets earlier selected. A total of 240 questionnaires were administered proportionately in the study area.
2.3. Data Collection Techniques
Data were obtained from primary source with the aid of structured questionnaire and personal interviews. The total number of questionnaires administered in this study was two hundred and forty (240). However, two hundred and thirteen (213) respondents returned their questionnaires.. This puts the total valid questionnaires returned in this study at one hundred and ninety seven (197).
2.4. Data Analysis Techniques
To achieve the stated objectives of the study, the data generated were analyzed using descriptive statistics such as tables, frequency distribution, and percentages. Descriptive statistics was used to achieve objective (i) while objective (ii) was achieved by computing the Gini Coefficient and Lorenz curve for the market structure and drawing inference from the result. The following formulae were used;
a) Gini Coefficient (G) is expressed as follows:

Where,
G = Gini-Coefficient,
Xi = Percentage of rice sellers in the ith class of traders,
Yi = Cumulative percentage of rice sellers in the ith class of traders.
K = Number of classes
The Gini Coefficient varies from 0 to 1, where 0 implies perfect equality in the distribution. The closer the Gini Coefficient is to zero, the greater the degree of equality, the lower the level of concentration and the more competitive are the markets. Similarly, the closer the Gini Coefficient to one, the greater the degree of inequality, the higher the concentration and the more imperfect are the markets.
b) Lorenz Curve is expressed as follows:
![]() (Ranges between 0 and 1)
(Ranges between 0 and 1)
Where,
k = 1, n is the position of each individual in the income distribution
i = 1, .k is the position of each individual in the income distribution.
P = total number of individuals in the population
Ai = is the income of the ith individual in the distribution
![]() = the cumulated income up to the kth individual. It ranges between 0, for k=0, and A for k=n.
= the cumulated income up to the kth individual. It ranges between 0, for k=0, and A for k=n.
The Lorenz Curve is a graphical representation of income distribution. It tells which proportion of total income is in the hands of a given percentage population by relating the cumulative proportion of income to the cumulative proportion of individuals. The x-axis records the cumulative proportion of population ranked by income level. It range is (0, 1). The y-axis records the cumulative proportion of income for a given proportion of population ie the income share calculated by taking the cumulated income of a given share of population divided by the total income A.
3. Results and Discussion
3.1. Structure of the Paddy Rice Market in Benue State
The Gini-Coefficient computation for rice farmers in Zone A, Zone B, and Zone C were 0.5338, 0.4639, and 0.4639 respectively (Tables 1, 2 and 3). The values of Gini-Coefficient greater than 0.35 are high (Dillon and Hardakar, 1993; Bakare, 2012), indicating that there is inequitable distribution of sales income. Furthermore, careful observation of the Lorenz Curves for the Zones (Figures 2, 3 and 4) show that the Lorenz Curve for Zone A is more convex than the Lorenz Curves for both Zone B and Zone C indicating that there is higher inequality in sales income distribution of rice farmers and consequently, higher market concentration in Zone A. This agrees with Lorenzo (2005), who stated that more inequality in income distribution implies more convex Lorenz Curves. The observed inequality in earning is a partial reflection of differences in the risk of investment of rice farmers (Iheanacho, 2005) and is a reflection of inefficiency in the market structure for paddy rice in the study area. The result is corroborated with the findings of Afolabi (2009) and Dia et al. (2013).
Furthermore, the respondents’ opinion on the number of sellers, number of buyers, membership of marketing association, freedom of entry and exit, flow of information, price fixing behaviours and sourcing of marketing information were analysed. The distribution of paddy rice marketing by structure is shown in Table 4. The analysis of number of sellers and buyers in the paddy rice market showed that there are many sellers and few buyers. This result implies that there is high negotiating power on the buyer side which can be used to depress prices of paddy rice in the market (Bain, 1968; Raible, 2013). Majority (over 50%) of the rice farmers in the study area earn small sales income/annum of 200,000 Naira and below.
Table 1. Gini Coefficient for Paddy Rice Sales Income by Farmers in Zone A, Benue State [n=61].
| Range of income (sales) | No of sellers (frequency) | Proportion of sellers (X) | Cumulative proportion | Cumulative frequency | Total sales ( N) | Proportion of sales | Cumulative proportion (Y) | XY |
| ≤100,000 | 26 | 0.43 | 0.43 | 26 | 1,642,500 | 0.15 | 0.15 | 0.0645 |
| 100,001-200,000 | 23 | 0.38 | 0.81 | 49 | 4,500,000 | 0.42 | 0.57 | 0.2166 |
| 200,001-300,000 | 2 | 0.03 | 0.84 | 51 | 576,000 | 0.05 | 0.62 | 0.0186 |
| 300,001-400,000 | 9 | 0.15 | 0.99 | 60 | 3,600,000 | 0.33 | 0.95 | 0.1425 |
| ≥400,001 | 1 | 0.02 | 1.00 | 61 | 500,000 | 0.05 | 1.00 | 0.0200 |
| Total | 61 | 1.00 | 10,818,500 | 1.00 | 0.4622 |
Note: Mean value of sales = N 177, 352.46, Gini Coefficient = 1-XY = 1-0.4622 = 0.5338.
i.e. 0.5338 > 0.3 which indicates inequality distribution (concentration) of rice farmers in Zone A, Benue State
Source: Field Data, 2014.
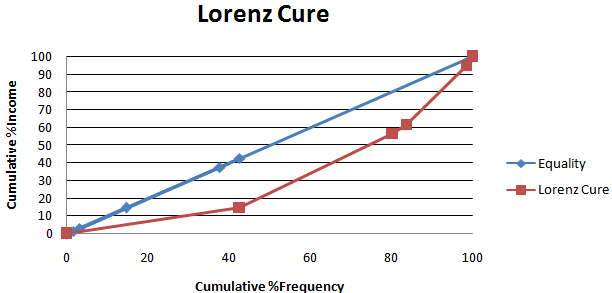
Figure 2. Lorenz Curve Showing Sales Income Distribution of Rice Farmers in Zone A.
Source: Field Data, 2014.
Table 2. Gini Coefficient for Paddy Rice Sales Income by Farmers in Zone B, Benue State [n=64].
| Range of income (sales) | No of sellers (frequency) | Proportion of sellers (X) | Cumulative proportion | Cumulative frequency | Total sales ( N) | Proportion of sales | Cumulative proportion (Y) | XY |
| ≤100,000 | 12 | 0.19 | 0.19 | 12 | 1,192,000 | 0.08 | 0.08 | 0.0152 |
| 100,001-200,000 | 12 | 0.19 | 0.38 | 24 | 2,400,000 | 0.15 | 0.23 | 0.0437 |
| 200,001-300,000 | 27 | 0.42 | 0.80 | 51 | 6,730,000 | 0.43 | 0.66 | 0.2772 |
| 300,001-400,000 | 13 | 0.20 | 1.00 | 64 | 5,200,000 | 0.34 | 1.00 | 0.2000 |
| ≥400,001 | 0 | 0.00 | 1.00 | 64 | 0 | 0 | 1.00 | 0.0000 |
| Total | 64 | 1.00 | 15,522,000 | 1.00 | 0.5361 |
Note: Mean value of sales = N 242, 531.25, Gini Coefficient = 1-XY = 1-0.5361 = 0.4639.
i.e. 0.4639 > 0.3 which indicates inequality distribution (concentration) of rice farmers in Zone B, Benue State
Source: Field Data, 2014.
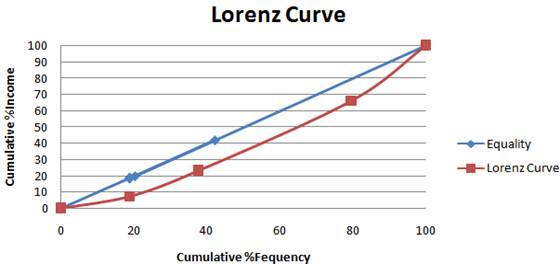
Figure 3. Lorenz Curve Showing Sales Income Distribution of Rice Farmers in Zone B.
Source: Field Data, 2014.
Table 3. Gini Coefficient for Paddy Rice Sales Income by Farmers in Zone C, Benue State [n=72].
| Range of income (sales) | No of sellers (frequency) | Proportion of sellers (X) | Cumulative proportion | Cumulative frequency | Total sales ( N) | Proportion of sales | Cumulative proportion (Y) | XY |
| ≤100,000 | 19 | 0.26 | 0.26 | 19 | 1,600,000 | 0.11 | 0.11 | 0.0286 |
| 100,001-200,000 | 37 | 0.51 | 0.77 | 56 | 7,400,000 | 0.49 | 0.60 | 0.3060 |
| 200,001-300,000 | 4 | 0.06 | 0.83 | 60 | 1,152,000 | 0.08 | 0.68 | 0.0408 |
| 300,001-400,000 | 11 | 0.15 | 0.98 | 71 | 4,400,000 | 0.29 | 0.97 | 0.1455 |
| ≥400,001 | 1 | 0.01 | 1.00 | 72 | 625,000 | 0.04 | 1.00 | 0.0100 |
| Total | 72 | 1.00 | 15,177,000 | 1.00 | 0.6209 |
Note: mean value of sales = N 210, 791.67 Gini Coefficient = 1-XY = 1-0.3791 = 0.4639
i.e. 0.3791 > 0.3 which indicates inequality distribution (concentration) of rice farmers in Zone C, Benue State
Source: Field Data, 2014.
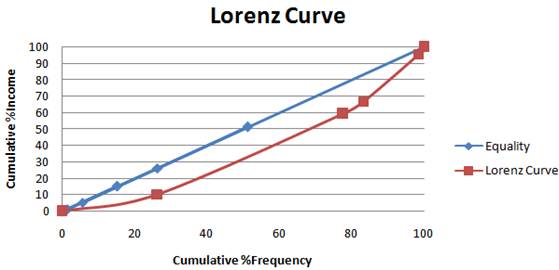
Figure 4. Lorenz Curve Showing Sales Income Distribution of Rice Farmers in Zone C.
Source: Field Data, 2014.
The percentage distributions of respondents by membership of marketing association showed that majority (69.04%) of respondents were members of marketing association or union. Those who subscribed to membership of marketing association did so to enhance access to extension services, and credit facilities. This implies that rice farmers subscribe to membership of market association for benefit. This result is corroborated by Basorun and Olakulehin (2007) and Asogwa and Okwoche (2012).
The distribution of respondents by ease of entry and exit in the study area showed that majority (92.39%) of respondents agree that there was freedom to buy and sell paddy rice in the market. This indicates that the market is structured to allow freedom of entry and exit of paddy rice sellers and buyers. Since the level of ease of market entrance is connected to the level of concentration (Tung and Wang, 2010), the result is an indication that the market for paddy rice in the study area is not concentrated and there is no joint profit maximization among sellers. This finding is in consonance with earlier finding by Asogwa and Okwoche (2012) that there is ease of entry and exit as well as freedom for buying and selling of sorghum in Benue State.
The percentage distribution of respondents by flow of market information showed that majority (89.85%) indicated that there is no free flow of marketing information in the paddy rice market. The result indicates that there is no free flow of marketing information in the study area. Most available information is provided by the middlemen who choose the information to provide to the sellers. Information relating to pricing and unit of measure are kept from the sellers. This implies that the paddy rice market is not perfect (Olukosi and Isitor, 1990). The study contradicts earlier study by Asogwa and Okwoche (2012) who stated that there is free flow of marketing information in the sorghum market in Benue State.
Majority (71.57%) of respondents in the study area indicated that price fixing for paddy rice was based on the current price as provided by the middlemen who have information on the current pricing of paddy rice in the market and other neighbouring markets, and act on behalf of the buyers. This shows that there is high influence of buyers over sellers with regard to pricing and is indicative of oligopsony market structure. Finally, the majority (94.42%) of respondents obtained marketing information from middlemen. This implies that the middlemen have high influence regarding pricing and other marketing decisions in the paddy rice market.
Table 4. Distribution of Paddy Rice Marketing by Structure in Benue State (n = 197).
| Variable | Zone A | Zone B | Zone C | Pool Data | ||||
| Freq | % | Freq | % | Freq | % | Freq | % | |
| Number of sellers | ||||||||
| ≤ 100 | 0 | 0 | 0 | 0 | 0 | 0 | 0 | 0 |
| 101 – 200 | 21 | 34.43 | 19 | 29.69 | 31 | 43.06 | 71 | 36.04 |
| >200 | 40 | 65.57 | 45 | 70.31 | 41 | 56.94 | 126 | 63.96 |
| Total | 61 | 100 | 64 | 100 | 72 | 100 | 197 | 100 |
| Number of buyers | ||||||||
| ≤10 | 58 | 95.08 | 61 | 95.31 | 67 | 93.06 | 186 | 94.42 |
| 11 – 20 | 1 | 1.64 | 2 | 3.13 | 3 | 4.17 | 6 | 3.05 |
| >20 | 2 | 3.28 | 1 | 1.56 | 2 | 2.78 | 5 | 2.54 |
| Total | 61 | 100 | 64 | 100 | 72 | 100 | 197 | 100 |
| Membership of marketing association | ||||||||
| Member of marketing association | 42 | 68.85 | 44 | 68.75 | 50 | 69.44 | 136 | 69.04 |
| Not a member of marketing association | 19 | 31.15 | 20 | 31.25 | 22 | 30.56 | 61 | 30.96 |
| Total | 61 | 100 | 64 | 100 | 72 | 100 | 197 | 100 |
| Freedom of entry and exit | ||||||||
| Freedom of entry and exit exist | 52 | 85.25 | 60 | 93.75 | 70 | 97.22 | 182 | 92.39 |
| There is no freedom of entry and exit | 9 | 14.75 | 4 | 6.25 | 2 | 2.78 | 15 | 7.61 |
| Total | 61 | 100 | 64 | 100 | 72 | 100 | 197 | 100 |
| Free flow of information | ||||||||
| There is free flow of information | 7 | 11.48 | 6 | 9.38 | 7 | 9.72 | 20 | 10.15 |
| No free flow of information | 54 | 88.52 | 58 | 90.63 | 65 | 90.28 | 177 | 89.85 |
| Total | 61 | 100 | 64 | 100 | 72 | 100 | 197 | 100 |
| Price fixing behaviours | ||||||||
| Bargaining | 2 | 3.28 | 6 | 9.375 | 6 | 8.33 | 14 | 7.11 |
| Quantity traded | 16 | 26.23 | 12 | 18.75 | 9 | 12.5 | 37 | 18.78 |
| Current price | 43 | 70.49 | 45 | 70.31 | 53 | 73.61 | 141 | 71.57 |
| Group decision | 0 | 0 | 1 | 1.56 | 4 | 5.56 | 5 | 2.54 |
| Total | 61 | 100 | 64 | 100 | 72 | 100 | 197 | 100 |
| Sourcing of marketing information | ||||||||
| Middlemen | 58 | 95.08 | 61 | 95.31 | 67 | 93.06 | 186 | 94.42 |
| Market union/association | 1 | 1.64 | 2 | 3.13 | 3 | 4.17 | 6 | 3.05 |
| Media eg radio, internet, town criers | 2 | 3.28 | 1 | 1.56 | 2 | 2.78 | 5 | 2.54 |
| Total | 61 | 100 | 64 | 100 | 72 | 100 | 197 | 100 |
Source: Field Survey, 2014.
3.2. Market Conduct for Paddy Rice in Benue State
The distribution of respondents by conduct of rice farmers is shown in Table 5. The responses show that the market structure drives the conduct of respondents. Majority of the respondents (74.11%) sell their paddy rice as soon as they harvest. Paddy rice is sold at higher price after the harvesting season since there is less paddy rice in the market. Most farmers sell their paddy rice during the harvesting season to meet pressing domestic needs. This is because most of them are small holder farmers with little financial capacity.
The distribution of respondents by source of business finance showed that most (76.65%) depend on personal or family funding for their business. This is because the farmers lack the capacity to meet the lending requirements of deposit banks. In addition, cooperatives or market associations are only able to provide minimal financing considering the number of applicants and the small amount of money available.
Majority of the respondents (92.89%) indicated that there is no collusion among farmers on pricing and unit of measures for paddy rice in the study area. This shows that marketing of paddy rice in the study area was mostly devoid of collusion. This is because collusion under oligopsony by sellers is ineffective. In addition, there is lack of adequate market information to enable sellers make meaningful market decisions.
The percentage distributions of respondents by advertising showed that majority (96.95%) of the respondents in the study area did not advertise their paddy rice to prospective buyers. This is because the market is structured in such a way that sellers can take their paddy rice to particular stalls or position in the market where the middlemen either buy and sell or buy for some big buyer. In addition, there is adequate demand for the paddy rice being produced in the study area.
The percentage distribution of respondents by sale of improved variety of paddy rice showed that majority (96.95%) of respondents sell improved variety of paddy rice. This indicates that there was existence of innovation in the paddy rice market in the study area.
Majority of the respondents (63.96%) in the study area have attended training on rice cultivation or paddy rice marketing. This indicates that there is research and development practice in the paddy rice market in Benue State. However, this training was provided free of charge to rice farmers by government extension services and other interests including USAID, and OLAM, implying that the farmers themselves were yet to take personal initiative to self-development and research. This is because the market is not structured to encourage research and development. This finding is in agreement with Enibe et al. (2008); Dia et al. (2013); and Olagunju et al. (2012).
Table 5. Distribution of Respondents by Conduct of Paddy Rice Farmers in Benue State (n = 197).
| Variable | Zone A | Zone B | Zone C | Pool Data | ||||
| Freq | % | Freq | % | Freq | % | Freq | % | |
| Practice storage after harvesting | ||||||||
| Practice storage | 17 | 27.87 | 14 | 21.88 | 20 | 27.78 | 51 | 25.89 |
| Do not practice storage | 44 | 72.13 | 50 | 78.13 | 52 | 72.22 | 146 | 74.11 |
| Total | 61 | 100 | 64 | 100 | 72 | 100 | 197 | 100 |
| Rely on loans for business | ||||||||
| Rely of loans | 11 | 18.03 | 12 | 18.75 | 23 | 31.94 | 46 | 23.35 |
| Do not rely on loans | 50 | 81.97 | 52 | 81.25 | 49 | 68.06 | 151 | 76.65 |
| Total | 61 | 100 | 64 | 100 | 72 | 100 | 197 | 100 |
| Collusion among rice farmers | ||||||||
| Collusion exists | 2 | 3.28 | 6 | 9.38 | 6 | 8.33 | 14 | 7.11 |
| Collusion does not exist | 59 | 96.72 | 58 | 90.63 | 66 | 91.67 | 183 | 92.89 |
| Total | 61 | 100 | 64 | 100 | 72 | 100 | 197 | 100 |
| Advertising | ||||||||
| Advertising exists | 2 | 3.28 | 1 | 1.56 | 3 | 4.17 | 6 | 3.05 |
| Advertising does not exist | 59 | 96.72 | 63 | 98.44 | 69 | 95.83 | 191 | 96.95 |
| Total | 61 | 100 | 64 | 100 | 72 | 100 | 197 | 100 |
| Sale of improved rice variety | ||||||||
| Sale of improved variety exists | 56 | 91.80 | 63 | 98.44 | 72 | 100.00 | 191 | 96.95 |
| No sale of improved variety | 5 | 8.20 | 1 | 1.56 | 0 | 0.00 | 6 | 3.05 |
| Total | 61 | 100 | 64 | 100 | 72 | 100 | 197 | 100 |
| Attended training | ||||||||
| Attended training | 40 | 65.57 | 45 | 70.31 | 41 | 56.94 | 126 | 63.96 |
| Did not attend training | 21 | 34.43 | 19 | 29.69 | 31 | 43.06 | 71 | 36.04 |
| Total | 61 | 100 | 64 | 100 | 72 | 100 | 197 | 100 |
Source: Field Survey, 2014.
4. Conclusion and Recommendation
The study concludes that there is inequality in the market power concentration. The market structure for paddy rice in the study area is oligopsony. There are no collusive price fixing behaviours among sellers in the paddy rice market. The study makes the following recommendations based on the findings:
Government should take steps to reduce the market power concentration in the hands of few buyers, through policies that encourage competition and improve welfare.
References
- Abu, G. A., Odoemenem, I. U. and Ocholi, A. (2001). Determining Optimum Farm Credit Need of Small Scale Farmers in Benue State. Journal of Economics and International Finance. 3 (10): 564-570.
- Adegboye, R. O. (2004). Land, Agriculture and Food Security in Nigeria, 3rd Faculty Lecture, Faculty of Agriculture, University of Ilorin, 25/02/2004.
- Adejumo-Ayibiowu, D. (2010). Mapping of Poverty Reduction Strategies Papers (PRSP): Sector Strategies and Policies related to Rice Development in Nigeria. Coalition for African Rice Development (CARD) Report. November, 2010. 74pp.
- Afolabi, J. A. (2009). An Assessment of Gari Marketing in South-Western Nigeria. Journal of Social Sciences. 21(1): 33-38.
- Aigbokhan B. E. (2001). Resuscitating Agricultural Production for Export. Proceedings of the 10th Annual Conference of the Central Bank of Nigeria’s Zonal Research Units of the Central Bank of Nigeria (CBN), 4 -8, June, 2001. Pp. 34-43. Accessed on 07/06/2013 from http://www.cenbank.org/out/publications/occasionalpapers/rd/2001we-01-6pdf.
- Akpokodje, G., Lancon, F. and Erenstein, O. (2001). Nigeria’s Rice Economy: State of the Art. Paper presented at the Nigerian Institute for Social and economic Research (NISER)/West African Rice Development Association (WARDA), Nigeria Rice Economy Stakeholders Workshop, Ibadan, 8-9 November 2001. Bouake: WARDA. 55pp.
- Aminu, U. and Anono, A. Z. (2012). An Empirical Analysis of the Contribution of Agriculture and Petroleum Sector to the Growth and Development of the Nigerian Economy from 1960 – 2010. International Journal of Social Science and Education. 2(4): 758-769
- Asogwa, B. C. and Okwoche, V. A. (2012). Marketing of Agricultural Produce among Rural Farm Households in Nigeria: The case of Sorghum Marketing in Benue State. International Journal of Business and Social Science. 3(13): 269-277
- Bain, J. S. (1951). Relation of Profit Rate to Concentration: American Manufacturing, 1936 – 1940. Quarterly Journal of Economics. 65(1): 293 – 324.
- Bain, J. S. (1968). Industrial Organisation. 2nd edition. New York, John Wiley and Sons, Inc.
- Bakare, A. S. (2012). Measuring the Income Inequality in Nigeria: The Lorenz Curve and Gini Coefficient Approach. American Journal of Economics. 2(1): 47-52
- Bamidele, F. S., Abayomi, O. O. and Esther, O. A. (2010). Economic Analysis of Rice Comsumption Patterns in Nigeria. Journal of Agricultural Science and Technology. 12(1): 1-11.
- Basorun, Y. O. and Olakulehin, J. O. (2007). The Lagos State Fish Farmers Association. Leisa 23(1), 10-11.
- Benkad (1998). Diagnostic Survey of Roots and Tubers in Benue State. Consultancy Report by Benkad Consultants. Makurdi, Nigeria. Benue Agricultural and Rural Development Authority.
- Benue Agricultural and Rural Development Authority (BENARDA), (1998). Crops Area and Yield Survey Report: BENARDA
- Central Bank of Nigerian (CBN), (2007). Annual Report and Statement of Accounts for the Year Ended 31st December, 2007.
- Dessalegn, G., Jayne, T. S. and Shaffer, J. D. (1998). Market Structure, Conduct, and Performance: Constraints on Performance of Ethiopian Grain Markets. Grain Market Research Project, Ministry of Economic Development and Cooperation, Addis Ababa. Working Paper 8
- Dia, Y. Z., Mshelia, S. I., Zalkuwi, J. and Gwandi, O. (2013). A Structural Analysis of Honey Trade Flow into Ganye and Toungo Local Government Areas of Adamawa State, Nigeria. Greener Journal of Business and Management Studies. 3(4): 174-179.
- Dillon, J. L. and Hardakar, J. B. (1993). Farm management research for small farmer development. In: FAO Farm management Series. Rome: FAO. p.313
- Enibe, D. O., Chidebelu, S. A. N. D., Onwubuya, E. A., Agbo, C. and Mbah, A. A. (2008). Policy Issues in Structure, Conduct and Performance of Banana Market in Anambra State, Nigeria. Journal of Agriculture. 12(2): 32-40
- Food and Agricultural Organisation of the United Nations (FAO), (2013). Monitoring African and Agricultural Policies: Analysis of Incentives and Disincentives for Rice in Nigeria. Accessed on 05/10/2014 from
- http://www.fao.org/fileadmin/templates/mafap/documents/technical_notes/NIGERIA/NIGERIA_Technical_Note_RICE_EN_Jul2013.pdf
- Hill, L. D. (1997). Agricultural Commodities. In Cramer, G. L., Jensen, C. W. and Southgate, D. D. Jr. (eds). Agricultural Economics and Agribusiness. 7th edition, John Wiley and Sons Inc. pp. 314-341.
- Iheanacho, A. C. (2005). Structural Characteristics and Performance of Retail Marketing of Eggs in Maiduguri Metropolis of Borno State, Nigeria. Journal of Sustainable Development of Agricultural Environment, 1(1): 70-76.
- International Fund for Agricultural Development (IFDC), (2008). Study of the Rice Value Chains in the Niger Basins of Mali, Niger, and Nigeria, West Africa. Accessed on 04/07/2012 from http://www.common-fund.org/uploads/tx_cfc/CFC_W_Africa_Domestic_Rice_Value_Chains.pdf
- Lorenzo, G. B. (2005). Charting Income Inequality: the Lorenz Curve. Accessed on 12/07/2014 from http://www.fao.org/docs/up/easypol/302/charting_income_inequality_000en.pdf
- National Population Commission (NPC), (2007). The 2006 Population Census Official Gazette (extraordinary). Volume 94, Number 24, May 15, Lagos.
- Olagunju, F., Babatunde, R. and Salimonu, K. (2012). Market Structure, Conduct and Performance of Gari Processing Industry in South Western Nigeria. European Journal of Business and Management. 4(2): 99-112.
- Olukosi, J. O. and Isitor, S. V. (1990). Introduction to Agricultural Market and Price: Principles and Applications. Abuja, Living Book Series Publications. 116pp.
- Onlinenigeria (2003). Benue State: Physical Setting and Population. Accessed on 08/02/2013 from http://www.onlinenigeria.com/links/benueadv.asp?blurb=212
- Onu, J. I. and Okunmadewa, F. Y. (2001). Efficieny in Cotton Marketing in Northern Nigeria, International Journal of Economic Development. 1(1): 234-240.
- Oyinbo, O., Omolehin, R. A. and Abdulsalam, Z. (2013). Household Consumption Preference for Imported and Domestic Rice in Kaduna State, Nigeria: Implication for Rice Quality Improvement. Production Agriculture and Technology Journal. 9(1): 29-37
- Raible, M. (2013). Industrial Organisation Theory and its Contribution to Decision-making in Purchasing. 2nd IBA Bachelor Thesis Conference, November 7th, 2013, Enschede, The Netherlands.
- Tung, G. S., Lin, C. Y. and Wang, C. Y. (2010). The Market Structure, Conduct and Performance Paradigm Re-applied to the International Tourist Hotel Industry. African Journal of Business Management. 4(6): 1116-1125.


