
American Journal of Marketing Research, Vol. 1, No. 2, August 2015 Publish Date: Jul. 20, 2015 Pages: 66-69
Domestic Price Formation of Sorghum Under Export Policies in Sudan
Mahmoud A. Amassaib1, Salah M. Elawad2, Ahmed M. El Naim3, *, Elrashied E. Elkhiedi2
1Department of Agricultural Economics and Rural Development, Faculty of Natural Resource and Environmental Studies, University of Kordofan, Elobeid, Sudan
2Department of Agricultural Economics, Faculty of Agriculture, University of Khartoum, Khartoum, Sudan
3Department of Crops Sciences, Faculty of Natural Resources and Environmental Studies, University of Kordofan, Elobeid, Sudan
Abstract
This paper was prepared to investigate the integration between the domestic and world prices of sorghum and measure the rate of transmission from world price to domestic price of sorghum. The study utilized secondary data covering the period 1970-2007.The data analyzed using dynamic linear regression model. The most important results revealed from the study were that the sorghum domestic price was inelastic in respond to both sorghum production cost and adjusted world prices in short run (0.2668 and 0.39543) and in long run (0.3982 and 0.5901). The effects of adjusted world price implied that devaluation and decrease of tariff rate would lead to increase of sorghum domestic price.
Keywords
World Price, Export Pan, Intervention, Sudan
Received: June 9, 2015
Accepted: June 25, 2015
Published online: July 16, 2015
@ 2015 The Authors. Published by American Institute of Science. This Open Access article is under the CC BY-NC license. http://creativecommons.org/licenses/by-nc/4.0/
1. Introduction
Different literature highlighted on transmission of global prices into domestic prices [1], [2]. The world prices seta growing pressure on domestic prices as they are increasing, even though descending movements are less effectively transmitted and habitually do not have any such impact. As Wood et al.[3] said some researcher commented that lower food prices to be advantageous to the poor [4] and higher food prices to be generally harmful to consumers in developing countries [5], [6].
Intervention in prices of sorghum in Sudan has involved many policy instruments, including export quotas and price support. Export quotas have been a key feature of controlled prices of sorghum for previous decades. They had been implemented as means of stabilizing and increasing of sorghum producers’ prices and hence raising producers’ income. Price support programs presented as government purchase of sorghum buffer stock through the Strategic Reserve Authority (SRA) with the main functions of market stabilization, mainly for staple cereals, through imports and local purchases, and the free and/or subsidized distribution of food to vulnerable groups, and through Agricultural Bank of Sudan. Others tools of macroeconomic policies that affected sorghum prices such as devaluation of local currency, taxes reform … etc were used. Marketing and stock policies in general continued within the same line of market liberalization adopted previously. Similarly, with the view that privatization improves market efficiency, Sudan granted the private sector a bigger role in the marketing and trading of sorghum. The sorghum prices react to macroeconomic shocks and to sector-specific shocks. Under such circumstance producers of sorghum in mechanized rainfed subsector would be in conditions of risk and uncertainty about price stability and volatility. Price instability remain a major concern for decision makers because the importance of sorghum in Sudan’s food security as a main staple food crop. For a few decades, dramatic changes in sorghum prices in domestic markets with increase in costs of production and deterioration in sorghum yield and in rain fall had put producers of sorghum in critical situation because of price instability. Moreover, sorghum producers have not always been totally protected from the consequences of price volatility and had limited ability to deal it.In many seasons the government interferes to determine floor prices for the benefit of producers and to stabilize price fluctuations prices, but there were hardly sorghum administered prices. The behaviour of sorghum price showed instability through different periods, the coefficient of variations of different markets and for averages levels were high. The volatility of nominal prices for total period (1970-2007) was more than 170% respectively in different markets (Table 1).
Table 1. The Coefficient of Variation of nominal sorghum prices 1970-2007 in selected markets.
| ItemsPeriod | Gadarif | Kosti | Wad Madni | El Obeid | Average |
| 1970-1978 | 41.2 | 39.1 | 39.0 | 26.6 | 31.4 |
| 1978-1985 | 149.7 | 143.8 | 146.8 | 126.7 | 140.8 |
| 1985-1992 | 141.6 | 138.7 | 127.4 | 136.5 | 135.4 |
| 1992-2002 | 80.1 | 82.4 | 78.8 | 87.6 | 81.5 |
| 2002-2007 | 39.6 | 36.3 | 39.2 | 31.1 | 35.2 |
| 1970-2007 | 175.2 | 174.3 | 177.3 | 172.2 | 173.5 |
Source: Ministry of Agriculture & Forests (2008) & Central Bureau of Statistics (2008) http://www.cbs.gov.sd.
The fluctuations were most likely influenced by the controls on exports (and imports). Converse relationship between domestic price and export comes from the purpose of the export policies. The decision of export is made for controlling the level of domestic price. If the domestic price is high then the policy makers put constrains on sorghum export. When domestic price is low the policy makers use export bans to increase price of sorghum. The export restrictions are often decided after planting, leading to a classical cobweb cycle effect, with production increasing as prices decline and vice versa.
The objective of this paper is to investigate the integration between the domestic and world prices of sorghum and measure the rate of transmission from world price to domestic price of sorghum.
2. Models and Procedures
Culff [7] gave model for price formation, which is adopted by Meyer [8]. The model implies the following equation:
Ptd = α + βPtw. rt .(1- d) + εt
Where Ptd and Ptw domestic and world prices at time t; β imperfect transmission between domestic and world prices; rt exchange rate; d represent tariff; and α and εt capture the divergence of world and domestic prices that does not depend on price level. Depending on equation above the price transmission elasticity of export can be calculated as follows:
η = (∂ Ptd ÷∂ Ptw)*(Ptw ÷ Ptd) = β (1+ d)*( [Ptw .r] ÷ Ptd)
It is interesting to note that a long time series gives no guarantee of precise estimates because the longer data are susceptible to incorporate different policy regimes [7]. So, the domestic price model for sorghum is set as follow
Pdt = β0 + β1Pdt-1 +β2Pwadj+ β3PCt +et
Pwadj=Ptw. rt .(1- d)
Two models were used to estimate the above functions which are:
1. The model which known as dynamic linear regression (DLR). The simplest Autoregressive Distributed Lag (ARDL) (1, 1) model is:
yt=α0+α1yt-1 +β0 xt+β1xt-1+ εt
Where it is assume that εt~ iid (0, σ2) and ׀α1 ׀<1[9]
2. The model which known as Error Correction model (ECM) that implied ARDL (1,1). The model can be written as
ΔYt= α0 - α1(Yt-1 – βiZt-1) + β0ΔZt + Dt + et
Where Z is a vector of regressors and βi reflect the equilibrium effect of the individual Z regressors on Y. D is a dummy variable while αt is an estimated coefficient in the regression and Δ is the difference operator[10], [11].
Performance of the modelscould be measured by the validity of the estimation, ability of reproduce of the actual data in a dynamic simulation and stability. The estimating model in this study has been evaluated and validated on the basis of root mean square percentage error (RMSPE), and Theil’s inequality coefficient (U).Theil’s inequality coefficient is defined as follow [12]:
U= [1/n∑ (Pt-At)2/ (1/n∑A2+1/n∑P2)]1/2
Where Pt and Atrepresent predicted and actual values at the same time t respectively, while n is the number of observations. Theil’s coefficient lies in the interval between zero and one. In case of perfect prediction, Theil’s coefficient takes the value zero.The source of prediction errors could also be identified by taking into account the numerator of Theil’s inequality coefficient, Um, Us and Uc.
Um= (P-A)2/ [1/n∑ (Pt-At)2]
Us = (sd P-sd A)2/ [1/n∑ (Pt-At)2]
Uc= 2(1-r)sd P*sd A/ [1/n∑ (Pt-At)2]
Where: Um= the bias proportion it is an indication of systematic error, with a value close to zero is desirable.
Us = the variance proportion which measure the equality between the standard deviation of predicted (sd P) and actual (sdA) values. The value close to zero is desirable.
Uc= the covariance proportion measure the unsystematic error, with a value close to one is desirable.
P = the mean of predicted value.
A = the mean of actual value
r = the correlation coefficient between predicted and actual values.
Further, the models would be validated by RMSPE.
RMSPE=[1/n∑ {(Pt-At)/ At}2]½*100
3. Results and Discussion
According to Table 2, statistically all regressors have expected signs. The coefficient of the determination, R2 (0.923), together with F-ratio (132.77) indicate the goodness of fit of the equation. The diagnostic tests explain no error serial correlation (F ratio =2.461) and no heteroscedasticity (F ratio =0.857) but the normality of the residual is not satisfied (Jarque-Bera coefficient =8.627 (0.013)).
Table 2. Short and long run coefficients of domestic price model for sorghum production in mechanized rain-fed sub-sector (MRS).
| Coefficient | Variable | Definition | Estimate short run | Estimate long run |
| β0 | C | Intercept | 3.71445 | 5.5439 |
| β1 | Pdt-1 | Lagged domestic price | 0.3297*** (0.03316) | |
| β2 | Pwadj | Adjusted world price | 0.26680*** (0.04376) | 0.3982 |
| β3 | PCt | Sorghum production cost | 0.39543*** (0.033675) | 0.5901 |
Notes: all variables are in Ln form
R-Squared =0.923, Adj R-Squared = 0.921, F-Ratio = 132.77(0.000000)
Asterisk *** significant at 1 percent level
Asterisk ** significant at 5 percent level
Asterisk * significant at 10 percent level
Figures between parentheses are standard error value
Diagnostic test:
Error serial correlation F statistics =2.461(0.125)
Heteroscedasticity F statistics =0.857(0.360)
Error Probability, Jarque-Bera coefficient =8.627 (0.013)
Theil’s inequality coefficient (U) =0.030
Theil’s inequality coefficient (Um) =0.003
Theil’s inequality coefficient (Us) =0.020
Theil’s inequality coefficient (Uc) =1.00
The root mean square percentage error =0.1096
The performance of domestic price model estimated on the basis of RMSPE and the Theil’s coefficientsin Table2 with Figure 1 show the ability of the model to track the direction of the actual values of domestic price and explain the performance of the long domestic price response.
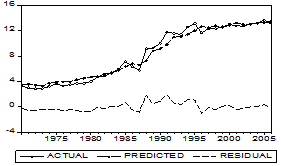
Fig. 1. Actual and predicted domestic price and the residuals of the model for sorghum production in MRS.
Table 2 shows that all variables (i.e. lagged domestic price, adjusted world price and sorghum production cost) selected in the model have strong effect on the dependent variable (domestic farmer price). Moreover, they have elasticities less than one in short and in long terms. Adjusted world price calculated as Culff [7] model. So, exchange rate and export tariff are included in the model of domestic price.
Error Correction Model in Table 3 has found to be statistically significance (at 0.05 level), indicating the existence of the long term causal relationship between the model’s variables. The negative sign of ERM coefficient implies slow down effect of error term, and its magnitude indicates small speed of adjustment of the dependent variable to error term. Also, the results proved the significance of sorghum production cost at 0.01level as adjusting factor for short term disequilibrium of the dependent variable.
Table 3. Error correction coefficients of domestic price model for sorghum production in mechanized rain-fed sub-sector.
| Coefficient | Variable | Definition | Estimate |
| B0 | C | Intercept | -0.1493 |
| B1 | Pwadj | Adjusted world price | -0.1292 (0.1348) |
| B2 | PCt | Sorghum production cost | 0.5911*** (0.1245) |
| B3 | ECM-1 | Error correction model | -0.1824** (0.08713) |
Notes: all variables are in differences form
R-Squared =0.299, Adj R-Squared = 0.281, F-Ratio = 4.545(0.009)
Asterisk *** significant at 1 percent level
Asterisk ** significant at 5 percent level
Asterisk * significant at 10 percent level
Figures between parentheses are standard error value
Pwadj-0ECM=Pdt-0.3982*.5901*PCt-5.5439
Sudan policy makers apply export pan to control sorghum domestic price levels under assumption of trade theories. That means the effects of world prices transmitted to sorghum domestic prices but the result of the study revealed that the world price have no such impact on domestic price i.e. the effect was inelastic. So, attaining stabilities in sorghum domestic levels and hence good performances in sorghum production under this trade policy would be limited. The effects of others tow policy instruments applied in Sudan (exchange rate and tariff) which captured by coefficient of adjusted world price. Elawad [9] cited that real exchange rate devaluation have had positive effect on agricultural supply, although the first round effects result in cost-push inflation. Policy makers deal with devaluation as incentive policy. But, according to results of this study the impact of devaluation policies in domestic prices was limited because of inelastic coefficient of world prices. Currency devaluation in Sudan has been implemented without given due to attention to incorporating such devaluation as a part and parcel of integrated policy package and frequent devaluation has had to a great extent minimized the impact of devaluation as a means of providing incentives to producers [9].Government interventions via tariff rate make a distortion in sorghum domestic price. This distortion appears in the instability of domestic price relative to which has prevailed under no intervention [13].As it was shown in the result of the study, the coefficient of adjusted world price explained that increasing tariff rate will decrease sorghum domestic price which mean non-incentive policy for sorghum production.
4. Conclusions
Although domestic and world prices of sorghum are positively integrated, yet the responsewas inelastic with rate of transmission less than one in short and in long terms. Hence,domestic trade policies of controlling domestic price through export ban would have poor effects on price efficiency and sorghum production performance in both short and long terms.Moreover, the effects of adjusted world price via devaluation and decrease of tariff rate would result in increasing sorghum domestic price in the long run. Devaluation polices could be applied after sorghum harvest in order to increase sorghum competitiveness and to avoid increase in the cost of sorghum production because of MRS has a high import content of input items. Moreover, the export pan policies of sorghum would be effective if it was stable, free from taxes and encourage promoting for sorghum exportation according to demand and supply forces.
References
- Headey, D. 2011. Was the global food crisis really a crisis? Simulations versus self-reporting", IFPRI Working Paper No 1087.
- Skoufias, E., Tiwari E and Zaman, H. 2011.Can we rely on cash transfers to protect dietary diversity during food crises? Estimates from Indonesia. World Bank Policy Research Working Paper No. 5548, World Bank, Washington DC.
- Wood, B., Nelson, C. and Nogueira, L. 2010. Measuring the Welfare Impact of Food Price Increases on Mexican Households (8/12/10 version for revision).
- Aksoy, A. and Isik-Dikmelik, A. 2008. Are low food prices pro-poor? Technical report, World Bank Development Research Group, Working Paper 4642.
- Ivanic, M. and Martin, W. 2008. Implications of higher global food prices for poverty in lowincome countries. Agricultural Economics, 39:405–416.
- DeHoyos, R. and Medvedev, D. 2009. Poverty effects of higher food prices: A global perspective. Technical report, World Bank policy research working paper.
- Culff, M. 2003. A Review of spatial price transmission in major world commodity models. Paper provide to Aglink Users Group, OECD.
- Meyer, F. H. 2007. Model closure and price formation under switching grain market regimes in South Africa. A Thesis submitted to Ph.D. Department of Agricultural Economics, Extension, and Rural Development. Faculty of Natural and agricultural Science. University of Pretoria.
- Elawad, S. M. 2001. Supply response of Sudan's cotton industry: Implications of government intervention. Unpublished Ph.D. thesis, University of Purtra, Malaysia.
- Mose, Lawrence O. 2007.Who gains, who loses? The impact of market liberalisation on rural households in Northwestern Kenya.PhD Thesis, Wageningen University. ISBN 90-8504-634-3.
- Keele, L. and De Boef, S. 2004. Not just for co-integration: Error correction models with stationary data.<http://www.nuff.ox.ac.uk/Politics/ papers
- Nithin, K. and Roy, R. 2014. Finance commission of India’s assessments: A Political economy contention between expectations and outcomes. National Institute of Public Finance and Policy New Delhi. Working Paper No. 2014-141.
- Valdes, A. 1993. The Macroeconomic environment necessary for agricultural trade and policy reform. Food Policy: 272-282.


