
American Journal of Marketing Research, Vol. 1, No. 3, October 2015 Publish Date: Aug. 3, 2015 Pages: 118-129
A Comparative Analysis of Hotel Ratings and Reviews: An Application in Singapore
Carol Anne Hargreaves*
Business Analytics, Institute of Systems Science, National University of Singapore, Singapore, Singapore
Abstract
A key to profitability in the hospitality industry is a clear understanding of what leads to satisfied loyal customers. A comparison of customer satisfaction based on Location, Sleep quality, Rooms, Service quality, Value for money and Cleanliness as perceived by travellers was done among five hotels. This main objective of this study is to compare the servicer quality of hotels understudy by drawing perceptual maps for five major hotels in the Singapore market. This study attempts to seek answers to the following questions: How customers rate the services offered by a hotel? Which factors should be considered for evaluating the experience of the customer? Do customers perceive any difference between services rendered by different hotels? This paper applies statistical techniques to compare how customers rate different hotels. Data from an online website, Trip Advisor, was used to analyse and compare customer ratings on five hotels. Based on principal component analysis (PCA) results, we plot perceptual maps to show and compare how the 5 hotels differ on the 6 attributes. Perceptual maps with a combination of up to two variables (attributes) were drawn to infer about the positioning of five different hotels. Two factors were confirmed as the key drivers of the landscape for the hotel industry, ‘Quality of Stay’ and ‘Accessibility and Environment’. Suggestions for management improvements were made based on the customer ratings and reviews. This study will help marketers of hotels and hotel managers to enhance the satisfaction levels of travellers and to better understand how the hotels differ and where improvements can be made.
Keywords
Perceptual Mapping, Hotel Ratings, Hotel Reviews, Service Quality, Hotel Industry, Customer Satisfaction, Customer Reviews, Singapore
Received: May 25, 2015
Accepted: June 6, 2015
Published online: August 2, 2015
@ 2015 The Authors. Published by American Institute of Science. This Open Access article is under the CC BY-NC license. http://creativecommons.org/licenses/by-nc/4.0/
Contents
1. Introduction 2. Literature Review 3. Research Objectives and Focus Issues 4. Data Source and Description 5. Review Analysis – Management Improvement Areas 5.1. Fullerton Hotel 5.2. Holiday Inn Hotel 5.3. IBIS Bencoolen Hotel 5.4. MBS Hotel 5.5. Raffles Hotel 6. Further Research 6.1. Improve Understanding of Customer Behavioral 6.2. Adopt Segment Strategies 7. Conclusion Recommendations
1. Introduction
When deciding to visit a country of interest, there are many hotels to choose from. The hotel industry in Singapore is an important part of the Hospitality and Tourism infrastructure and a strategic part of Singapore’s growth story. In line with many industries, the market environment is challenging and continues to evolve at an increasing pace. Increased disposable income is rising and consumers are searching for experiential leisure and therefore demand more quality and consistency in guest experience.
These trends have been accelerated through consumer technology changes affecting the industry value chain. Most notably, IT has enabled all aspects of the industry with particular success in the identification, recommendation, choice and booking of hotel accommodation using web and mobile based applications. In choosing hotels as a destination stay, the management needs to ensure that both the tangible and intangible aspects of the properties meet and preferably exceed expectations of their guests, whilst maintaining a profitable and productive business.
Hotels are primarily viewed as a service industry with intangible areas of guest experience and service levels expected to attract major focus however, there are also significant property developments and therefore, have many tangible aspects (location, amenities, fittings, etc).The reason for focusing on service quality is because it has been demonstrated that the more satisfied the guests are, the more likely they will return or prolong their hotel stay.
These studies applies multivariate statistical methods to compare and determine how 5 hotels differ or are similar, based on Location, Sleep Quality, Rooms, Service Quality, Value for Money and Cleanliness ratings assigned by customers who have stayed at these hotels. In this paper a comparative study has been done on 5 hotel’s data from an online website, Trip Advisor, and analyses are based on the above 6 attributes. A comparative study has also been done on the six major hotels using perceptual mapping. The objective of this study was to understand the satisfaction levels of the hotel customers. The study measured customer satisfaction on ratings on six attributes using a Likert type scale. Reviews were obtained from each of the 5 hotels to better understand what customers like and dislike about each hotel.
Section 2 outlines the Literature Review, Section3 outlines the research objectives and focus issues; followed by Section 4, covering the data source and description; Section 5 exhibits the empirical analysis and results; Finally, Section 5 summarises the main conclusions.
2. Literature Review
Many studies have looked into a comparison between business and leisure travellers in their hotel selection criteria. These studies indicated that the important attributes affecting business travellers’ hotel choices were cleanliness and location (Lewis & Chambers, 1989; McCleary et al., 1993; Taninecz, 1990) Perceptual mapping when used correctly perceptual mapping can identify opportunities, enhance creativity, and direct marketing strategy to the areas of investigation most likely to appeal to customers Hauser and Koppelman (1979). The statistical techniques select relative values for two, three, or four perceptual dimensions such that distance between products best corresponds to measured similarity. Green and Rao (1972) and Green and Wind (1973) provide mathematical details. Perceptual maps offer a unique ability to communicate market structure analysis, illustrating the complex relationships among marketplace competitors and the criteria used by buyers in making purchase decisions and recommendations.
Customer satisfaction is typically defined as a post consumption evaluative judgement concerning a specific product or service (Gundersen, Heide and Olsson, 1996). Applying to the hospitality industry, there have been numerous studies that examine attributes that travellers may find important regarding customer satisfaction. Atkinson (1988) found out that cleanliness, security, value for money and courtesy of staff determine customer satisfaction. Knutson (1988) revealed that room cleanliness and comfort, convenience of location, prompt service, safety and security, and friendliness of employees are important. Barsky and Labagh (1992) stated that employee attitude, location and rooms are likely to influence travellers' satisfaction. A study conducted by Akan (1995) showed that the main determinants of hotel guest satisfaction are the behaviour of employees, cleanliness and timeliness. Choi and Chu (2001) concluded that staff quality, room qualities and value are the top three hotel factors that determine travellers' satisfaction. Naomi Kasolowsky (2014) advocated that commitment to the customer should happen first every time in order to earn true loyalty. And further, that loyalty given purposefully, as a measurable cornerstone of your business, will yield far greater results than that which is doled out in meager, begrudging portions. Providing services those customers prefer is a starting point for providing customer satisfaction.
Service quality is a complex, elusive, subjective and abstract concept. It means different things to different people. The most common definition of service quality is the comparison customers make between their expectations and perceptions of the received service (Grönroos, 1982). It should be noted that service quality and customer satisfaction are distinct concepts, although they are closely related. According to some authors, satisfaction represents an antecedent of service quality (Carman, 1990; Bolton and Drew, 1991). In this sense, satisfactory experience may affect customer attitude and his or her assessment of perceived service quality. To sum up, the relationship between quality and satisfaction is complex. Some authors have described it as Siamese twins (Danaher and Mattsson, 1994; Jamali, 2007). Although there still remain a lot of unresolved questions, it can be concluded that service quality and customer satisfaction can be perceived as separate concepts that have causal ordering.
3. Research Objectives and Focus Issues
The main objective of this case study is to compare the customer satisfaction of the hotels understudy by drawing Perceptual Maps for the six major hotels.
This case attempts to seek answers to following questions:
• How do customers rate the services offered by a hotel?
• Which key attributes best describe each hotel?
• Do customers perceive any significant difference between services rendered by different hotels?
• Which hotels are able to deliver higher values for factors that customers consider as important for satisfaction?
• What is the competitive landscape of the 5 hotels?
4. Data Source and Description
The dataset contains 14 716 review records from September 2005 to September 2014 and has been sourced from the Trip Advisor online Review website [18]. Each of the review record provides a textual description of the reviewer’s comments on the hotel experience and overall ratings (1 to 5) for individual attributes such as location, sleep quality, rooms, service, value, cleanliness. Basic demographic information of the reviewer has also been collected.
The 5 hotels can position themselves in terms of:
1) Class/Quality - Fullerton, Raffles, and Marina Bay Sands are typically 5-Star hotels, while Holiday Inn and Ibis are 4-Star and 3-Star respectively;
2) Size/Number of Rooms - At the high end, the Marina Bay Sands can provide over 2500 rooms, whilst the Raffles Hotel is at the opposite scale with around 100 rooms. The other 3 hotels can be classed medium-size.
3) Pricing - Raffles Hotel positions itself at the high-end as a premium provider whilst the Ibis positions as the price leader with other hotels in between based on target market and room type.
4) Amenities for Target Segment – Business, Family, Resort etc
In addition to the data set being evaluated by machine analysis for the Trip Advisor website, further research was carried out into the attributes that are focused on and highlighted during a search and review.
It is expected that as a chosen trusted advisor site that these attributes would have already been picked as areas that typically are of interest when reviewing hotels
The basic information of 5 hotels in this study is shown in Table 1 below:
Table 1. Hotel Reviews.
| Hotel | No. of Customer Reviews |
| Fullerton | 1427 |
| Raffles | 1222 |
| Holiday Inn | 1346 |
| IBIS | 2710 |
| MBS | 7470 |
Simple visual displays and descriptive statistics such as the ‘mean was used to compare the ratings of the attributes for each hotel. The average rating for each attribute was compared by hotel and customer segment. The customer segments understudy were, the business, couple, family, friend and solo segments.
The hotel guests from the ‘as couple’ segment like to stay at Raffles while the Fullerton is popular with the ‘business traveller’. The IBIS is popular with the solo travellers and the family segment loves to stay at the Holiday Inn, followed by the Marina Bay Sands. The ‘with friends’ guests have no significant difference among the hotels, but the Marina Bay Sands and the IBIS are the first choice for this group of guests.
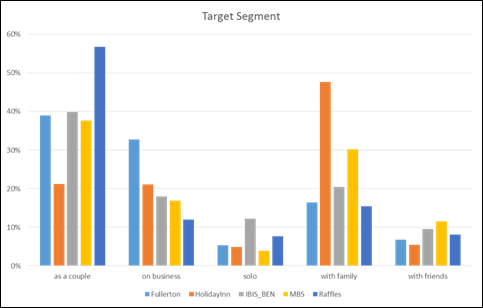
Figure 1. Comparison of guest segment attribute between 5 hotels.
1) Indian guests are notable for staying at the Holiday Inn (10%) than other hotels
2) Indonesia guests prefer to stay at Ibis hotel (9%) than other hotels
3) United Kingdom guests prefer to stay at Raffles (36%) than other hotels.
Table 2. Descriptive Statistics.
| Mean | Std. Deviation | Analysis N | |
| rt.loc | 4.44 | .790 | 9992 |
| rt.sq | 4.34 | .891 | 9992 |
| rt.rm | 4.23 | .909 | 9992 |
| rt.clean | 4.50 | .777 | 9992 |
The attribute, ‘Cleanliness’ had the highest rating, 4.50 while the attribute, ‘Room’ had the lowest rating, 4.23.
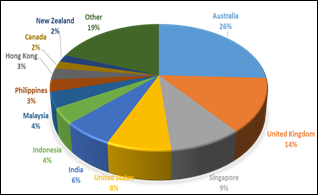
Figure 2. Distribution of hotel reviewers Originated Countries.
The general ratings on each of the attributes were good.
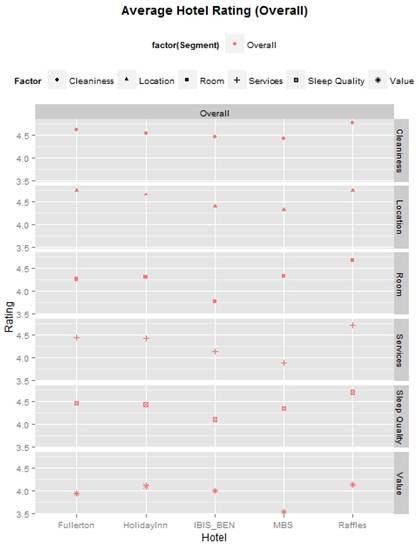
Figure 3. Average Hotel Rating by Attributes and Segments.
For the attribute, cleanliness, Raffles scored generally higher than the rest. Fullerton’s rating was comparable to Raffles.
For the attribute location, Marina Bay Sands (MBS) consistently had a lower rating and had a rating quite similar to IBIS Bencoolen. Fullerton and Raffles consistently had higher ratings.
For the ‘room’ attribute, the Fullerton, Holiday Inn and Marina Bay Sands are comparable in their rating, though Raffles consistently ranked the highest across all segments. The IBIS Bencoolen consistently ranked the lowest across all segments.
For the services attribute, Raffles ranked highest across all segments. Interestingly, the Marina Bay Snads ranked the lowest, worse off than the economy hotel (IBIS Bencoolen) and was not comparable with the rest of the hotels of similar class. This observation could also suggest that people expect more for the price they pay. The Fullerton and Holiday Inn are comparable given that they belong to the same hotel class.
For the attribute, sleep quality, Raffles generally had the top rating. The Fullerton, Holiday Inn and Marina Bay Sands were generally comparable with a slight deviation in rating score.
For the attribute, value, the average rating score for this factor was generally lower than the rest of the attributes. The Marina Bay Sands was consistently ranked the lowest. For the rest of the hotels (including the budget IBIS Bencoolen), they are comparable in terms of the rating score, value, although the ratings among the four hotels is closest in the solo segment. However, in the friends segment, the IBIS Bencoolen has a high rating for the value attribute.
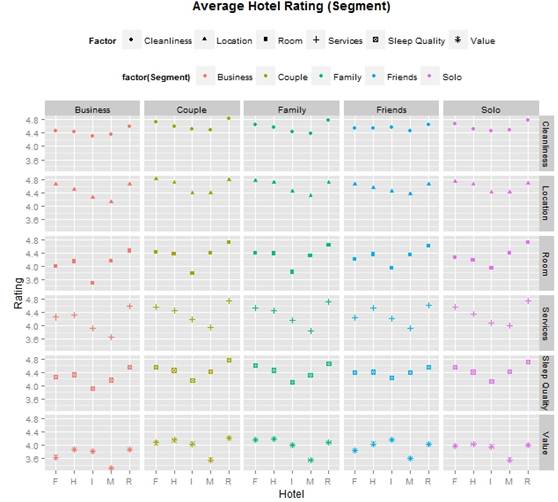
Figure 4. Average Hotel Ratings by Attributes and Segments.
Other general observations were that, the business group tends to give a lower rating compared to the other segments in all the attributes. Further, Room, Services and Sleep Quality attributes generally have greater variance compared to the rest of the attributes.
Also, the average rating score for the attribute, Value, tends to be lower compared to the rest of the attributes. Raffles generally was taking the lead in almost all of the attributes except the ‘Value’ attribute and across all the segment groups.
We next, performed a factor analysis to better understand which attributes grouped together naturally into a single factor. For the factor analysis to show that the attributes are grouped together, a rotated component matrix of at least 0.6 is required.
After factor analysis is completed, following is the outcome as shown in Table 3 below.
Table 3. Factor Analysis Outcome.
| Rotated Component Matrixa | ||
| Component | ||
| 1 | 2 | |
| rt.loc (location) | .264 | .964 |
| rt.sq (sleep quality) | .851 | .199 |
| rt.rm (room) | .850 | .227 |
| rt.clean (cleanliness) | .804 | .270 |
| Extraction Method: Principal Component Analysis. Rotation Method: Varimax with Kaiser Normalization. | ||
| a. Rotation converged in 3 iterations. | ||
Based on the analysis, 2 components were confirmed where sleep quality, room and cleanliness were grouped together under valid component 1 during analysis and location as a component 2 on its own. They factors are found to be significant as shown in Table 4 below.
Table 4. Factor Analysis Significance Test.
| KMO and Bartlett's Test | ||
| Kaiser-Meyer-Olkin Measure of Sampling Adequacy. | .796 | |
| Bartlett's Test of Sphericity | Approx. Chi-Square | 14732.084 |
| df | 6 | |
| Sig. | .000 | |
Table 5. Mean Score for Factors by Hotel.
| Hotel | |||||
| Factor | Fullerton | Holiday Inn | IBIS BEN | MBS | Raffles |
| Quality of Stay | 4.45 | 4.44 | 4.11 | 4.36 | 4.72 |
| Accessibility and Environment | 4.75 | 4.66 | 4.39 | 4.32 | 4.75 |
Table 5 above presented a summary of the mean scores of the 5 hotels and how they performed, represented by the 2 derived factors. In general, it seems like we can rank the 5 hotels in descending order with Raffles taking the lead and the other 2 hotels are Fullerton and Holiday Inn. MBS did not fare as well compared to the other high end hotels of the same class. A perceptual map provides the competitive landscape for the Hotels based on the 2 factors
The relative importance of the 6 key attributes perceived by the individual is derived on the assumption that attribute(s) that an individual did not indicate a rating is perceived as unimportant to the individual relative to the other attribute(s) that the individual make an effort to provide a rating. The number of rating an attributes received relative to the total responses received is then used to derive or infer the relative importance of an attribute perceived by an individual.
From the Perceptual Map in Figure 6, all the 5 hotels score high in cleanliness which fall under the ‘Keep It Up’ quadrant. In general, people perceived services as a critical attribute for hotel stays. This can be seen from the high importance score (>4.5) given across all 5 hotels. Value is the second most important attribute that people look for in hotel stays. All 5 hotels have the value attribute greater than 4.4 and they all fall under the ‘Concentrate here’ quadrant.
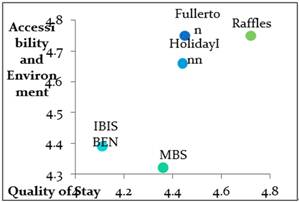
Figure 5. Perceptual Map for Hotels by Factors.
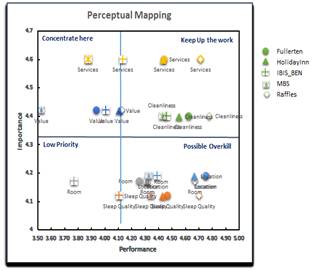
Figure 6. Perceptual Map for Hotels by Factors.
Raffles excel in Services and Cleanliness as seen from the ‘Keep up the work’ quadrant. However, it probably could also consider providing more package promotion given that the value attribute is in the ‘Concentrate here’ quadrant. The location attribute under the ‘Possible Overkill’ quadrant reflects the strategic advantage that Raffles has over the other hotel in terms of it location.
MBS needs to improve on their Services as currently the perceived performance is not good given that it falls under the ‘Concentrate Here’ quadrant. People probably feel that the hotel is overpriced as the value attribute is also score very low in the ‘Concentrate Here’ quadrant. Given that the room and the sleeping quality attribute fall under the ‘Possible Overkill’ it seems to suggest that the hotel has put a lot of emphasis to decorate up the room and provide better sleep quality.
Holiday Inn Hotel is quite similar to Fullerton Hotel’s profile given that cleanliness, services and value are all in the ‘Keep Up the Work’ quadrant. In terms of the location, Holiday Inn is within the shopping district and it is near to public transport. Given that the sleep quality and room are mapped to the ‘Possible Overkill’, it suggest that the hotel too place a lot emphasis on these two attributes which people might not really need.
IBIS Bencoolen Hotel is considered an economy class hotel compared to the other 4 hotels. As such, people might not have high expectation of the room. Nonetheless, the hotel scored well in term of services and cleanliness although people expect more in term of the value.
Fullerton is seen to be ranked second relative to Raffles. Fullerton also excels in Services and Cleanliness with a mean score slightly lower than Raffles. In term of its location, Fullerton in fact has a greater strategic advantage than Raffles given that its performance mean score is slightly higher than Raffles. This can be due to the fact that Fullerton is near to the scenic attractions, shopping district and business district and all within walking distance.
As shown from the factor analysis, the different segment groups seem to have different emphasis on the hotel attributes. To compare the different segment group, we will further apply segmentation analysis with the perceptual map using Fullerton as illustration in Figure 7 below. One key differentiating strategy for the hotel seems to be the ‘Value’ attribute. Different segment groups have different expectation on what is consider a valuable deal. Couple in particularly seems to prefer and attracted to packages compared to the other group. Hence, Fullerton could consider understanding the behaviors and preference of couple and tailor special packages for them for special occasions.
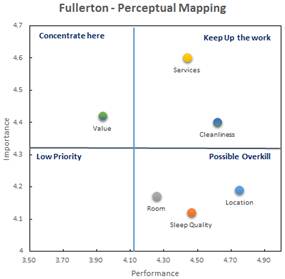
Figure 7.1. Fullerton – Perceptual Mapping.
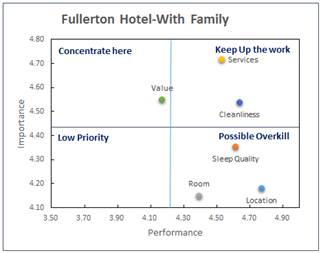
Figure 7.2. Fullerton – Hotel with Family.
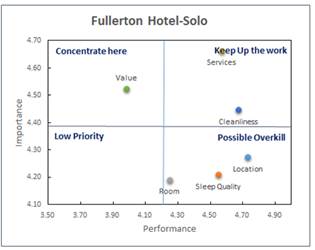
Figure 7.3. Fullerton – Hotel-Solo.
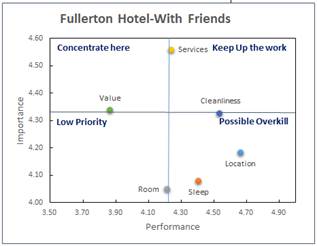
Figure 7.4. Fullerton – Hotel-with Friends.
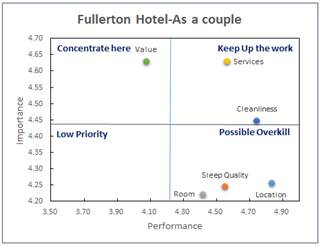
Figure 7.5. Fullerton – Hotel-as a Couple.
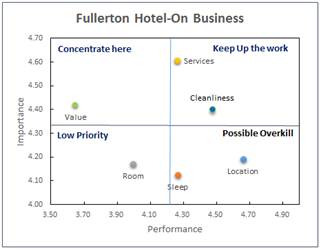
Figure 7.6. Fullerton – Hotel-as a Couple.
While, we can identify areas of improvements from the perceptual maps of the different hotels, it is also important to understand what the customers are saying positively or negatively about the hotel from their reviews
5. Review Analysis – Management Improvement Areas
Short of going through each and every review, which can be very time consuming and counter-productive, we employed Text Analytics to help determine what topics are being discussed when negative or positive reviews are being posted.
Knowing the topics (negative or positive) being discussed will allow the management to zoom in to specific areas of improvement and apply targeted steps to recover from the negative reviews – thereby improving the hotel’s image in the eyes of the consumer.
5.1. Fullerton Hotel
The negative reviews for Fullerton Hotel as shown in Figure 8 below (identified from the Word Cloud and LDA topic analysis) talk about around the topics of:
• Poor room quality (mouldy, smelly, worn feeling)
• Poor service (waiting, check-in/out, housekeeping)
• Bathroom
Based on the perceptual map for Fullerton it indicates that there is a need to improve in the Value perceived by the customers. The perceptual map also had Room as the second lowest score after Value. Fullerton’s management would need to improve in the specific areas of room and bathroom quality (addressing mouldy, smelly and worn out furniture in the room) and better service to reduce wait time for check in/out and housekeeping service – doing so would then improve the value of the stay as perceived by the customers.
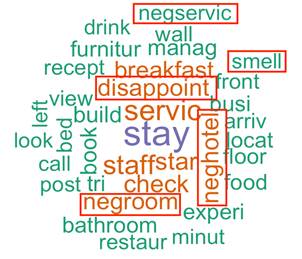
Figure 8. Word Cloud - Fullerton Negative Reviews.
The positive reviews for Holiday Inn Hotel are about around the topics of:
• Location (River, boat quay)
• View
• Walk
Based on the perceptual map for Fullerton it indicates that it is very highly rated for Location. The customers are talking positively about the location of the hotel. Fullerton Hotel management ought to use location as an advantage to attract and retain customers. Hence other hotels competitor hotel’s management should try to compete with Fullerton in other areas instead of Location.
5.2. Holiday Inn Hotel
The negative reviews for Holiday Inn Hotel (identified from the Word Cloud and LDA topic analysis) talk about around the topics of:
• Rate
• Charges
• Location
• Staff
• Room
• Poor stay experience
Based on the perceptual map for Holiday Inn it indicates that there is a need to improve in the Value perceived by the customers. Customers felt that the hotel was average and was too pricy (rate, charges) and had a poor stay experience. Holiday Inn’s management would need to focus on how to improve the room and overall stay experience. Training the staff on service quality would also improve the perceived value of the hotel.
The positive reviews for Holiday Inn Hotel are about around the topics of:
• Location
• Convenient (near Orchard road, near MRT, Taxi)
• Shopping
Based on the perceptual map for Holiday Inn, it indicates that it is very highly rated for Location. The customers are talking positively about the location and convenience of the hotel. Customers like the convenience of the hotel as it is located near Orchard road and is near MRT and taxi transport. Customers also like the proximity to Orchard road for shopping.
Holiday Inn management could market ‘staycations’ or holiday packages that bundle hotel stays with shopping promotions together to increase revenue and improve the average daily rate.
5.3. IBIS Bencoolen Hotel
The negative reviews for IBIS Bencoolen Hotel (identified from the Word Cloud and LDA topic analysis) talk about around the topics of:
• Price
• Bed
• Check-in / out
• Room
• Poor stay experience
• Basic
Based on the perceptual map for IBIS it indicates that there is a need to improve in the Services provided to the customers. Customers felt that the hotel was average (basic) and was too pricy (rate, charges) and had a poor stay. IBIS management would need to focus on the overall experience of the customer during their stay and also ensure that the room and beds expectations are adequately met.
5.4. MBS Hotel
The negative reviews for MBS Hotel (identified from the Word Cloud and LDA topic analysis) talk about around the topics of:
• Queuing
• Crowds
• Check-in / out
• Poor room quality
• Waiting
• Prices
Based on the perceptual map for MBS it indicates that there is a need to improve in the Services provided to the customers. Customers felt that there were long queues, crowds which possibly lead to long waiting times. This could also be attributed to the check in/out process. In addition, customers were also talking about prices and poor room quality. MBS management would need to look into what is causing the long queues and improve crowd management and the check in/out process.
5.5. Raffles Hotel
The negative reviews for Raffles Hotel (identified from the Word Cloud and LDA topic analysis) talk about around the topics of:
• Expensive
• Money
• Poor room quality
• Over expectations
• Poor service
Based on the perceptual map for Raffles Hotel it indicates that there is a need to improve in the Value provided to the customers. Customers felt that generally it was expensive (overpriced) and in spite of that, the service was poor. Customers had high expectations and were disappointed given the poor room quality and service and hence the perception of value was poor. The Raffles Hotel management would need to focus on improving services and work to "surprise" the customer and managing the customer’s expectations. Given the high price of the rooms, the quality of the rooms would also need to be improved upon.
6. Further Research
According to Shwu-Ing Wu and Pei-Chi Li (2011), customer relationship management, relationship quality and customer life time value impact on a customer’s preference for different hotels. It is recommended that the perception of customer relationship management, relationship quality and customer life time value should be further researched to determine whether there are perception differences between the customer and management views. Additional research is recommended to understand the customer’s voice. Given that Value and Services have been identified as the attributes perceived as importance by the customers, strategies can be developed around these two aspects to create that differentiating factors. As such, there is a need to gather more insights as inputs to developing the strategies. This can possibly be achieved through the following approach.
6.1. Improve Understanding of Customer Behavioral
Motivations Along with understanding customer behaviour, it is equally important to elicit the ‘why’ behind their behaviour. This could involve a 360 degree assessment of the customer journey across touch-points which will help identify ways to improve customer experience. In order According to Tito Conti (2013), both satisfied customers and dissatisfied customers are important to understand customer/stakeholder perceptions. Along with understanding customer behaviour, it is equally important to elicit the ‘why’ behind the behaviour. This could involve a 360 degree assessment of the customer journey across touch points which will help identify ways to improve customer experience. In order to gather ‘deep data’ around the customer challenges and unmet needs while transacting with the hotel at each touch point, the hotel management could adopt a journey mapping approach. The journey mapping exercise can help identify key influencers and key stakeholders at each step of the transaction journey. Further, opportunities to enhance customer experience at each touch point will be able to be identified and updates on segment profiles/personas that include insights around emotional behaviour will also be able to be established.
6.2. Adopt Segment Strategies
More targeted strategies in term of communication and promotion. Based on the analysis of the customer segments and profiles, specific actions and interventions can be developed to address the needs of a particular segment. Customised processes and policies can be created, thereby helping to enhance customer experience.
7. Conclusion
The top three attributes that drive ratings appear to be
1 Room Quality & Cleanliness
2 Sleep Quality
3 Service Level
Raffles Hotel consistently outperforms all the rest with Ibis being in last place. Although MBS is rated 5 Star it does appear to have some major issues it needs to address in terms of guest experience in waiting as well as perceived value for money.
Although the physical attributes of the hotel appear to be lower down the importance list they do appear very prominently in the textual feedback for different reason based on customer segment
• Business – requires location to be convenient for transport and customer visits
• Families – appreciate the facilities such as the pool and the sights
• Couples – appreciate the activities and experiential nature of the location
Recommendations
• Room Appointment
Room size, cleanliness and feel are extremely important in ensuring a good guest experience. With a tropical climate and guests mainly sourced from overseas there are very basic expectations that if not met can significantly affect the hotel rating. Pest control, cleanliness of the room and the fittings and fixtures instantly provide a first impression and need to be as perfects as possible.
Recommendation 1 - For those hotels that have the worst rating here it is possible that staff training and guest focus groups could help to correct cleanliness deficiencies and quickly increase the rating improvement. Those aspects of decoration or fittings would take longer and require investment and so can be prioritized.
• Bed and environmental aspects (noise & light)
Sleep quality is important in all of the hotels especially if the guests suffer from jetlag after travelling from their source countries
Recommendation 2 – Taking the lead from the Westin hotel and their ‘Heavenly Bed’ the hotels should investigate their mattress suppliers and perhaps understand the differing requirements of their guests. Mattress firmness level could be better matched with the guest and offered as an option like smoking or non-smoking rooms. This may add cost however better testing and evaluation could limit the choice of mattress to just 2 types
• Service Levels
This is a very large area to cover and feedback is sometimes very specific by hotel, guest segment or location. It is intangible and frequently may not be repeated owing to many confounding factors (staff on duty, time of year, grumpiness of guest etc).
Recommendation 3 - Further and continuing investigation and monitoring of the textual feedback is recommended to isolate and trend the key categories that need to be addressed. By doing this a dashboard can guide the management team to prioritise and ensure that these issues are fixed in a timely and cost effective manner.
Staff training and retention in a difficult workforce environment is important as they are typically the face and body of the customer experience and do leave a much deeper impression than the physical hotel itself. No amount of technology investment can replace the human touch in a guest experience.
• Location based improvements
The hotel site once chosen is difficult to choose and so the best has to be garnered from its surroundings.
Budget hotels by definition are likely to be in locations outside the CBD and major tourist site destinations. Expectations however still exist to have efficient and effective transportation options, access to reasonable restaurants and easy access information for the visit experience to be maximized.
Recommendation 4 – Transportation services from the hotel should be investigated and optimized to remove any issues of complaint or dissatisfaction. Partnerships with Taxi firms or clear transportation options for MRT or buses could be made simple through specific staff training. Concierge services should be of the best quality possible and targeted at the guest segment for the hotel. Perhaps other partnerships in this area can be leveraged and advice from the STB sought here.
• ider and continual competitor evaluation
The small size of Singapore and clustering of hotels has created a more vibrant competitive environment. New boutique hotels are opening and will have identified new niche segments, cost structures, approaches and service level mixes.
Shwu-Ing Wu and Jui-Ho Chen performed an in-depth analysis that revealed that hotels should focus on customer relationship management actions by participating in travel fairs, providing appropriate products, services, promotions, and professional employees, and strengthening internal operations and workflow to enhance relationship marketing effect and effectively improve the business performance against competitors.
Recommendation 5 – Remaining open to monitoring new entrant will ensure that innovative ideas can be incorporated quickly and new entrant effects minimized.
• Marketing Analytics
Along with improving attributes that need addressing the marketing department can move from a predominantly tactical guest acquisition and retention approach to a more strategic approach in setting and differentiating the hotel offers
Recommendation 6 - In order to determine more profitable and attractive segments, IT and analytics to can be used identify and message to audiences either not touched or those that have been touched on a transactional basis. Leveraging data from loyalty schemes as well as medium term focus on monitoring omni-channel touch points could add significant value.
References
- Hauser, J.R., Koppelman, F.S. (1979). Alternative perceptual mapping techniques: Relative Accuracy and Usefulness. Journal of Marketing Research, Vol. XV1 (November), 495-506.
- Green, P.E. and Rao, V. (1972). Applied Multidimensional Scaling. New York: Holt, Rinehart and Winston, Inc.
- Green, P. E and Wind, Y. (1973). Multiattribute decisions in Marketing. Hinsdale, Illinois: The Dryden Press. Lewis, R. C. & Chambers, R.E. (1989). Marketing leadership in hospitality. New York: Van Nostrand Reinhold.
- McCleary, K. W., Weaver, P. A., & Hutchinson, J. C. (1993). Hotel selection factors as they relate to business travel situations. Journal of Travel Research, 32 (2), 42-48.
- Taninecz, G. (1990). 1990 business traveller survey. Hotel and Motel Management, 205, 29-32, 57.
- Gundersen, M. G., Heide, M. & Olsson, U. H. (1996). Hotel Guest satisfaction among Business Travellers: What Are the Important Factors? The Cornell Hotel and Restaurant Administration Quarterly, 37(2): 72-81.
- Atkinson, A. (1988). Answering the eternal question: what does the customer want? The Cornell Hotel and Restaurant Administration Quarterly, 29(2): 12-14.
- Knutson, B. (1988). Frequent travellers: making them happy and bringing them back. The Cornell Hotel and Restaurant Administration Quarterly, 29(1): 83-87.
- Barsky, J.D. & Labagh, R. (1992). A strategy for customer satisfaction. The Cornell Hotel and
- Restaurant Administration Quarterly, 35(3): 32-40.
- Akan, P. (1995). Dimensions of service quality: a study in Istanbul. Managing Service Quality, 5(6): 39-43.
- Choi, T. Y., & Chu, R. (2001). Determinants of hotel guests' satisfaction and repeat patronage in the Hong Kong hotel industry. International Journal of Hospitality Management, 20: 277-297.
- Grönroos, C. (1982). Strategic Management and Marketing in the Service Sector. Cambridge: Marketing Science Institute.
- Carman, J.M. (1990). Consumer perceptions of service quality: an assessment of the SERVQUAL dimensions. Journal of Retailing, 66(1): 33-55.
- Bolton, R.N. & Drew, J.H. (1991). A multi-stage model of customers' assessments of service quality and value. Journal of Consumer Research, 17(March): 375-384.
- Danaher, P. J. & Mattsson, J. (1994). Customer Satisfaction during the Service Delivery Process. European Journal of Marketing, 28(5): 5-16.
- Jamali, D. (2007). A study of customer satisfaction in the context of a public private partnership. International Journal of Quality & Reliability Management, 24(4): 370-385.
- www.tripadvisor.com
- Shwu-Ing Wu, Pei-Chi Li (2011). The relationships between CRM, RQ and CLV based on different hotel preferences. International Journal of Hospitality Management 30 262-271.
- Naomi Kasolowsky. Maintaining Customer Loyalty. Consumer Connection |Brand Loyalty. Marketing Insights. January/February 2014. 18-19.
- Tito Conti. Viewpoint. Planning for competitive customer value. The TQM Journal. Vol. 25. No. 3, 2013. Pp. 224-243.
- Shwu-Ing Wu, Jui-Ho Chen (2012). Comparison between hotels and motels using CRM effect model. An empirical study in Taiwan. International Journal of Hospitality Management 31. 1254-1263.


