
American Journal of Marketing Research, Vol. 1, No. 2, August 2015 Publish Date: Jul. 10, 2015 Pages: 28-36
Factors Affecting Customer Retention in Telecom Sector of Pakistan
Rizwan Qaiser Danish1, *, Farid Ahmad1, Adeel Ateeq1, Hafiz Yasir Ali1, Asad Afzal Humayon2
1Hailey College of Commerce, University of the Punjab, Lahore, Pakistan
2COMSATS Institute of Information Technology, Vehari, Pakistan
Abstract
Customer retention is the most important and essential element in telecommunication sector as it caught a great deal of attention for marketing researchers in the last decade in Pakistan. Many service providers are losing their current customers every year due to highly competitive environment. The purpose of this study is to analyse different factors which affect the customer retention, such as satisfaction, trust, corporate image, commitment level, loyalty and switching behaviour of customers. The data was collected through self-administered questionnaires distributed to customers of different service providers. Overall 300 (response rate 68%) useable questionnaires were entered into SPSS and then AMOS was used for analysis purpose. Measurement and structural models were developed in structural equation modeling. The results showed that through Trust, Satisfaction and Loyalty customer retention is increased. Customers repurchase intentions are increased when they are satisfied with company products and services and are getting emotional and functional benefits.
Keywords
Trust, Satisfaction, Customer Retention, Loyalty
Received: May 1, 2015
Accepted: June 3, 2015
Published online: July 8, 2015
@ 2015 The Authors. Published by American Institute of Science. This Open Access article is under the CC BY-NC license. http://creativecommons.org/licenses/by-nc/4.0/
Contents
1. Introduction 2. Literature Review 2.1. Customer Satisfaction (CS) 2.2. Trust 2.3. Customer Retention 2.4. Commitment 2.5. Switching Costs 2.6. Customer Loyalty 2.7. Corporate Image 3. Methodology 3.1. Data Screening 3.2. Data Processing 3.3. Descriptive Statistics 4. Findings 5. Discussion Recommendations
1. Introduction
Telecommunication sector is indispensable part of economic growth for all the economies. In Pakistan, after independence this sector remained under the government control for the long term. The privatization was necessary for advancement and development of telecom sector that created a more competitive environment. If we compare Pakistan with other countries developing economies we find that Pakistan is far behind from others. The government monitors this sector with the help of Pakistan telecommunication authority (PTA). In 2000, deregulation policy is developed which leads toward the development of the telecom sector. Telecom sector was stated as industry in 2005. In present, five cellular operators Warid, Telenor, Mobilink, Ufone, and Zong are working in wide geographical areas of Pakistan. Mobilink GSM, a subsidiary of Orascom telecom, starts operating in 1994. It has 36 million subscribers and covers 10000 locations in Pakistan. Ufone is growing day by day and its subscribers reach to 23 million. Its 26% shares have an Emirates Telecommunication Corporation (Etisalat).
Telenor is a subsidiary of Sweden which starts operating in 2005. It has 30 million subscribers and covers almost 1146 areas in Pakistan. Warid started operation in 2005 which is Abu Dhabi Group. It has 12 million subscribers and covers 117 areas in Pakistan. Zong is a China mobile operator which started in 2007 and covers 291 areas in Pakistan. At present, this sector is going fast and changing day by day. Service quality and delivery channel are more important in telecom to maintain loyalty. In this field customer wants to get quality service according to his expectation. If customers are satisfied with service provider, it leads to more profitability and growth. The cellular industry is growing rapidly and has entered into a more competitive and challenging environment. It has also developed a large business industry such as handsets, manufacturing and installation (Eccho, 2009). Cellular industry now becomes part of daily life such as education, business, health and entertainment. Telecommunication structure rapidly changes in worldwide due to advancement in technology. In this challenging environment it is necessary for all service providers to retain customers (Kalakota et al., 1996).
Nowadays telecom sector faces many difficulties due to national and international competition in the market. The number of service providers is increasing day by day which will decrease new customers in specific providers. So companies are more concerned with satisfying existing customers and develop policy to retain them. Hence, customer retention has a strong and significant relationship with company success and future growth.
The research questions which are the focus of this article are mentioned as below:
• What are the main factors which influence and determine the customer retention in telecom sector of Pakistan?
• How to retain customers in the competitive environment of telecom?
2. Literature Review
2.1. Customer Satisfaction (CS)
Customer satisfaction is defined as the customer reaction and emotions towards expectation and performance appraisal (Henning, Thurau&Hanse,2000). Customer satisfaction can be demarcated with two basic concepts such as cumulative satisfaction and transaction specific (Herrmann & Gustafson, 2002). Oliver (1999) defines it as satisfaction is the consumption of the customer in pleasurable mood. High customer satisfaction increases customer retention and repurchase intentions (Anderson, 1998). According to market literature, customer satisfaction can be measured through customer loyalty and repurchase behaviour. Customer satisfaction is also increasing the company success, customer retention and long term competitiveness. Customer satisfaction leads to lower cost of a future transaction, high loyalty and increases the reputation of the company (Fornell & Lehmann, 1994). According to many studies there is a direct link between service quality and customer behaviours (Reichheld & Sasser 1990; Anderson & Sullivan 1990). Customer satisfaction has a greater influence to build up customer repurchase behaviour (Taylor & Baker, 1994). Satisfied customers are also informed his positive experience with friends and relatives which develop company feat and profit (Richens, 1983; File & Prince, 1992). Customer satisfaction boosts the customer retention by improving product and service performance (Witting & Bayer 1994). According to Anderson and Mittal (2000) customer retention can increase the profit of the company.
2.2. Trust
Trust is the most important element in the field of economics, management, philosophy and psychology. Davis and Schoorman (1995) elaborated that trust is willingness of one party upon another party to act as expected and perform a particular action. Trust has significant effect between long term relationships and customer loyalty (Berry, 1995; Bowen & Shoemaker, 2003; Chu, 2009). Aydin and Ozar (2005) explain that mobile service providers can develop subscriber loyalty by raising service quality, establish trust and making attractive option. Ling and Wang (2005) explained that trust and perceived value have a positive effect on customer retention and customer loyalty. According to Gaunaras (2003) trust is an essential part in all types of relationships. In short, trust have a positive effect on loyalty, outcomes and repurchase behaviour (Doney et al.., 2007). Trust is also used to develop a relationship between two parties which leads to retention behaviour. When we study retention elements in service sector it is linked to satisfaction, trust and commitment (Garbarino & Johnson, 1999). The researchers may also conclude that service quality, corporate image, trust and switching cost are those elements which are antecedents of customer retention and loyalty.
2.3. Customer Retention
Customer retention is a process which makes customers loyal towards specific company and repurchase product from this company (Cannie, 1994; Naumann, 1994). Mostly companies gain benefits from retention in form of profit, lower cost and long lasting benefits. Retention is only one element that increases profit from 5% to 85% (Zeithmal, 1996). Customer retention and satisfaction have nonlinear relationship. If the customer is satisfied from the company it leads to retention and dissatisfaction also greater negative impact on retention. Customer retention has financial impact on company which is based on the assumption that obtaining new customers are costly than retaining existing customer because for new customer different expenses occurred like advertising, operating expense and promotion (Anderson & Sullivan, 1990; Reichheld & Sasser, 1990). Rose (1990) explained that those customers who retain the company for 10 years provide more profit for the company than a customer who spend 5 years in the company. As we know those mobile networks rapidly change day by day with increasing subscribers so retention is essential elements for mobile service providers (Kim & Yoon, 2004). Retention and acquiring new customers is used for revenue and enhance market share of company (Rust, Zohorik & Keiningham 1995). Retention not only enhances market share growth but also reduce the cost (Fornell & Wernerfelt, 1987).
2.4. Commitment
Commitment is an important element to create a successful relationship between two parties. This concept is valid by many scholars (Bansal et al., 2004; Sanchez & Iniesta, 2004; Hess & Story, 2005) who explain that commitment affects the customer retention. Moorman et al. (1992) define that commitment is an important element in customer retention and argue that "it is a long term desire to maintain a valued relationship". Commitment is influenced by the level of trust because when trust exists and parties has confidence they will not make commitment with other parties. Furthermore, commitment is a part which develops long term relationship and maintains customer loyalty (Sanchez & Iniesta, 2004). Previous study indebted that commitment is playing an essential role in retention behaviour and defines consumer issues (Lachman et al., 1979). Commitment has two dimensions: affective commitment and calculative commitment calculative commitment are economically based and most rational due to switching costs but affective commitment is emotional based which involve personal attachment of customer with a company (Garbarino & Johnson 1999; Morgan & Hunt 1994). Commitment has not significant effect on trust and dependence. Quality is an essential part in creating affective commitment in future. When a customer gets quality service from organization it increases satisfaction level and leads to affective commitment.
2.5. Switching Costs
Switching cost is shifting of consumer from one company to another company (Mouri, 2005). Customer switching to others company has many reasons like price constraint, taste, innovation and behaviour. Switching cost will change the customer decision regarding particular organization. Roos (1999) explains that switching cost is occurred when customer change service provider fully and partially. Customer switching behaviour is changing due to price, trouble, ethical behaviour, competition, promotion, packages, brand loyalty, corporate image and advertisement. Earlier studies have explained that switching cost has positive impact on customer loyalty (Sharma, Patterson, 2000; Sharma, 2003). Earlier studies concluded that switching cost involves those costs which occur due to change product and service. In the business field switching cost is related to consumer repurchase intentions. There is a positive correlation between switching cost and consumer repurchase intentions. Switching cost develop a link between customer loyalty and satisfaction (Jonathan et al., 2001). Fornell (1992) described that switching cost has influenced the relationship between customer loyalty and satisfaction. In telecom sector it occurs when the customer is moving from one Service Company to another due to trust, loyalty and change in price or company brand.
2.6. Customer Loyalty
In telecom, loyalty is explained as a positive attitude toward particular service provider which leads to repurchase behaviour with the same organization (Fornell et al., 1996). Customer loyalty has a positive effect on attitude and behaviour which related to repurchasing of particular product of organization (Chu, 2009). Customer loyalty is considered as a competitive advantage for business (Lin & Wang, 2006). Loyalty is measured through repurchase intention, recommending product and tolerance toward price (Kim & Yoon, 2004). Customer loyalty is affected by customer emotional states (Gundlach et al. 1995; Kumar et al. 1995).Trust is also an important factor which has a positive impact on loyalty as well as customer behaviour and attitudinal loyalty. The lack of customer trust has negative impact on customer loyalty. Brand loyalty is very constructive for company because it develops long term relationships and repurchases behaviour (Assael, 1992). Studies proved that customer loyalty boost revenue and company growth.
2.7. Corporate Image
Corporate image is a perception in the customer's mind that reflects organization. The corporate image is also defined as overall impression which is made in customer mind towards organization (Barich& Kotler, 1991). Doane and Zinkhan (1990) explained that corporate image is an emotional interpretation which consists of beliefs and feelings. Service quality is positively correlated with corporate image. Ozer (2004) explains that corporate image is built up in customer mind due to better service and experience getting from the organization. Customer loyalty has a direct positive relationship with corporate image in telecommunication, retailing and the education sector. According to perceived quality model (Gronroos, 1988) perceived quality is a relationship of expected quality which is developed through communication skill, image, customer needs and experience quality. Many studies proved that when a company provides better services to customers it satisfies consumers and have a positive effect on organizational image. According to De Ruyter and Wetzels (2000) corporate image is a tool which measures organization credibility, quality and behaviour loyalty.
On the basis of above arguments following hypotheses emerge;
• H1: There is a relationship between satisfaction and customer retention.
• H2: There is a relationship between trust and customer retention.
• H3: There is a relationship between commitment and customer retention.
• H4: There is a relationship between switching cost and customer retention.
• H5: There is a relationship between customer loyalty and customer retention.
• H6: There is a relationship between corporate image and customer retention.
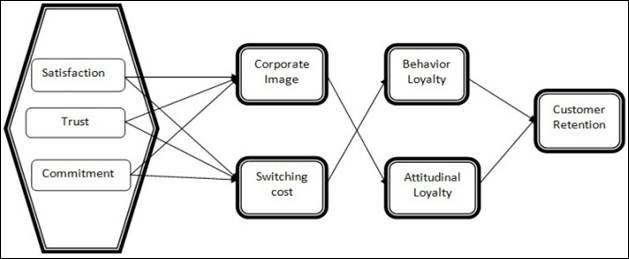
Figure 1. Proposed Model.
3. Methodology
In this study, population consists of telecommunication sector customers of Pakistan from different service providers (Warid, Telenor, Mobilink, Ufone and Zong). Self administered questionnaires were used for collecting data from respondents and due to lack of time, money and resources used 304was final useable sample size through convenience sampling. The questionnaire consists of ten parts. In the first part information regarding gender, age, marital status and service provider which customers are currently using were required. In our questionnaire we used Likert scale (1 for strongly agree, 2 for agree, 3 for neither, 4 for disagree and 5 for strongly disagree). The second part consists of questions about customer satisfaction regarding telecom services. In the third part of the questionnaire trust level of customer toward telecom was measured. The fourth part of questionnaire described the affective commitment regarding customer toward telecom. In the next parts calculative commitment, corporate image, switching cost, the behaviour loyalty and attitudinal loyalty of customers toward telecom sector were measured. In the last part of the questionnaire, customer retention was assessed.
3.1. Data Screening
Approximately 500 questionnaires were distributed telecom sector. 340 questionnaires were return back, out of which 36 questionnaires were rejected due to incomplete response on major variables. So we used 304 questionnaires which were entered in SPSS for analysis and used in AMOS. The useable response rate was 68%. To check the multivariate outliers in data, Mahalabonis d test was used. After running the Mahalabonis test 4 questionnaires were discarded from data due to high distance (p less than 0.001).
3.2. Data Processing
The statistical tools in which SPSS 18 (Statistical Package for the Social Science) and (AMOS 18) were used to analyse the data. The different statistical tests were performed in SPSS and CFA (Confirmatory Factor Analysis) was performed in AMOS.
3.3. Descriptive Statistics
In this research we used mean and standard deviation which help to describe, compare and analyse the data. The standard deviation is described that how close our data around the mean values. Cronbach alpha (α) was used to check the result and internal consistency of data. The internal consistency is used to check how variables are correlated with each other. In basic research the range of Cronbach alpha coefficient lies between 0.5 to 0.6, while 0.8 and higher value of Cronbach alpha coefficient is more important or ideal (Nunnally & Bernstein, 2010). Correlation helps to measure the linear relationship among variables. When two or more variables are varying together there is positive or negative correlation.
Confirmatory factor analysis is used to locate a small set of latent variables which explain the covariance between a larger set of manifest variables (also called observed variables). This technique is used by the researchers to analysis different hypotheses of study and show relationship among the manifest variables and also underlying unobserved constructs. CFI (comparative fit index) is used as a discrepancy function for sample size. Its range is between from 0-1 and largest values explain the better fitness of the model. According to Hu and Bentler (1999) CFI value of 0.90 or greater is used for acceptable of model fitness. RMSEA (Root Mean Square Error of Approximation) is related to residual in the model. Its range lies between 0-1 and its smaller value explains the better fitness of the model. For model fitness we used 0.06 or less value of RMSEA (Hu & Bentler, 1999).
4. Findings
Among 300 respondents of this study, gender shows 203 Male (67.7%) and 97 Females (32.3%). 2.3% were from 20 or less years of age, 31.3% lies in 20-24 years of age, 36.7% from 25-29 years of age, 23% from 30-39 years of age, and 4.3% show age between 40-49 years, 1.3% from 50-59 years of age and only 1% are of 60 and above age. Married respondents are 26.3% and 73.7% are single. Among service providers in 16.3% respondents are from Warid, 16.7% Telenor, 25.3% Mobilink, 32.3% Ufone and 9.3% of Zong.
Table 1. Mean, Standard Deviation and Pearson Correlation among variables (N=300).
| Mean | S.D | CS | TR | AF | CC | CI | SC | BL | AL | CR | |
| Satisfaction | 2.793 | .2707 | 0.660 | ||||||||
| Trust | 2.017 | .5296 | .206** | 0.739 | |||||||
| Affective Commitment | 2.653 | .3957 | .441** | .338** | 0.554 | ||||||
| Calculative commitment | 3.123 | .8218 | .433** | -.092 | .027 | 0.864 | |||||
| Corporate image | 1.844 | .4235 | .167** | .366** | .262** | -.098 | 0.519 | ||||
| Switching cost | 2.228 | .4002 | .277** | .457** | .387** | .193** | .340** | 0.585 | |||
| Behaviour Loyalty | 2.647 | .6691 | .386** | .067 | .062 | .720** | -.138* | .282** | 0.682 | ||
| Attitude loyalty | 2.233 | .4803 | .247** | .026 | .120* | .581** | -.073 | .190** | .655** | 0.510 | |
| Retention | 1.803 | .4668 | .163** | .181** | .181** | .097 | .363** | .450** | .073 | .192** | 0.739 |
**Correlation is significant at the 0.01 level (2-tailed), *Correlation is significant at the 0.05 level (2-tailed), Reliability of each variable is mentioned in the table diagonally.
Mean values define the average of all responses in a variable, which explain that its values lies between 1 and 2 in majority which represent that mostly respondents shows agreements with the statements. Standard deviation shows the distribution of responses around the mean and its result can vary from estimated results. The mean value of satisfaction is 2.793 and standard deviation. 2707 which indicates that mostly respondent are agree and satisfied with mobile network. The values of trust with Mean 2.017 and SD. 5296 show that the customer has trust on company policy and procedure. The level of customer’s commitment to the company has Mean values 2.653 and SD. 3957. The mean values of corporate image are 1.844 and SD. 4235 which explain that the company has a good image in the market and among customers. The mean values of switching are 2.228 and SD is .4002. Behaviour loyalty has mean values 2.647 and SD. 6691 which indicates that customers are loyal with company policy. Attitude loyalty has mean values 2.233 and SD. 4803. The mean value of customer retention is 1.803 and SD. 4668 which indicate that mostly customers are satisfied from company and they also want to retain with them in future.
The variable-wise reliability depicts as follows: Satisfaction’s 5 items reliability is 0.660, trust’s 6 items reliability is 0.739, affective commitment’s 5 items reliability is 0.554, calculative commitment’s 2 items reliability is 0.864, corporate image’s 4 items reliability is 0.519, switching cost’s 6 items reliability is 0.585, behaviour loyalty’s 5 items reliability is 0.682, attitude loyalty’s 5 items reliability is 0.510 and customer retention’s 3 items reliability is 0.739 respectively. All of these are acceptable as they are above than the acceptable criteria of reliability.
The structural model in figure 3 has CMIN/DF= 1.995, RMR=0.007, GFI =0.980, AGFI=0.935, RMESA=0.058 and PCLOSE 0.309. The overall model is a good fit. All the values are below (for RMESA, CMIN/DF) and above (for fit indexes) the threshold values as suggested by Hu and Bentler (1999). While the AGFI and GFI are significantly influenced by the sample size so the RMESA are measured more appropriate for model explanation. The value of RMESA below .06 and close to 0.00 shows good fit.
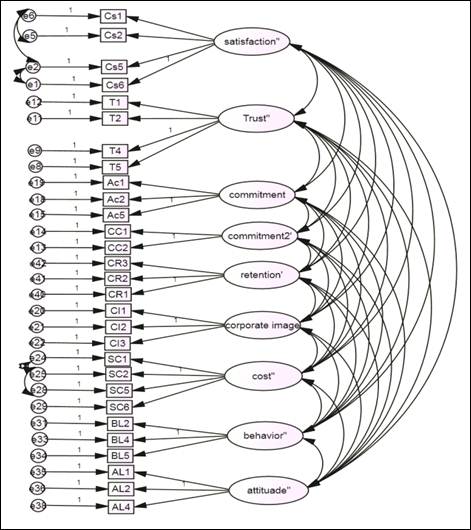
Figure 2. Confirmatory Factor Analysis.
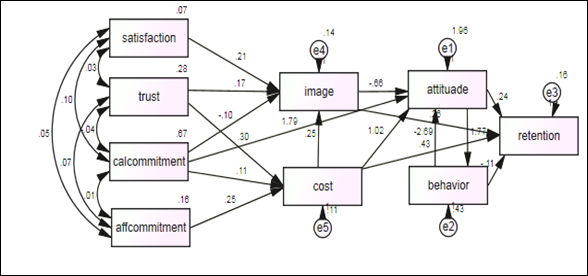
Figure 3. Structural Model.
Table 2. Standardized Regression Weights.
| Variables | Estimate | ||
| Cost | <--- | Calculative commitment | .223 |
| Cost | <--- | Affective Commitment | .248 |
| Cost | <--- | Trust | .394 |
| Corporate image | <--- | Trust | .211 |
| Corporate image | <--- | Switching cost | .241 |
| Corporate image | <--- | Calculative commitment | -.185 |
| Corporate image | <--- | Satisfaction | .137 |
| Attitude | <--- | Calculative commitment | 3.055 |
| Attitude | <--- | Corporate image | -.580 |
| Attitude | <--- | Switching cost | .853 |
| Retention | <--- | Corporate image | .234 |
| Retention | <--- | Switching cost | .369 |
| Retention | <--- | Attitude loyalty | .242 |
| Retention | <--- | Behaviour Loyalty | -.157 |
| Attitude loyalty | <--- | Behaviour Loyalty | -3.744 |
| Behaviour Loyalty | <--- | Attitude loyalty | 1.274 |
5. Discussion
In the competitive environment it is necessary for all service providers to retain customers and reduce churn rate. In this study we discussed those factors which have strong relationships with customer retention and these factors included customer satisfaction, trust, affective commitment, and calculative commitment, corporate image, switching, cost behaviour, loyalty and attitudinal loyalty. Results indicate that the satisfaction has a positive relationship with customer retention because only those customers are using company products and services which currently satisfied from the company. Customer retention is not possible without satisfaction. Trust is also playing an important role to achieve retention level. In our analysis of correlation it shows positive and significant relationship with retention. In previous literature it is stated that "No business is possible without trust". In the analysis of switching cost we know that it has not shown much correlation with customer retention as well as trust and satisfaction. So, switching cost has less importance in telecom because when a customer is not satisfied from the company than without considering the price they switch to another company.
In case of corporate image it has a significance relationship with customer retention because mostly customer attracts with image of organization in the market. Regarding commitment factor, finding indicates that commitment has a positive impact on customer retention. The level of commitment is varying from customer to customer which depend upon company product and services. Evidence shows that customer loyalty toward service provider is foremost focus on creating long term relationships with a company. Customer loyalty helps to build confidence inside customer and develop relationships. After analysing these different factors which affect customer retention we conclude that customer retention is the influence of all these factors but satisfaction has most important element to retain customer in future.
• Based upon the above discussion, we get the following conclusion regarding customer retention toward telecommunication:
• In service provider customer satisfaction has a positive influence upon customer retention
• Trust has a positive impact on customer retention in telecommunication sector
• In service provider affective commitment and calculative commitment have significant and positive relationship with customer retention
• In service provider corporate image has a positive impact on customer retention
• In service provider customer loyalty has a positive influence on customer retention
• Switching cost has also impacted on customer retention in telecommunication sector
Recommendations
• In telecom sector customer care is essential element for customer retention because customers want solution of the problem timely and they also want to get feedback so if company arranges a system which quickly response to customer then it will helps to retain customers.
• If companies provide free packages like free minutes promotion, free GPRS, free calls and SMS, it will attract customers also help to enhance customer retention.
• If companies provide strong signals and good coverage areas for all customers it will satisfy customers who will also encourage his friends and family to use the same connection in future. If the company will not provide good signals, customer will switch to another company.
• Effective communication has also enhanced the customer retention because if a company makes strong communication with its clients, it helps in creating a long term relationship.
References
- Anderson, E. W. (1998). Customer satisfaction and word of mouth.Journal of service research, 1(1), 5-17.
- Anderson, E. W., & Mittal, V. (2000). Strengthening the satisfaction-profit chain.Journal of Service research, 3(2), 107-120.
- Anderson, E. W., & Sullivan, M. W. (1990, September). Customer satisfaction and retention across firms.In Presentation at the TIMS College of Marketing Special Interest Conference on Services Marketing.
- Anderson, E.W., Fornell, C. & Lehman, D.R. (1994). Customer satisfaction, market share and profitability: findings from Sweden. Journal of Marketing, 58, 53-66.
- Assael, H. (1992). Consumer behaviour and marketing action In Consumer behaviour and marketing action, by Henry Assael, 87.Boston: PWS-KENT Company.
- Aydin, S. &Ozer, G. (2005). How switching costs affect subscriber loyalty in the Turkish mobile phone market: Anexploratory study. Journal of Targeting, Measurement and Analysis for Marketing,14(2), 141-155.
- Bansal, H. S., P. G. Irving, et al. (2004).A Three-Component Model of Customer Commitment to Service Providers. Journal of the Academy of Marketing Science32(3), 234-250.
- Barich, H., & Kotler, P. (1991).A framework for marketing image management.Sloan management review, 32(2), 94.
- Berry, L. L. (1995). Relationship marketing of services—growing interest, emerging perspectives.Journal of the Academy of marketing science, 23(4), 236-245.
- Bowen, J. T., & Shoemaker, S. (2003). Loyalty: A strategic commitment. Cornell Hotel and Restaurant Administration Quarterly, 44(5-6), 31-46.
- Cannie, J. K. (1994). Turning Lost Customers Into Gold:--and the Art of Achieving Zero Defections. Amacom.
- Chu, R. (2009). Stated-importance versus derived-importance customer satisfaction measurement.Journal of Services Marketing,16(4), 285-301.
- De Ruyter, K., &Wetzels, M. (2000). Customer equity considerations in service recovery: a cross-industry perspective. International Journal of Service Industry Management, 11(1), 91 108.
- Dobni, D. &Zinkhan, G. M. (1990). In Search of Brand Image: A Foundation Analysis. Advances n Consumer Research, 17, 110-19.
- Doney, S. C., Mahowald, N., Lima, I., Feely, R. A., Mackenzie, F. T., Lamarque, J. F., &Rasch, P. J. (2007). Impact of anthropogenic atmospheric nitrogen and sulfur deposition on ocean acidification and the inorganic carbon system.Proceedings of the National Academy of Sciences, 104(37), 14580-14585.
- Eccho (2009).Ecch the case of learning.Waterloo Regional Police.Summer - 41:pp: 1-26.
- File, K. M., & Prince, R. A. (1992). Positive word-of-mouth: customer satisfaction and buyer behaviour. International Journal of Bank Marketing, 10(1), 25-29.
- Fornell, C. (1992). A national customer satisfaction barometer: the Swedish experience. Journal of Marketing, 56, 6-21.
- Fornell, C., &Wernerfelt, B. (1987). Defensive marketing strategy by customer complaint management: a theoretical analysis. Journal of Marketing research, 337-346.
- Fornell, C., Johnson, M. D., Anderson, E. W., Cha, J. & Bryant, B. (1996). The American customer satisfaction index: description, findings, and implications. Journal of Marketing, 60(4), 7-18.
- Garbarino, E., & Johnson, M. S. (1999). The Different Roles of Satisfaction, Trust, and Commitment in Customer Relationships. Journal of Marketing63(2), 70-87.
- Gounaris, S. P. (2003).Trust and commitment influence on customer retention: insights from business to business services. Journal of business research, 58(March), 126-140.
- Gronroos, C. (1988). Service quality: the six criteria of good perceived service quality. Review of business, 9(3).
- Gundlach, G. T., Archol, R. S., &Mentzer, J. T. (1995).The structure of commitment in exchange.Journal of Marketing,59, 78–92.
- Hennig-Thurau, T., & Hansen, U. (Eds.). (2000). Relationship marketing: Gaining competitive advantage through customer satisfaction and customer retention. Springer.
- Hess, J., & Story, J. (2005). Trust-based commitment: multidimensional consumer-brand relationships. Journal of Consumer Marketing, 22(6), 313-322.
- Hu L. T., &Bentler, P. (1995).Evaluating Model Fit, in Structural Equation Modeling. Concepts, Issues, and Applications, ed. R. H. Hoyle, London: Sage, 76-99.
- Kalakota, R., T. Stone, et al. (1996). Frontiers of Electronic Commerce.Whinston, Addison-Wesley Pub (Sd)
- Kim, H. S., & Yoon, C. H. (2004). Determinants of subscriber churn and customer loyalty in the Korean mobile telephony market Determinants of subscriber churn and customer loyalty in the Korean mobile telephony market. Telecommunications policy, 28,751- 765.
- Kumar, N., Scheer, L. K. &Steenkamp, J. B. E. M. (1995).The effects of perceived interdependence on dealer attitudes.Journal of Marketing Research, XXXII, 348-56.
- Lachman, R., Lachman, J. L., & Butterfield, E.C. (1979).Cognitive psychology and information processing: An introduction. Hillsdale, NJ: Lawrence Erlbaum Associates.
- Lin, H. & Wang, Y. (2005).An examination of the determinants of customer loyalty in mobile commerce contexts.Information & Management,43(3), 271-282.
- Mayer, R. C., Davis, J. H., &Schoorman, F. D. (1995).An integrative model of organizational trust.Academy of management review, 20(3), 709-734.
- Moorman, C., Zaltman, G., & Deshpande, R. (1992). Relationships Between providers and users of market Research: The dynamics of trust within and between organizations. Journal of Marketing Research, 29, 314-29.
- Morgan, R. M., & Hunt, S.D. (1994).The commitment–trust theory of relationship marketing.Journal of Marketing, 28, 20–38.
- Mouri, N. (2005). A Consumer-based Assessment of Alliance Performance: An Examination of Consumer Value, Satisfaction and Post-purchase behaviour; University of Central Florida, 2005, 156 pages;
- Oliver, R. L. (1997). Satisfaction: A Behavioural Perspective on the Customer. McGraw-Hill, Boston, MA.
- Ozer, M. (2004). The role of the Internet in new product performance: A conceptual investigation. Industrial Marketing Management, 33(5), 355-369.
- Reichheld, F. &Sasser, E. (1990). Zero defections: Quality comes to services. Harvard Business Review68(5), 105-111.
- Richens, M. L. (1983). Negative Word of Mouth by Dissatisfied Consumers: A Pilot Study. Journal of Marketing (Winter), p. 69
- Roos, I. (1999). Switching processes in customer relationships. Journal of Service Research, 2 (1), 68-85.
- Rose, S. (1990). The coming revolution in credit cards.Journal of Retail Banking, 12, 17-19.
- Rust, R. T., Zahorik, A. J., &Keiningham, T. L. (1995). Return on quality (ROQ): Making service quality financially accountable. Journal of marketing, 59(2).
- Sanchez, M. N. &Iniesta, M. A. (2004).The structure of commitment in consumer-retailer relationships: Conceptualization and measurement. International Journal of Service Industry Management,15(3), 230-249.
- Sharma, N. & Patterson, P. G. (2000). Switching costs, alternative attractiveness and experience as moderators of relationship commitment in professional, consumer services. International Journal of Service Industry Management, 11(5), 470-490.
- Taylor, S. A., & Baker, T. L. (1994).An assessment of the relationship between service quality and customer satisfaction in the formation of consumers' purchase intentions.Journal of retailing, 70(2), 163-178.
- Zeithaml, V. B. (1996). MJ: Services Marketing.


