
American Journal of Economics, Finance and Management, Vol. 2, No. 4, August 2016 Publish Date: Aug. 16, 2016 Pages: 44-48
Financial Constraint: Evidence from Indonesia
Restu Warno Putra1, *, Dwi Sunu Kanto2
1Jalan TMP Kalibata, Universitas Trilogi, Jakarta, Indonesia
2Faculty of Economics and Business, Universitas Trilogi, Jakarta, Indonesia
Abstract
Company needs funding to run their business activity such as corporate investment. Financial constraint is a market friction which could prevent or obstruct a company from obtaining fund. The purpose of this paper is to empirically test the effect of Corporate Social Responsibility disclosure, Good Corporate Governance disclosure, Corporate Risk, and cost of debt towards financial constraint within companies that are listed in Kompas 100 Index during 2012 – 2014. Sampling technique that is use in this paper is purposive sampling, and the number of companies as a sample is 68 companies. The variable independents that are used in this paper are Corporate Social Responsibility disclosure, Good Corporate Governance disclosure, Corporate Risk, and Cost of Debt, and the variable dependent is Financial Constraint. Analysis method that was used in this thesis is panel data regression with statistical software Eviews 9 Student Version. The results show that Corporate Social Responsibility disclosure has a significant and positive effect towards Financial Constraint, Good Corporate Governance disclosure has a significant and positive effect towards Financial Constraint, Corporate Risk has a significant and negative effect towards Financial Constraint, and Cost of Debt is not significant and has a negative effect towards financial constraint within companies that are listed in Kompas 100 Index during 2012 – 2014. One of the suggestions for companies that are listed in Kompas 100 Index is to give more attention towards Corporate Social Responsibility disclosure and Good Corporate Governance disclosure, and also pay attention towards Corporate Risk from Stock Price.
Keywords
Corporate Social Responsibility Disclosure, Good Corporate Governance Disclosure, Corporate Risk, Cost of Debt,
And Financial Constraint
Received: May 18, 2016
Accepted: June 1, 2016
Published online: August 16, 2016
@ 2016 The Authors. Published by American Institute of Science. This Open Access article is under the CC BY license.http://creativecommons.org/licenses/by/4.0/
Contents
1. Introduction
Any company requires funding to execute its business plan just like the corporate investment activities. Financing activities is the method used by the company to get the money to fund the company's needs. Because of its size and its potential in determination of the failure and success of the company, the company is cautious in the acquisition and management of financial resources. Decisions on these matters determines the company's organizational structure, affecting its growth, affect exposures to risk and determining the strength of outsiders in business decisions [9]. Financial Constraint is a market friction that can prevent or inhibit a company in obtaining or generating investment fund or the value of a positive NPV [6, 1].
Level of financial constraint contained in a company can be affected by various external and internal factors. Asymmetric information is one of the internal factors that may cause the company to experience difficulties or obstacles in obtaining external funding. Agency conflict also gave rise to the asymmetric information between the agent and principal. When companies and potential investors or lenders have a high degree of asymmetric information about the company's prospects, it is likely that external funding has significant costs or even not available at all for some companies in certain categories [2]. One of the external factors that may influence the degree of financial constraint is Corporate Risk, the higher the level of risk that is owned by a company, then the company will be further hampered to obtain external funding as investors avoid risk, and vice versa. Cost of debt is the rate of return demanded by lenders when lending company’s fund. The higher the rate of return that creditor demanded the more difficult for the company to return the loans. Therefore, the lower the cost of debt, the lower the level of financial constraint faced by the company.
Investors must have a reference (benchmark) to see which direction the market moves and the performance of its investment portfolio, so no need to see the whole company with the potential to generate the best return in one by one. Kompas 100 Index is a stock index of 100 shares of public companies traded on the Indonesia Stock Exchange (IDX). Stocks included in the Kompas 100 Index are estimated to represent approximately 70-80% of the total market capitalization of all shares listed on the Indonesia Stock Exchange (IDX). So the investors can see the trend movement direction by observing the movement Index Kompas 100 Index [10].
This study examined the effect of Corporate Social Responsibility disclosure, Good Corporate Governance disclosure, Corporate Risk, and Cost of Debt towards companies listed in Kompas 100 Index during period 2012 – 2014.
The rest of this study is organized into several sections. Section 2 discuss about literature review, section 3 describes the methodology used in this paper, section 4 reports and discuss the findings, and finally the conclusion and remarks is given in section 5.
2. Literature Review
While doing an investment decision, there are two types of funding for company’s needs, internal and external funding. Internal funding comes from retained earnings, while external funding comes from issuing shares, bond, and bank loans [7]. In order for a company to funding their needs, the company can utilize their external source of fund such as bank loans and issuing shares, or utilize their internal source of fund which comes from retained earnings. Based on the asymmetric information theory, it is known that there are parties that obtain more information (management) compared with another (shareholders), so there is an assumption that when a company’s prospects is good, the management will not issue new shares to finance their investment, but they will use the company's retained earnings as a source of investment funding so the results can be enjoyed by the shareholders.
And when the company’s prospects are less good, the management will issue new shares as their source of investment fund so that previous shareholder responsibilities are reduced (sharing occurs with the new shareholders), this causes investors are reluctant to invest in companies that issue new shares and the issuance of new shares have become more costly when used as a funding source in corporate investment activities [14]. Although the company has no constraint in obtaining the external funds, the rate of loans to the company should not be excessive.
Pecking order theory states that the company is more likely to choose the internal funding rather than external funding. This theory explains the order of manager’s priority in determining their source of funding. Preferences manager stated in the order starting from the funding source of internal financing as the main source. The next priority is bank loans, and the last is issue of shares. Pecking order theory predicts that using external debt as a source of fund is based on internal funding deficit [8].
There are so many previous study using different measurements to observe the effect of several factors that may affect the level of financial constraint, one of which is the study of the effect of corporate social responsibility disclosure to capital constraint, or obstacles encountered in obtaining company’s external fund [1]. One of the hypotheses of other research is about the quality of disclosure of environmental performance and corporate governance mechanism towards capital constraint [5]. Investors have goals to earn the high rate of return, and the return of the investment has proven to be uncertain, thus, the smaller the level of Corporate Risk, the greater the desire of investors to invest in the company, so it’s easier for a company to obtain the external fund. Debt is used as a financing alternative for the company because it gives the advantage of tax saving resulting loan interest is tax deductible, thus ultimately reduce the amount of tax to be paid by the company. In obtaining the company’s debt, the company takes charge, so there will be the cost of debt. Cost of debt is the interest rate received by the creditor as the rate of return required [13]. The higher the level of a company's cost of debt, the higher the level of financial constraint faced by the company.
This study used Corporate Social Responsibility disclosure, Good Corporate Governance disclosure, Corporate Risk is measured by using systematic risk, and Cost of Debt as independent variables. And Financial Constraint is measured by using Kaplan-Zingales Index (KZ) as the dependent variable. KZ Index is a relative measurement to measure the level of trust a company to obtain funding from external parties. Companies with a high value of KZ Index will most likely run into trouble when the financial conditions of companies experiencing tension, because the company may struggle to fund their operational activities [1]. The purpose of this study is to determine the effect of Corporate Social Responsibility disclosure, Good Corporate Governance disclosure, Corporate Risk, and Cost of Debt towards Financial Constraint in companies listed in Kompas 100 Index during period 2012 – 2014.
3. Methodology
This section was designed to discuss the research methods used in this study for determine the effect of Corporate Social Responsibility disclosure, Good Corporate Governance disclosure, Corporate Risk, and Cost of Debt towards Financial Constraint. This study used quantitative approach with panel data regression test as a tool to determine the effect of various internal and external factors towards Financial Constraint.
This study used all companies listed in Kompas 100 Index as research population. Sample of this study were selected using pusposive sampling with various criteria as follows: Companies that are listed in Kompas 100 Index over the period 2012-2014, companies listed in Kompas 100 Index that published an annual report during the period 2012-2014 in a row, companies listed in Kompas 100 Index that operate outside the field of Banking and Finance, companies listed in Kompas 100 Index, companies listed in the Compass 100 Index that issued the financial statements expressed in Indonesian Rupiah (IDR) and ends on December 31 during the period 2012-2014. This is because the movement of the exchange rate is very volatile and unstable during the study period, companies listed in Kompas 100 Index that has a complete data regarding social activities disclosure and corporate governance during the period of 2012-2014. After the selection of the sample, a total of 68 companies that listed in Kompas 100 Index were sampled for 3 years in a row from 2012-2014. So there are 204 observations. To test the effect of the Corporate Social Responsibility disclosure, Good Corporate Governance disclosure, Corporate Risk, and Cost of debt towards Financial Constraint, the panel data regression models were used to test hypotheses of this study, is as follows:
KZi,t = β0 + β1CSRDIi,t + β2GCGDIi,t + β3RISKi,t + β4CODi,t + ɛ
Remarks:
KZi,t: Financial Constraint (KZ Index)
CSRDIi,t: Corporate Social Responsibility Disclosure Index
GCGDIi,t: Good Corporate Governance Disclosure Index
RISKi,t: Corporate Risk (systematic risk)
ODi,t: Cost of Debt
β0: Constanta
β1...β4: Regression Coefficient
ε: Error terms
Then the data is analyzed using panel data regression by using software Eviews 9 Student Version. So there are 2 approach, fixed effect, and Random effect. Hausman test was then performed to test whether there is a difference between the Fixed Effects and the Random Effect. After that, a comparison by looking at R- squared statistics, probability F - statistics, as well as a significant number of variables was done. The comparison resulting in selected fixed effect as the method that is used to analyze the results of the study.
4. Empirical Findings and Discussions
Panel data regression was started with fixed effect method, and Random effect method. Next the Hausman Test was performed, after that compared several key statistical figures to elect approach method which will be used.
Table 1. Comparison of Panel Data Regression result for Fixed Effect and Random Effect Method.
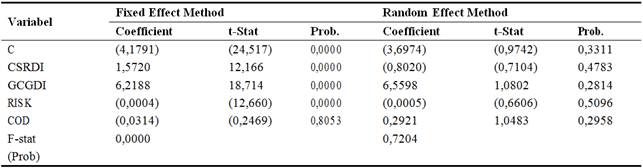
Based on the above comparison, the fixed effect panel regression method shows that only one independent variable which showed not statistically significant based on the probability of its t-Stat, which is COD variable with a significance level of 0.8053 (α > 0.05), while another variable, CSRDI, GCGDI, and RISK has a value of α < 0.05, so those variables can be expressed as highly significant. R-squared value is quite high at 0,9663 or 96,63%. While on the random effect panel regression method, it can be seen that there is not a significant independent variable, where all independent variable, CSRDI, GCGDI, RISK, and COD based on the statistical probability of its t-Stat show that α > 0.05. While the value of R-squared statistics also amounted to only 0,0104 or 1,04%. However, it has not been able to give the final result on which the method of analysis should be used in this study, therefore, the next step will be the selection by using the Hausman test to see whether there are differences between Fixed Effect and Random Effect methods.
Table 2. Hausman Test result for Panel Data Regression.
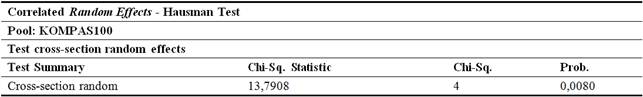
Table above shown that the value of probability on the cross section random effect test shows the figure 0,0080, which means significant with a significance level of 95% and using Chi-square statistical distribution [3]. So that the decision taken in this Hausman Test is reject H0 (p – value < 0,05) and accept Ha, with hypothesis as follows [12]:
H0: There are no substantial differences between fixed effect and random effect method
Ha: There are substantial differences between fixed effect and random effect method
Therefore, the Hausman Test above has proven that there are substantial differences exist between fixed effect and random effect method. And, it is necessary to compare some key statistical figures such as R-squared, and Probability F-Statistics.
Table 3. Comparison of Statistical value in Panel Data Regression Fixed Effect and Random Effect Method.
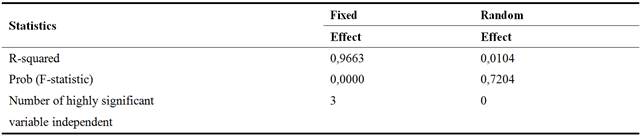
Based on above comparison, the fixed effect method statistically can give better interpretation towards regression with random effect method. Because this study used cross section data (N) more than the time series data (T), the fixed effect method is an appropriate method to use in this study.
Result of the analysis in fixed effect regression method with Financial Constraint (KZ) as dependent variable shows the constanta value of -4.1791, then the regression coefficient value of Corporate Social Responsibility Disclosure Index (CSRDI) is equal to 1.5720, regression coefficient value of Good Corporate Governance Disclosure Index (GCGDI) is equal to 6.2188, regression coefficient value of Corporate Risk (RISK) is equal to -0.0004, and regression coefficient value of Cost of Debt (COD) is equal to -0.0314. Thus, the regression equation is as follows:
KZit = – 4.1791 + 1.5720CSRDIit + 6.2188GCGDIit – 0.0004RISKit - 0.0314CODit
(0,0000) (0,0000) (0,0000) (0,0000) (0,8053)
CSRDI variable has a significant and positive impact towards KZ on the company that listed in Kompas 100 Index during the years 2012-2014. The results support previous study [1]. This is because Corporate Social Responsibility is one of the ways and strategies that can be undertaken by a company to reduce the degree of asymmetry of information contained in the market. Specifically, companies that are facing a low level of financial constraints tend to be invested in aspects of CSR as one of the initiatives to get better CSR Performance [4, 1]. GCGDI variable has a significant and positive impact towards KZ on the company that listed in Kompas 100 Index during the years 2012- 2014, the results were statistically different from the results of previous studies which stated that companies with supervision system mechanisms of effective corporate governance, such as the presence of the audit committee, as well as the high percentage of independent commissioners and independent directors, tend to reduce the level of asymmetry of information and reduce the level of capital constraint [5]. RISK variable has a significant and negative impact towards KZ on the company that listed in Kompas 100 Index during the years 2012-2014, the result is also different from the results of previous studies which stated that systematic risk has no effect on stock prices. That is because systematic risk is the type of risk that caused by company’s external environment and hard to control by the company, where it is not so considered by investors when making the investment decision [11]. COD variable has no significant effect and negative impact towards KZ on the company that listed in Kompas 100 Index during the years 2012-2014. Debt can basically hinder the company’s development, which in turn can make shareholders think twice to keep investing [15].
5. Conclusion
This paper aims to determine the effect of Corporate Social Responsibillity disclosure, Good Corporate Governance disclosure, Corporate Risk, and Cost of Debt towards Financial Constraint in companies that listed on the Kompas 100 Index for the period of 2012 – 2014. The result found that Corporate Social Responsibility Disclosure Index (CSRDI) has a positive and significant effect towards Financial Constraint (KZ) in Kompas 100 Index for period of 2012 – 2014. Good Corporate Governance Disclosure Index (GCGDI) has a positive and significant effect towards Financial Constraint (KZ) in Kompas 100 Index for period of 2012 – 2014. Corporate Risk (RISK) has a negative and significant effect towards Financial Constraint (KZ) in Kompas 100 Index for period of 2012 – 2014. Cost of Debt (COD) has a negative and unsignificant effect towards Financial Constraint (KZ) in Kompas 100 Index for period of 2012 – 2014. Variables Corporate Social Responsibility Disclosure Index (CSRDI), Good Corporate Governance Disclosure Index (GCGDI), Corporate Risk (RISK), and Cost of Debt (COD) during 3 consecutive years has an effect towards Financial Constraint (KZ) in Kompas 100 Index simultaneously.
References
- Cheng, B., Ioannou, I., & Serafeim, G. (2012). "Corporate Social Responsibility and Access toFinance". Strategic Management Journal. Vol. 35. August 2012.
- Fazzari, S.M., Hubbard, R.G., & Petersen, B.C. (1988). "Financing Constraint and Corporate Investment". Brooking Papers on Economic Activity, No. 1, 1988.
- Gujarati, D.N. (2012). Basic Econometrics (Book 2, 5th Edition). Translated by Mangunsong, R.C., Salemba Empat: Jakarta.
- Hong, H., Kubik, J.D., Scheinkman, J.A. (2011). "Financial Constraints on Corporate Goodness".NBER Working Paper Series. National Bureau of Economic Research.
- Iatridis, G.E. (2013). "Environmental Disclosure Quality: Evidence on Environmental Performance, Corporate Governance, and Value Relevance". Emerging Market Review. Elsevier ScienceDirect Journal, Vol. 14, December 2012.
- Lamont, O., Polk, C., & Saa-Requejo, J. (2001). "Financial Constraint and Stock Returns". Review ofFinancial Studies, Vol. 14, No. 2.
- Myers, S.C., Brealey, R.A., & Allen, F. (2006). Principles of Corporate Finance (Eight Edition). McGraw Hill International Edition: New York, United States of America.
- Myers, S.C., Majluf, N.S. (1984). "Corporate Financing & Investment Decision When Firm Have Information that Investor Do Not Have". Journal of Financial Economics.
- Nasution, A.F. (2008). Corellation between Internal and External Funding in Unconstrained and Constrained Firm: Consumer Goods, Cigars, and Mining Industry. Faculty of Economic University of Indonesia: Unpublished Thesis.
- Nurmala, F., & Rikumahu, B. (2012). The Effect of Shock from Lagged Value Market Return, Security Return, Market Turnover, and Security Turnover towards Differential Value, Market Return, Security Return, Market Turnover, and Security Turnover. Faculty of Economic and Business, Telkom University: Unpublished Thesis.
- Putri, P.I. (2012). The Effect of EPS, DER, Dividend Policy, and Systematic Risk towards Stock Price in Company listed in BEI: Study towards Companies that are Listed in LQ45 Index at BEI for period 2009 – 2011. Faculty of Economic and Business, Brawijaya University: Unpublished Thesis.
- Rachmawati, E. (2008). Pecking Order Theory Testing in Building Capital Structure towards Non-Financial Company that Listed in BEI for period 2001 – 2007. Faculty of Economic, University of Indonesia: Unpublished Thesis.
- Rahmawati. (2015). Tax Avoidance and Good Corporate Governance Effect towards Cost of Debt: Empirical Study in Manufacture Company that Listed in BEI for period 2009 – 2013. Faculty of Economic, Padang State University: Unpublished Article.
- Sjahrial, D. (2009). Managerial Finance (3rd Edition). Mitra Wacana Media: Jakarta.
- Wulandari, D. (2010). Analysis of the Effect of Debt, Equity, and Investment towards Company Net Profit. Faculty of Economic, Surakarta Muhammadiyah University: Unpublished Thesis.


