
American Journal of Economics, Finance and Management, Vol. 1, No. 5, October 2015 Publish Date: Aug. 23, 2015 Pages: 554-558
Tourism Developments and Its Effects on Economic Growth in Selected Countries
Fateh Habibi*
Department Economics, Faulty of Humanities and Social Sciences, University of Kurdistan, Sanandaj, Iran
Abstract
This study investigates a long-run relationship and the Granger-causality among tourism development (TD) and economic growth in sample of 85 countries classified in four groups namely Europe, Africa, Asia and American countries for annual data from 2000 to 2013. The results demonstrate that tourism development and economic growth are cointegrated; on the other hand, a long run relationship can be inferred among these two variables in four groups. The results of panel Granger Causality test show the existence of bi-directional and unidirectional causality between tourism development and economic growth in Europe and Asia countries respectively. Also, there is no causal relationship between variables in Africa countries.
Keywords
Tourism Development, Economic Growth,Panel Causality
Received: July 1, 2015
Accepted: July 15, 2015
Published online: August 19, 2015
@ 2015 The Authors. Published by American Institute of Science. This Open Access article is under the CC BY-NC license. http://creativecommons.org/licenses/by-nc/4.0/
1. Introduction
International tourism has developed rapidly for the last two decades and today tourism is one of the world’s largest and fastest-growing industries. In the 21st century, the globalization of capitalism, the movement of populations and advances in transportation and communications technology have helped develop the travel and tourism sector into one of the world’s largest (Lee, Brahmasrene, 2013). Travel and Tourism’s impact on the economic and social development of a country can be enormous; opening it up for business, trade and capital investment, creating jobs for the workforce and protecting heritage and cultural values (WTTC, 2014). Tourism stimulates other economic industries by direct, indirect and induced effects. In addition tourism is an important factor in the diffusion of technical knowledge, stimulation of research and development and the accumulation of human capital (Chou, 2013). The number of international tourists in the world will increase to 1602 million by 2020, while tourism receipts will reach some US$200 billion. The world travel and tourism council (WTTC) expects that travel and tourism continues to be one of the world’s largest industries. In 2014, travel and tourism contributed to 10% of global GDP (US$7.6 trillion) and accounted for 277 million jobs (1 in 11 jobs) in the world. Over the next ten years, this industry will bring it to 10.3% of global GDP and it is anticipated that it will account for 346 million jobs (WTTC, 2014). Also, it contributed to 12%, 9.2%, 3.4% and 2.9% of Asia, Europe, Africa and America GDP respectively. Travel and tourism industry created 30 (9.7% of total employment) million, 35 million (9% of total employment), 20 million (9.6% of total employment) and 42 million (8.6% of total employment) in Asia, Europe, Africa and America respectively.
According to the World Tourism Organization (WTO, 2013), International tourist arrivals reached 1,138 million in 2014, a 4.7% increase over the previous year. By region, Asia and the Pacific (+7%) was the best performer, while by sub-region South-East Asia, North Africa (both at +9%) and Central and Eastern Europe (+8%) topped the ranking. In general, the growth of international tourism arrivals significantly outpaces growth of economic growth (GDP). According to International monetary fund (IMF, 2014), world gross product (WGP) is 2.1 percent in 2013. According to table 1, world tourism organization (WTO) forecasts that international arrivals are expected to reach nearly 1.6 billion by the year 2020. The total tourist arrivals by region shows that by 2020 the top three receiving regions will be Europe (717 million tourists), East Asia and the Pacific (397 million) and the Americas (282 million), followed by Africa, the Middle East and South Asia. The more mature regions Europe and Americas are anticipated to show lower than average growth rates. East Asia and the Pacific, Asia, the Middle East and Africa are forecasted to record growth at rates of over 5% year, compared to the world average of 4.1%. Europe will maintain the highest share of world arrivals, although there will be a decline from 60 per cent in 1995 to 46 per cent in 2020.
It is usually believed that tourism has contributed positively to economic growth as exports have strongly triggered economic expansion. Over the past several decades, the relationship between tourism spending and economic growth for both developing and developed countries has been extensively researched. Researchers observe that the trickle-down effect of tourism development not only enhances tourism sector but also triggers overall economic growth (Lee and Chang, 2008). Therefore, tourism sector has gained tremendous academic attention as an important determinant of the economic growth. Knowledge of the causal relationship between tourism development and economic growth is of particular importance to policy-makers, as tourism policies are becoming major concerns for these countries. Thus, in the perspective of a policy-maker, the impact of international tourism on economic growth is extremely considerable.
Table 1. Tourism 2020 Vision.
| Base Year | Forecasts (Million) | Market Share (%) | Average Annual growth Rate (%) | ||
| 1995 | 2020 | 1995 | 2020 | 1995-2020 | |
| World | 565 | 1561 | 100 | 100 | 4.1 |
| Africa | 20 | 77 | 3.6 | 5.0 | 5.5 |
| Americas | 110 | 282 | 19.3 | 18.1 | 3.8 |
| East Asia and the Pacific | 81 | 397 | 14.4 | 25.4 | 6.5 |
| Europe | 336 | 717 | 59.8 | 45.9 | 3.1 |
| Middle East | 14 | 69 | 2.2 | 4.4 | 6.7 |
| South Asia | 4 | 19 | 0.7 | 1.2 | 6.2 |
Source, WTO, 2014.
Therefore, this study aims to re-examine the causal link between Tourism development and economic growth using error correction model for panel of 85 countries classified in four groups namely developed, Africa, Asia and American & Caribbean countries for annual data from 2000 to 2013. The remainder of the study is organized as follows: Section 2 briefly reviews some of the previous literature. Section 3 describes data and methodology. Empirical results are given and discussed in Section 4. Section Five presents the conclusion paper and gives some policy implication.
2. Literature Review
It is usually believed that tourism has contributed positively to economic growth. Over the past several decades, the relationship between tourism spending and economic growth for both developing and developed countries has been extensively researched. Researchers observe that the trickle-down effect of tourism development not only enhances tourism sector but also triggers overall economic growth (Lee and Chang, 2008). Economists suggest a number of reasons why tourism is a positive factor in the economic growth of a country; the reasons include increases in foreign exchange earnings, income, employment and taxes (Helpman and Krugman, 1985; Balaguer and Cantavella-Jorda, 2002; Dritsakis, 2004; Oh, 2005; Lee and Chang, 2007; Holzar, 2010; Ming, 2013). Similarly, Krueger (1980) pointed out that tourism industry contributes to economic growth by increasing efficiency via competition between domestic firms and international tourist destinations. Analyzing the relationship between tourism development and economic growth has been a popular topic in recent tourism literature (Ming, 2013).
In a single country study, Balaguer and Cantavella-Jorda (2002) examine the role of tourism in the long-term economic development in Spain. The tourism-led growth hypothesis is confirmed through cointegration and causality testing in Spain. Oh (2005) investigates the casual relation between tourism development and economic growth for Korea over the period 1975–2001. The results suggest that growth-led tourism hypothesis is confirmed through cointegration and causality tests in Korea. Katircioglu (2009) finds a long run relationship between tourism and economic growth and a unidirectional causality from economic growth to tourism for the period 1960–2005 using ARDL model approach in Cyprus. Tang (2011) investigates the casual relation between tourism development and economic growth for Malaysia based on a dataset of 12 different tourism markets from January 1995 to February 2009 using error correction model (ECM). Empirical results show that only 5 out of 12 tourism markets contribute to economic growth in the long run, and 6 out of 12 tourism markets for the short run.
In a multi-country study, Lenza et al. (2003) find a unidirectional causality from tourism to economic growth for the period 1977–1992 in 13 OECD countries. Lee and Chang (2008) investigate the casual relationship between tourism development and economic growth for OECD and non-OECD countries (including those in Asia, Latin America and Sub-Sahara Africa) over the 1990–2002 period. Evidence obtained in their study indicates that there is a unidirectional causality relationship between tourism development and economic growth in OECD countries, a bidirectional relationship in non-OECD countries and only a weak relationship in Asia. Holzner (2011) empirically analyzes the long-run relationship between tourism and economic growth over the period 1970–2007 for 134 countries. Results indicated that there is no danger of a Beach Disease Effect. On the contrary, tourism dependent countries do not face real exchange rate distortion and de-industrialization, but do have higher than average economic growth rates.
3. Methodology and Data
The test for relationship and causality between tourism development and economic growth in sample of 85 countries 85 countries classified in four groups namely Europe, Africa, Asia and American countries will be performed in three steps. First, we use recently developed panel data unit root test for the order of integration. Second, having established the order of integration in the series, we use heterogeneous panel cointegration test for the long run relationships between the variables. Finally, we apply panel based error correction model to explore the direction of causality between the two variables is then inspected using heterogeneous panel causality tests. Before panel Granger causality test we uses unit root test to check the stationarity of the time series by using different statistics proposed by Levin, Lin and Chu (2002) unit root test. The panel cointegration test, for heterogeneous panels, which are developed by Pedroni (2000) are used in this study.
The seven of Pedroni’s tests are based on the estimated residuals from the following long run model:
![]() (1)
(1)
where ![]() are the estimated residuals from the panel regression.
are the estimated residuals from the panel regression.
The null hypothesis tested is whether ![]() is unity. The seven statistics are normally distributed. The statistics can be compared to appropriate critical values, and if critical values are exceeded then the null hypothesis of no-cointegration is rejected implying that a long run relationship between the variables does exist.
is unity. The seven statistics are normally distributed. The statistics can be compared to appropriate critical values, and if critical values are exceeded then the null hypothesis of no-cointegration is rejected implying that a long run relationship between the variables does exist.
If the variables are cointegrated and panel co-integration is found, next step is to apply the Granger causality test. For this purpose a panel-based error correction model (ECM) is used to explain the long-run relationship by using the Engle and Granger (1998) procedures with a dynamic error correction: So then, the following models are estimated:
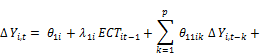
![]() (2)
(2)
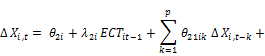
![]() (3)
(3)
where ECT is the error correction term. Tourist arrivals ax a proxy of tourism development (TOU) and GDP growth rate data were taken from the World Bank Development Indicators (World Bank, 2015). Annual time series data covering the period 2000-2013 for which data available was used.
4. Estimation Results and Discussions
Table 2. The Results of LLC Panel Unit Root Test.
| Groups | LY | LTD | ||
| Level | First Difference | Level | First Difference | |
| Europe Countries | -1.27 | -6.09* | -3.61 | -3.65* |
| Africa Countries | 2.14 | 6.13* | 2.56 | 6.37* |
| Asia Countries | 3.57 | -4.34* | -3.54 | 5.32* |
| American Countries | -2.35 | -3.34* | 1.55 | -6.45* |
Notes: * indicates rejection of the null hypothesis of a unit root at 1% level of significance.
In order to determine the presence of a unit root in a panel data setting, we have used the panel unit root test based on the Levin, Lin and Chou (LLC, 2000) on the panel data. Table 2 shows the results of the tests at level and first difference for LLC test. Our tests indicate that the null hypothesis of a panel unit root test in the level of the series can be rejected. The null of unit roots is strongly rejected at the 1% significance level for all series at their first difference. We found that all the test statistics significantly confirm that all series are integrated of order one I(1) according to the LLC test results.
The results indicate that economic growth (LY) and tourism development (LTD) are integrated of the first order, the second step in testing for the cointegration relationship between the two variables. The test for the long-run relationship between variables using Pedroni’s (2000) panel cointegration test was conducted. Table 3 reports the results of Pedroni panel cointegration test. The test results in table 3 indicate that 7 statistics reject the null hypothesis of no cointegration at the 1 percent level of significance. On the other hand, there is a long-run relationship between LY and LTD for the panel of four grope countries namely: Europe, Africa, Asia and American countries.
After confirming the long run relationship between our variables, next step we use Granger causality analysis taking into account panel error correction model. The results of Panel Granger causality tests are presented in Table 4.
Table 3. Pedroni’s Heterogeneous Panel Cointegration Test Results.
| Europe | Africa | Asia | American | |||||
| C | C+T | C | C+T | C | C+T | C | C+T | |
| Panel-v | 3.22* | -4.12* | 3.13* | 3.09* | 4.21* | -4.73* | 3.59* | -3.94* |
| Panel-ρ | 5.08* | 6.08* | 4.94* | 7.63* | 4.25* | 7.14* | 8.39* | 5.85* |
| Panel-t | -5.24* | -3.24* | 6.05* | -5.06* | 4.04* | 6.15* | 4.55* | 4.14* |
| Panel-ADF | -3.65* | 8.58* | 7.91* | -5.23* | 5.19* | 8.91* | -6.29* | 7.58* |
| Group-ρ | 6.04* | 9.04* | 3.47* | 7.03* | -5.94* | -7.07* | 4.71* | -6.54* |
| Group-t | -4.11* | -15.01* | -8.64* | -14.09* | 18.31* | 9.64* | 7.48* | 12.51* |
| Group-ADF | -6.08* | -7.48* | 13.06* | 6.06* | 11.38* | 8.06* | 9.93* | 9.32* |
Notes: All statistics are from Pedroni’s procedure (1999) which is the adjusted values can be compared to the N(0,1) distribution.Panel- v is a nonparametric variance ratio statistic. Panel-ρ and panel-t are nonparametric Phillipes-Perron and t statistics respectively. Panel-adf is a parametric statistics based on the augmented Dickey-Fuller ADF statistic. Group-ρ is analogous to the Phillipes-Perron ρ statistic. Group-t and group-adf are analogous the Phillipes-Perron t statistic and the augmented Dickey-Fuller ADF statistic respectively.
*indicates rejection of the null hypothesis of no-cointegration at 1% level of significance.
According to the results, there is bidirectional causality between tourism development and GDP in developed, which is significant in 1% level. Thus, these results suggest that tourism development and real growth gross domestic product affects mutually each other in case of developed countries. In Asia countries the unidirectional causality from tourism development to economic growth is found. Therefore, tourism development-led (TD-led Y) economic growth hypothesis is valid in for developed and Asia countries. Also results show that there is a one-way causality from economic growth to tourism development in American & Caribbean countries. Moreover, there is no causal relationship between variables in Africa countries.
Table 4. Results of Panel Granger Causality test.
| Groups | Depended | Independent Variable | ||||
| variable | ∆LY | ∆LTD | ECMt-i | |||
| Developed Countries | ∆LY | - | 6.32 (0.0043)* | -0.233(0.0135)** | ||
| ∆LTD | 4. 56(0.0041)* | - | -0.574(0.0013)* | |||
| Africa Countries | ∆LY | - | 0.08(1.7585) | -0.376(0.0057)* | ||
| ∆LTD | 1.69(0.4342) | - | -0.541(0.0354)** | |||
| Asia countries | ∆LY | - | 3.59(0.0461)** | -0.354(0.0435)** | ||
| ∆LTD | 2.93(0.1055) | - | -0.285(0.0001)* | |||
| America countries | ∆LY | - | 0.37(0. 8510) | -0.554(0.0075)* | ||
| ∆LTD | -8.41(0.0078)* | - | -0.385(0.0085)* | |||
Notes: * and ** denotes statistical significance at 1% and 5% level respectively.
5. Conclusion
The main objective of this study was to investigate the relationship and panel Ggranger causality test between tourism development (TD) and economic growth (Y) in select of 85 countries classified in four groups namely developed, Africa, Asia and American & Caribbean countries covering the period 2000- 2013. The results of panel unit root test based on Levin, Lin and Chou (LLC, 2000) imply that all the test statistics significantly confirm that all series are integrated of order one I (1). Our empirical findings based on the pedroni cointegration test show that a long-run relationship is confirmed between the two variables. The main finding of this study is the existence bidirectional causalities among tourism development and economic growth in sample of developed countries. Also, tourism development-led (TD-led Y) economic growth hypothesis is valid in for developed and Asia countries. Therefore, policies should be developed in such a way to promote and increase international tourism demand and provide and foster the development of tourism supply so that GDP can increase and result in a higher growth in Asia countries. Also growth in tourism based investments and tourism capacity could stimulate economic growth. The results indicate that is a one-way causality from economic growth to tourism development in American & Caribbean countries. Moreover, there is no causal relationship between variables in Africa countries.
References
- Balaguer J, Jorda M.C. 2002. Tourism as a long-run economic growth factor: theSpanish Case. Applied Economics, 34: 877–84.
- Chen C.F, Wei S.Z. 2009. Tourism expansion, tourism uncertainty and economicgrowth: new evidence from Taiwan and Korea. Tourism Management, 30: 812–818.
- Chou C.M. 2013. Does tourism development promote economic growth in transitioncountries? A panel data analysis. Economic Modeling 33: 226-232.
- Dritsakis N. 2004. Tourism as a long-run economic growth factor: An empirical investigation for Greece using a causality analysis. Tourism Economics, 10(3): 305–316.
- Durbarry R. 2004. Tourism and economic growth: The case of Mauritius. Tourism Economics, 10(4): 389–401.
- Engle, R.F.; Granger, C.W.J. (1987), Co-Integration and Error Correction: Representation Estimation, and Testing, Econometrica, Vol. 55, No. 2, pp. 251-276.
- Gunduz L, Hatemi-J A. (2005). Is the tourism-led growth hypothesis valid for Turkey? Applied Economics Letters, 12(8), 499–504.Holzar M. (2010). Tourism and development: the beach disease. Tourism Management, 32, 922–933.
- Jalil A, Muhammad T, Idrees, M. 2013.Tourism–growth nexus in Pakistan: Evidence from ARDL bounds tests. Economic Modeling, 35: 185-191.
- Im, K.S.; Pesaran, M.H.; Shin, Y. (2003), Testing for unit roots in heterogeneous panels, Journal of Econometrics, Vol. 115, No. 1, pp. 53-74.
- Katircioglu S. (2009). Tourism, trade, and growth: the case of Cyprus. AppliedEconomics, 41, 2741–2751.
- Kim H.J, Chen M.H and Jang S.S. 2006.Tourism expansion and economic development: the case of Taiwan. Tourism Management, 27(5): 925–933.
- Krueger A.O.1980. Trade policy as an input to development. American Economic Review, 70: 288–292.
- Lee CC, Chang C. (2008). Tourism development and economic growth: a closer look at panels. Tourism Management, 29, 180–192.
- Lee W.J and Brahmasrene 2013. Investigating the influence of tourism on economic growth and carbon emissions: Evidence from panel analysis of the European Union, Tourism management, 38: 69-76.
- Oh CO. (2005). The contribution of tourism development to economic growth in the Korean economy. Tourism Management, 26(1), 39–44.
- Pedroni, P. (1999), Critical Values for Cointegration Tests in Heterogeneous Panels with Multiple Regressors, Oxford Bulletin of Economics and Statistics, Vol. 61, No. 0, pp. 653-70.
- Tang C.F. 2011. Is the tourism-led growth hypothesis valid for Malaysia? A view from disaggregated tourism markets. International Journal of Tourism Research, 13: 97–101.
- Tang, S., Selvanathan, E.A. and Selvanathan, S. 2007. The Relationship betweenForeign Direct Investment and Tourism: Empirical Evidence from China. Tourism Economics, 13(1): 25-39.
- WTTC.http://www.wttc.org/, 2014.


