
American Journal of Economics, Finance and Management, Vol. 1, No. 5, October 2015 Publish Date: Jul. 4, 2015 Pages: 421-429
Behaviour of Nigeria Financial Market Indicators: Evidence from Descriptive Analysis
Opara Confidence C.1, *, Emenike Kalu O.2, Ani Wilson U.1
1Department of Banking and Finance, Michael Okpara University of Agriculture Umudike, Abia State, Nigeria
2Department of Banking and Finance, Rhema University, Aba Abia State, Nigeria
Abstract
This objective of this paper is to describe the behaviour of financial market indicators in Nigeria, which include stock market, interest rates, exchange rate, and inflation rates using Nigerian monthly time series data for the period of January 2000 to December 2013.The descriptive analysis of the stock returns shows a positive stock return for the NSE during the sample period. It also shows that the stock returns are negatively skewed, with peaked distribution. The descriptive analysis of the monetary policy rate shows that the average MPR is 12.6% during the study period. It further shows that the MPR and its yield are not normally distributed. The analysis of the Naira/US$ exchange rate indicate that mean rate for the sample period is N133.6. It also shows negative skewness and flat kurtosis coefficients. The analysis of the consumer price index (CPI) shows that the average monthly change in CPI is 0.9%, with a standard deviation of 1.76% for the sample period. It also shows positive skewness and peaked kurtosis coefficients. Overall, this findings of the this study suggest that the financial indicators, which include stock returns, monetary policy rates, exchange rates, and inflation rates in Nigeria, are normally distributed.
Keywords
Financial Market, Indicators, Descriptive Analysis,Nigeria
Received:April 15, 2015
Accepted: May 1, 2015
Published online: July 3, 2015
@ 2015 The Authors. Published by American Institute of Science. This Open Access article is under the CC BY-NC license. http://creativecommons.org/licenses/by-nc/4.0/
Contents
1. Introduction 2. Review of Related Literature 2.1. Overview of Stock Returns in Nigeria 2.2. Overview of Exchange Rate in Nigeria 2.3. Overview of Interest Rate in Nigeria 2.4. Overview of Inflation Rates in Nigeria 3. Methodology and Data 3.1. Data 3.2. Methodology 4. Discussions of Results 4.1. Descriptive Analysis of Stock Returns in Nigeria 4.2. Descriptive Analysis of Interest Rates in Nigeria 4.3. Descriptive Analysis of Exchange Rates in Nigeria 4.4. Descriptive Analysis of Inflation Rates in Nigeria 5. Conclusions
1. Introduction
The financial market, in all climes, provides the facilities required to move funds from surplus economic units to deficit economic units in order to produce goods and services and to make investment in new equipment and facilities so as to facilitate the growth of the economy and improve the standard of living of its citizens. Ezirim (2005) defines financial market as a market for financial claims, which are created for the purpose of facilitating transactions between the surplus and deficit economic agents of the economy. This intermediation role of financial market is generally recognised to boost the process of economic development.
The Nigeria Financial Markets, like any financial market is made up of the money market (short-term fund market) and capital market (Onoh, 2002). The money market is where short-term and liquid (or near-liquid) financial instruments are created, sourced and traded with the Central Bank of Nigeria (CBN) as the market regulator. The capital market, on the other hand, is involved in the mobilisation of long-term financial instruments; and is structured into the debt and equity markets. The debt aspect of the market is where bonds and other debt instruments are created by the Debt Management Office (DMO) with the CBN acting as the Issuing House and Registrars. While the stock market is involved in the creation of equity instruments, which are traded on the Nigerian Stock Exchange (NSE), a Self-Regulatory Organisation (SRO) with the Securities and Exchange Commission (SEC) acting as its apex regulatory body. This is complemented by the corporate debt market, which is yet to blossom despite the strides made in the public issued debt markets.
To facilitate transactions in the financial markets, financial assets are created. These financial claims evidence obligations on the part of the issuer or claims on the part of the investor. These investors however monitor financial market indicators as aid to making investment decisions. Financial indicator is defined, according to Investopedia, as statistics used to measure current conditions as well as to forecast financial or economic trends. Financial indicators are used extensively in technical analysis to predict changes in stock trends or price patterns. In fundamental analysis, financial indicators that quantify current economic and industry conditions are used to provide insight into the future profitability potential of public companies. Financial indicators include various indices, earnings reports, and financial summaries such as stock market prices, money supply changes, exchange rates changes, consumer price index (a measure for inflation), and so on . Investors’ assess the trend in these financial indicators before making investment decisions. Regulators’ are also concerned about the movements in these indicators, and academics, especially those in Business and Economics Disciplines, spend most of the career studying the behaviour of these financial variables.
The major objective of this paper is to analyse the major financial market indicators in Nigeria, which include stock market, interest rates, exchange rate, and inflation rates using descriptive statistics. The analysis will not only be useful to the investors, but also to regulators and academics. To the stock market investors’, for example, acquaintance with the analysis embodied in this seminar paper will assist them evaluate their investments in the Nigerian financial markets. Regulators will assess efficacy of their regulation using the trend of their market indicators. Academics will equally find this seminar paper useful as many models in finance require clear description of the univariate statistics. In addition, this paper contributes to literature on descriptive statistics of financial market indicators in Nigeria.
2. Review of Related Literature
2.1. Overview of Stock Returns in Nigeria
The Nigerian Stock Exchange (NSE) was established in 1960 as the Lagos Stock Exchange with 19 securities listed for trading. In December 1977 it became known as The Nigerian Stock Exchange with branches established in some of the major commercial cities of the country. As of December 31, 2013, it has about 200 listed companies with a total market capitalization of about N12.88 trillion ($80.8 billion). All listings are included in the Nigerian Stock Exchange All Shares index. The NSE is regulated by the Securities and Exchange Commission, which has the mandate of Surveillance over the exchange to forestall breaches of market rules and to deter and detect unfair manipulations and trading practices. The Exchange has an automated trading System. Data on listed companies' performances are published daily, weekly, monthly, quarterly and annually (NSE Fact Book, 2006).
The Nigerian Stock Exchange has been operating an Automated Trading System (ATS) since April 27, 1999, with dealers trading through a network of computers connected to a server. The ATS has facility for remote trading and surveillance. Consequently, many of the dealing members trade online from their offices in Lagos and from all the thirteen branches across the country. The Exchange is in the process of establishing more branches for online real time trading. Trading on The Exchange starts at 9.30 a.m. every business day and closes at 2.30 p.m. In order to encourage foreign investment into Nigeria, the government has abolished legislation preventing the flow of foreign capital into the country. This has allowed foreign brokers to enlist as dealers on the Nigerian Stock Exchange, and investors of any nationality are free to invest. Nigerian companies are also allowed multiple and cross border listings on foreign markets.
Following the deregulation of the Nigerian Capital Market in 1993, prices of new issues are determined by issuing houses and stockbrokers, while on the secondary market, prices are made by stockbrokers only. The market/quote prices, along with the All-Share Index plus NSE 30 and Sector Indices, are published daily in The Stock Exchange Daily Official List, The Nigerian Stock Exchange CAPNET (an intranet facility), newspapers, and on the stock market page of the Reuters Electronic Contributor System. Transactions on The Exchange are regulated by The Nigerian Stock Exchange, as a self-regulatory organization (SRO), and the Securities & Exchange Commission (SEC) – apex regulator, which administers the Investments & Securities Act of 1999.
The Exchange maintains an All-Share Index formulated in January 1984 (January 3, 1984 = 100). Only ordinary shares are included in the computation of the index. The index is value-weighted and is computed daily. The highest value of 66,371.20 was recorded on March 3, 2008. Also, The Exchange has introduced the NSE-30 Index, which is a sample-based capitalization-weighted index plus four sectoral indices. Similarly, five sectoral indices have been introduced to complement existing indices. These are NSE-Food/Beverages Index, (Later renamed NSE – Consumer Goods Index) NSE Banking Index, NSE Insurance Index, NSE Industrial Index and NSE Oil/Gas Index.
2.2. Overview of Exchange Rate in Nigeria
The role of exchange rates and its effects on macroeconomic performance has continued to generate interest among economists. Many scholars argue that exchange rate stability facilitates production activities and economic growth. They are also of the view that misalignment in real exchange rate could distort production activities and consequently hinders exports growth and generate macroeconomic instability (Mamta, 1999). Exchange rate policy guides investors on the best way they can strike a balance between their trading partners, and investing at home or abroad (Balogun, 2007). Mordi (2006) argued that the exchange rate movements have effects on inflation, prices incentives, fiscal viability, and competitiveness of exports, efficiency in resource allocation, international confidence and balance of payments equilibrium.
Prior to the year 1986, Nigeria practiced a fixed exchange rate, when the Naira was pegged against the British pound and later on the American dollar. However, with the collapse of the Bretton wood institutions, a flexible exchange rate policy was adopted, and the Nigerian exchange rate was allowed to float and its value relative to the American dollar determined by market forces of demand and supply. Some of the policies employed to ensure exchange rate stability included among others: Second-Tier Foreign Exchange Market (SFEM), Autonomous Foreign Exchange Market (AFEM), Inter-bank Foreign Exchange Market (IFEM), the enlarged Foreign Exchange Market (FEM), and the Dutch Auction System (DAS). It is pertinent to mention here that the inability and failure of individual policy to achieve stability in the exchange rate led to the adoption of another. Despite various efforts by government to maintain exchange rate stability (as well as avoiding its fluctuations and misalignment) in the last two decades, the Naira continued to depreciate against the American dollar. For example, the Naira appreciated against the American dollar from N0.7143 in 1970 to N0.6159 in 1975 and further to N0.5464 in 1980 (see appendix 1). However, the exchange rate depreciated throughout the 1980s. For instance, the naira depreciated from N0.6100 in 1981 to N2.0206 in 1986 and further to N8.0378 in 1990. Although the exchange rate became relatively stable in the mid-1990s, it depreciated further to N102.1052, N120.9702, and N133.5004 in 2002, 2002, 2004; respectively. Thereafter, the exchange rate appreciated to N132.147, N128.6516, and N117.968 in 2005, 2006, and 2007.
In early 2009, the Naira depreciated to N170 against the American dollar. Some have attributed the recent depreciation to the decline in the nation's foreign exchange reserves. Others argue that the activities of some market operators (speculators) and banks are responsible for the recent decline in the value of the naira. It has also been argued that the quest for higher profits in the face of the global economic meltdown is forcing some banks to engage in 'round-tripping', a situation in which banks buy foreign exchange from the Central Bank of Nigeria (CBN) and sell to parallel market operators at prices other than the official prices. These practices lead to exchange rate fluctuations and misalignment. From table 1 below, the exchange rate as at 28th January 2015 stood at N192.5 against the American dollar.
In his own view, Obadan, (2006) argued that some of the factors that led to the depreciation of the Nigerian exchange rate include weak production base, import-dependent production structure, fragile export base and weak non-oil export earnings, expansionary monetary and fiscal policies, inadequate foreign capital inflow, excess demand for foreign exchange relative to supply, fluctuations in crude oil earnings, unguided trade liberalization policy, speculative activities and sharp practices (round-tripping) of authorized dealers, over-reliance on imperfect foreign exchange market, heavy debt burden, weak balance of payments position, and capital flight.
2.3. Overview of Interest Rate in Nigeria
Interest rate refers to rates banks charge the public on loans and advances. It reflects the cost of borrowings and includes all charges and commissions levied by banks. The publication of these rates is to promote transparency in the pricing and provision of banking services. Okonjo-Iweala (2014) observes that the current regime of interest rates in the country is too high for the productive sector of the economy. She described the 20 percent lending rate being charged by commercial banks on loans obtained by industries as outrageous. The statement coming from her, the Minister of Finance and Coordinating Minister of the Economy is serious enough to call for soul searching on the part of government key functionaries. For several decades now, interest rates have always been a problem in the Nigerian economy. There has been no government, since the late 1980s when interest rates were deregulated, that has not complained about high interest rate in the country. This simply shows that high level of interest rate is detrimental to the economy.
The reality is that high interest rates coupled with the falling naira has really not been in the interest of the Nigerian economy. The benchmark interest rate in Nigeria was last recorded at 13 percent. Interest Rate in Nigeria averaged 9.70 percent from 2007 until 2014, reaching an all time high of 13 percent in November of 2014 (CBN Communiqué, 2014) and a record low of 6 percent in July of 2009. In Nigeria, interest rate decisions are taken by The Central Bank of Nigeria. The official interest rate is the Monetary Policy Rate (MPR). Recently, Nigeria’s central bank devalued the naira and raised the monetary policy rate by 100 bps to 13 percent as it tries to defend the currency hit by lower oil prices. Since the beginning of November, the naira lost more than 7 percent to the USD as falling oil prices dragged confidence on the country's assets down. The consensus is that a drop in interest rates will reduce the cost of borrowing and thus production cost. This, it is believed, will motivate domestic investment and push the economy towards growth. This will not be achieved by mere wishes. It requires conscious efforts by all economic agents in Nigeria.
2.4. Overview of Inflation Rates in Nigeria
In Nigeria, the Consumer Price Index (CPI) measures the change over time in prices of 740 goods and services consumed by people for day-to-day living. The index weights are based on expenditures of both urban and rural households in the 36 states. The most important categories in the CPI are Food and Non Alcoholic Beverages (51.8 percent of total weight); Housing, Water, Electricity, Gas and Other Fuel (16.7 percent) and Clothing and Footwear (7.7 percent). Transports account for 6.5 percent of total index and Furnishings and Household Equipment Maintenance for 5 percent. Education represents 3.9 percent of total weight, Health 3 percent, Miscellaneous Goods and Services 1.7 percent and Restaurants and Hotels 1.2 percent. Alcoholic Beverages, Tobacco and Kola account for 1.1 percent of total index, Communications for 0.7 percent and Recreation and Culture for the remaining 0.7 percent. Inflation Rate in Nigeria is reported by the National Bureau of Statistics. Accordingly, three parameters were used to measure inflation including: Gross National Product (GNP); Consumers Price Index (CPI); and Wholesale Price Index (WPI).
One central problem facing central bank of most nations including Nigeria is the issue of formulation and implementation of monetary policies. This is because of the fact that any mistake in either the formulation or implementation will result in a negative multiplier effect to every facet of economy. Low inflation rate helps to keep the rate of interest low thereby helping to spur rapid investments. Fiscal prudence and low inflation also help in controlling the movements in the foreign exchange rates. Uncertainty about the future of inflation and monetary authorities’ inability to fight it generally has negative effect on country’s macroeconomic stability.
3. Methodology and Data
3.1. Data
One of the first steps in any empirical analysis report is to describe the data set obtained for analysis. The description of data set should summarise data set such that the reader can easily see the important statistics of data set. Descriptive analysis therefore is simply the presentation of the summary of the important statistics in a data set. Descriptive analyses are employed because in most cases, it is not possible to present the data in a form that the reader will be able to quickly interpret. Generally, when writing descriptive statistics, you want to present at least one form of central tendency (or average), that is, the mean, median, or mode. In addition, you should present one form of variability, usually the standard deviation (Nwabuokei, 1986).
Descriptive statistics can be provided using two different methods. The first method summarizes your data set using a graphical technique such as a histogram, line chart, pie chart, or other graphical techniques. The second method provides a pure numerical summary of the relevant statistics in the data set such as the mean, mode, median, range, the standard deviation, skewness and kurtosis.
The data set for this study consists of the monthly time series spanning January 2000 through December 2013. The variables under considerations are the All-Share Index (ASI) of the Nigerian Stock Exchange (NSE), Monetary Policy Rate (MPR) in Nigeria, Naira/US$ Exchange Rate (ExR) in Nigeria and Consumer Price Index (CPI) in Nigeria. The variables are obtained from CBN statistical Bulletins, Annual Reports and Statement of Accounts (various years). The financial market indicator series collected from central bank of Nigeria (CBN) statistics database and transformed to monthly returns as the first log difference thus:
![]() (1)
(1)
Where: Rt is a vector of returns of the ASI, MPR, ExR and CPI respectively, Pt is a vector of closing prices at time t, Pt-1 is the previous day closing prices, and Ln is natural logarithm.
3.2. Methodology
The sample mean of the first difference of markets series calculates the expected market return. The variance measures variability of actual markets return from the expected markets return. The skewness is a measure of asymmetry of the distribution of a series around its expected return. The Kurtosis measures the peakedness or flatness of the distribution of the return series. The Jarque-Bera statistic tests whether or not the markets series under study are normally distributed. It also measures the difference between the skewness and kurtosis of a series with those from a normal distribution. The descriptive statistics of the markets return series Rt will be calculated in accordance with Tsay (2005: 9), Gujarati (2003:148), and Campbell, Lo & MacKinlay (1997:17) as follows:
Mean (![]() ) =
) = ![]() (2)
(2)
Where, ![]() is the mean or expectation of the markets return for period t,
is the mean or expectation of the markets return for period t, ![]() is the market return series, and n is the sample size. The mean or expectation of a market return measures the central location of the distribution.
is the market return series, and n is the sample size. The mean or expectation of a market return measures the central location of the distribution.
Variance (![]() ) =
) = ![]() (3)
(3)
The second central moment, denoted by ![]() , measures variability of market return in period t.
, measures variability of market return in period t.
Skewness (![]() ) =
) = ![]() (4)
(4)
Where, ![]() is the skewness of the markets return
is the skewness of the markets return ![]() is the mean of the observations, and σ3is the cube of the standard deviation. The skewness of a symmetric distribution, such as the normal distribution, is zero (0). Positive skewness means that the distribution has a long right tail and negative skewness implies that the distribution has a long left tail. Positive and negative skewness indicate non-normal distribution. The null hypothesis of no skewness in market return series will be rejected if the p-value of the skewness coefficient is less than the significance level (Spiegel & Stephens, 1999: 125; Tsay, 2005:9).
is the mean of the observations, and σ3is the cube of the standard deviation. The skewness of a symmetric distribution, such as the normal distribution, is zero (0). Positive skewness means that the distribution has a long right tail and negative skewness implies that the distribution has a long left tail. Positive and negative skewness indicate non-normal distribution. The null hypothesis of no skewness in market return series will be rejected if the p-value of the skewness coefficient is less than the significance level (Spiegel & Stephens, 1999: 125; Tsay, 2005:9).
Kurtosis (![]() ) =
) = ![]() (5)
(5)
Where, ![]() is the kurtosis of the markets return series, σ4is the fourth moment of the standard deviation. The Kurtosis of a normal is 3 and the excess kurtosis of a normal distribution is zero (0). If the kurtosis exceeds 3, the distribution is peaked (Leptokurtic) relative to the normal; if the Kurtosis is less than 3, the distribution is flat (Platykurtic) relative to normal. Excess kurtosis coefficient below or above zero is suggests non-normal distribution. The null hypothesis of no excess kurtosis will be rejected if the p-value of the excess kurtosis coefficient is less than the significance level (Spiegel & Stephens, 1999: 125; Tsay, 2005:10).
is the kurtosis of the markets return series, σ4is the fourth moment of the standard deviation. The Kurtosis of a normal is 3 and the excess kurtosis of a normal distribution is zero (0). If the kurtosis exceeds 3, the distribution is peaked (Leptokurtic) relative to the normal; if the Kurtosis is less than 3, the distribution is flat (Platykurtic) relative to normal. Excess kurtosis coefficient below or above zero is suggests non-normal distribution. The null hypothesis of no excess kurtosis will be rejected if the p-value of the excess kurtosis coefficient is less than the significance level (Spiegel & Stephens, 1999: 125; Tsay, 2005:10).
Jarque-Bera (JB) = ![]() (6)
(6)
Where, n is the sample size, S = skewness coefficient, and K = kurtosis coefficient. For a normally distributed series, S is zero and K is zero. Positive or negative JB coefficient suggests non-normality in the market return series. We will, therefore, reject the null hypothesis of zero JB statistic if the p-value is less than the significance level (see, Jarque & Bera, 1987; Tsay, 2005:10).
4. Discussions of Results
4.1. Descriptive Analysis of Stock Returns in Nigeria
Figure 1 and 2 below displays a time series graphical summary of the level and return series of the Nigerian Stock Exchange (NSE) All-Share Index (ASI) for the period January 2000 to December 2013. From Figure 1, we see the NSE ASI was trending upwards from the beginning of the sample period to first quarter of 2008, when it started falling as a result of the global financial crisis. Another major noticeable feature of the Figure is that it does not appear to be mean reverting. Figure 2, on the other hand, appear to be stationary, despite the major spikes between the 2007 to 2009 period, corresponding to the era of the global financial crisis.
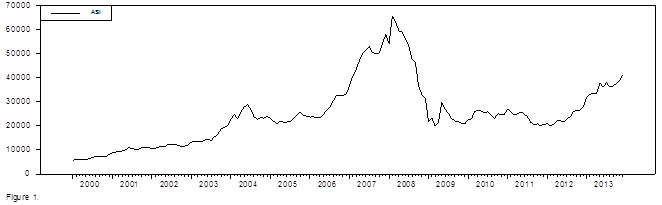
Figure 1. Time Plot of NSE All-Share Index from January 2000 - December 2013.
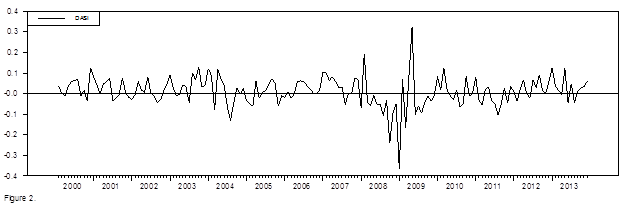
Figure 2. Time Plot of Change in NSE All-Share Index from January 2000 - December 2013.
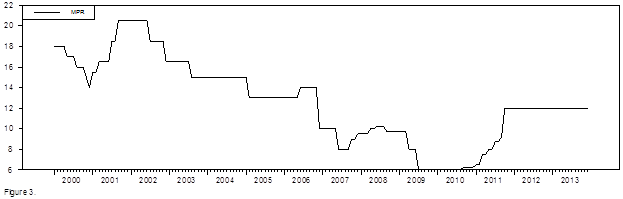
Figure 3. Time Plot of Monetary Policy Rate in Nigeria from January 2000 - December 2013.
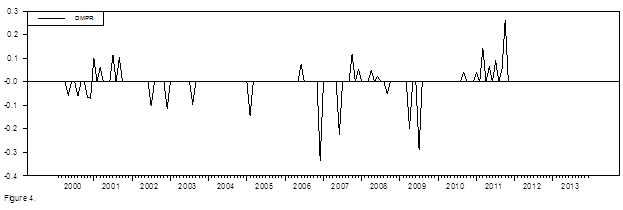
Figure 4. Time Plot of Change in Monetary Policy Rate in Nigeria from January 2000 - December 2013.
Table 1. Descriptive Statistics of the NSE Index and Returns.
| Mean | Std. Dev. | Skewness | Kurtosis | J-B Stat. | |
| ASI | 24943.86 | 13149.9 | 0.967 | 0.742 | 29.916 |
| Return | 0.011 | 0.071 | -0.609 | 6.459 | 297.091 |
Table 1 below present’s descriptive statistics of the level and return series of the NSE ASI. Notice from Table 1 that the average of the NSE ASI for the period is 24,943.9 points, with a standard deviation of 13,149.9. The return series, on the other hand, has a mean return of 1.1% for the sample period, with a standard deviation of 7.1%. The skewness and kurtosis coefficients of -0.609 and 6.459 respectively, indicating negative skewness and peaked distribution. The Jarque-Bera statistic shows that the both the level and return series of the NSE are not normally distributed.
4.2. Descriptive Analysis of Interest Rates in Nigeria
Figure 3 and 4 below shows a line graph of the level and yield series of the Monetary Policy Rates (MPR) in Nigeria for the period January 2000 to December 2013. Notice from Figure 3 that the MPR started decreasing from the 18% at inception of the sample period to 14%, before moving 20% towards the end of 2001. It started to move downwards from the last quarter of 2002 to 6%, which was the lowest for the sample period, before rising to 12% and stabilizing there for the rest of the sample period. Figure 4, on the other hand, appear to be mean reverting, but with very spikes. The spikes indicate changes monetary policy.
Table 2. Descriptive Statistics of the Interest Rate in Nigeria.
| Mean | Std. Dev. | Skewness | Kurtosis | J-B Stat. | |
| MPR | 12.620 | 4.045 | 0.081 | -0.753 | 4.159 |
| Yield | -0.0024 | 0.056 | -1.928 | 15.456 | 1765.97 |
Table 2 below presents descriptive statistics of the level and yield series of the Monetary Policy Rate. Observe from Table 2 that the mean MPR for the sample period is 12.6%, with a standard deviation of 4%. The skewness and kurtosis coefficients for the MPR are 0.081 and -0.8 respectively. These indicate positive skewness and flat distribution. The Jarque-Bera statistic also shows that the both the level and yield series of the MPR are not normally distributed.
4.3. Descriptive Analysis of Exchange Rates in Nigeria
Figure 5 and 6 below shows a time series graph of the level and first difference series of the Naira/US$ exchange rates in Nigeria for the January 2000 to December 2013 sample period. As can be seen in Figure 5, Naira/US$ was trending upward from the below N100 in the year 2000 to N130 in January 2004, before falling as a result of the global financial crisis. From first quarter of 2009, the exchange rate started rising to N150.
Figure 6, on the other hand, show that the change in Naira/US$ exchange rate hovers around the mean except the spike in the first quarter of 2009.
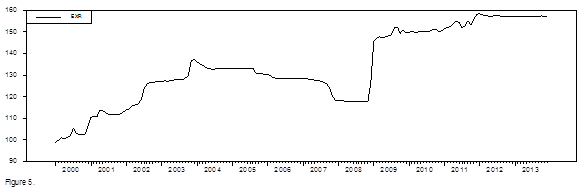
Figure 5. Time Plot of Naira/US Dollar Exchange Rate in Nigeria from January 2000 - December 2013.
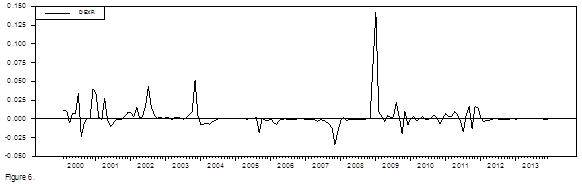
Figure 6. Time Plot of Change in Naira/US Dollar Exchange Rate in Nigeria from January 2000 - December 2013.
Table 3. Descriptive Statistics of the Naira/US$ Exchange Rate in Nigeria
| Mean | Std. Dev. | Skewness | Kurtosis | J-B Stat. | |
| ExR | 133.63 | 17.119 | -0.088 | -1.049 | 7.928 |
| Change | 0.0027 | 0.0156 | 5.173 | 40.467 | 12140.01 |
Table 3 below displays descriptive statistics of the level and change series of the Nair/US$. Notice from Table 4 that the average Naira/US$ exchange rate for the sample period is N133.6, with a standard deviation of 17. Table 3 also shows negative skewness and negative kurtosis coefficients, thus suggest negative skewness and flat distribution. The Jarque-Bera statistic also shows that the both the level and change series of the Naira/US$ are not normally distributed.
4.4. Descriptive Analysis of Inflation Rates in Nigeria
Figure 7 and 8 below displays a time series graphical summary of the level and change series of the consumer price index (CPI) for the January 2000 to December 2013 period. From Figure 7, we see the CPI was trending upwards from the beginning of the sample period to first quarter of 2013. Another major noticeable feature of the Figure is that it does not appear to be mean reverting.
Figure 8, on the other hand, appear to be stationary, despite the major spikes during the 2010 period.
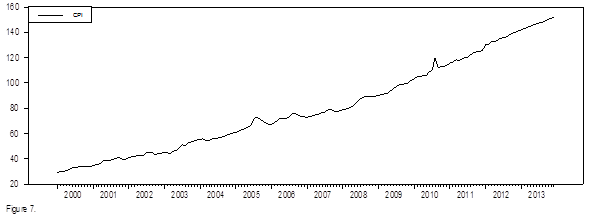
Figure 7. Time Plot of Consumer Price Index in Nigeria from January 2000 - December 2013.
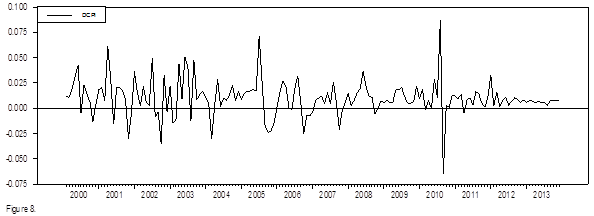
Figure 8. Time Plot of Inflation Rate in Nigeria from January 2000 - December 2013.
Table 4 below show descriptive statistics of the level and change series of the consumer price index in Nigeria for the January 2000 to December 2013. Notice from Table 4 that the average monthly change in CPI is 0.9%, with a standard deviation of 1.76% for the sample period. Table 4 also shows positive skewness and peaked kurtosis coefficients, thus suggest positive skewness and peaked distribution. The Jarque-Bera statistic also shows that the both the level and change series of the CPI are not normally distributed.
Table 4. Descriptive Statistics of the Inflation Rate in Nigeria.
| Mean | Std. Dev. | Skewness | Kurtosis | J-B Stat. | |
| CPI | 80.647 | 35.565 | 0.427 | -0.974 | 11.773 |
| Return | 0.0098 | 0.0176 | 0.3540 | 4.4962 | 144.158 |
5. Conclusions
The objective of this paper is to analyse the major financial market indicators in Nigeria, which include stock market, interest rates, exchange rate, and inflation rates using descriptive statistics for the January 2000 to December 2013 sample period. The descriptive analysis of the stock returns shows a positive stock return for the NSE during the sample period. It also shows that the stock returns are negatively skewed, with peaked distribution. The descriptive analysis of the monetary policy rate shows that the average MPR is 12.6% during the study period, with a standard deviation of 4%. It further shows that the MPR and its yield are not normally distributed. The analysis of the Naira/US$ exchange rate indicate that mean rate for the sample period is N133.6. It also shows negative skewness and flat kurtosis coefficients. The analysis of the consumer price index (CPI) shows that the average monthly change in CPI is 0.9%, with a standard deviation of 1.76% for the sample period. It also shows positive skewness and peaked kurtosis coefficients. Overall, the results of this study suggests that the financial indicators, which include stock returns, monetary policy rates, exchange rates, and inflation rates in Nigeria, are normally distributed. We therefore recommend that researchers that are studying financial markets should start by describing their variables before delving into the inferential analysis.
References
- Adetifa, S. B. (2005). Corporate Finance and Investment Strategy. Lagos Nigeria:CIBN Press Ltd.
- Anyanwu, J.C. (1993). Monetary Economic Theory, Practice and Institutions. Onitsha Nigeria: Hybrid Publishers Ltd.
- Balogun, E. D. (2007). Effects of Exchange Rate Policy on Bilateral Exports Trade of WAMZ Countries. Munich Personal RePec Archive (MPRA), Paper No. 6234.
- Bassey, U. (2014). No immediate plan to cut Nigeria’s interest rates.http://www.premiumtimesng.com/business/163017-immediate-plan-cut-nigerias- interest-rates-says-cbn.html.
- Campbell, J.Y.; Lo, A. W. & Mackinlay, A.C. (1997). The econometrics of financial markets. New Jersey: Princeton University Press Princeton.
- Central Bank of Nigeria (2014), Communiqué on Monetary Policy Rate.
- David, F., & Konstantin,M. (2008). Determinants of the Equilibrium Exchange Rate for South Africa's Manufacturing Sector and Implications for Competitiveness. Working Paper of the National Treasury of South Africa. Available online:http://www.treasury.gov.za.
- Ezirim, C. B. (2005). Finance Dynamics: Principles, Techniques and Applications. Port Harcourt: Markowitz Centre for Research & Development.
- Gujarati, D.N. (2003). Basic Econometrics (4th Ed). Delhi: McGraw Hill Inc. Jhingan, M. L (2002). Macroeconomic Theory (10th Ed), New Delhi:Vrinda Publications Ltd.
- Mamta B. C. (1999). The Determinants of Real Exchange Rate: Theory and Evidence from Papua Guinea. Asia Pacific School of Economics and Management Working Paper 99-2.
- Mordi, N. O. (2006). "Challenges of Exchange Rate Volatility in Economic Management in Nigeria in the Dynamics of Exchange Rate in Nigeria. Central Bank of Nigeria Bullion, 30 ( 3), 17-25.
- NSE (2006). The Nigerian Stock Exchange FactBook.Nwabuokei, P.O. (1983). Fundamentals of Statistics. Enugu: Koruna Books.
- Obadan, M. I. (2006).Overview of Exchange Rate Management in Nigeria from 1986 to Date in the Dynamics of Exchange Rate in Nigeria. Central Bank of Nigeria Bullion, 30 (3), 1-9.
- Okechukwu, N. (2014). Inflation Rates in Nigeria. Retrieved fromhttp://www.punchng.com/news/nigerias-inflation-rate-falls-to-
- Onoh, J. K. (2002). Dynamics of money, banking & finance in Nigeria: An emerging market. Aba: Astra Meridian Publishers.
- The East Asian Miracle. (1993). Economic Growth and Public policy, the World Bank fromhttp://www.tradingeconomics.com.
- Tsay, R. S. (2005). Analysis of financial time series (2nd Ed). Hoboken New Jersey: John Wiley & Sons Inc.


