
American Journal of Economics, Finance and Management, Vol. 1, No. 4, August 2015 Publish Date: Jun. 2, 2015 Pages: 287-292
The Impact of Agricultural Import Tariffs and Non-Tariffs Barriers on Welfare in Iran
Ahmad Jafari Samimi1, *, Ghasem Norouzi2, Mojtaba Ehsani1
1Department of Economics, University of Mazandaran, Babolsar, Iran
2Department of Agricultural Economics, Qaemshahr Branch, Islamic Azad University, Qaemshahr, Iran
Abstract
This study examines the welfare impacts of import tariffs and non-tariff barriers (NTBs) imposed on tradable agricultural products in Iran during period 1981-2011. The results show that NTBs (especially Core NTBs such as import quota, technical regulations, as well as monopolistic measures and agricultural domestic support) had a prohibitive effect on imports and domestic consumer's welfare. Therefore, the reduction of NTBs or their complete elimination would improve consumer's welfare in Iran. The estimated results of trade restrictiveness index indicated that the optimal tariff to keep welfare in accordance with the TRI index is 12.8%. Moreover, we found that three products of rice, sugar and banana are heavily protected and their trade’s regine have signs of making deviation and limitation of trade and social welfare decrease.
Keywords
Agriculture, Tariff, Non-Tariff Barriers, Import, Welfare
Received: April 9, 2015
Accepted: April 25, 2015
Published online: May 28, 2015
@ 2015 The Authors. Published by American Institute of Science. This Open Access article is under the CC BY-NC license. http://creativecommons.org/licenses/by-nc/4.0/
1. Introduction
Countries employ a variety of tools for limiting free trade: from tariffs to import quotas to voluntary export restraint agreements, and all the way to invisible, sometimes strange methods of discouraging a foreign producer of a good from selling in their country. Quotas and the latter group of barriers to free trade are called non-tariff barriers or NTBs, in the language of GATT. Many of these policies are now subject to important disciplines under the 1994 GATT agreement that is administered by the World Trade Organization.
Tariffs, which are taxes on imports of commodities into a country or region, are among the oldest forms of government intervention in economic activity. They are implemented for two clear economic purposes. First, they provide revenue for the government. Second, they improve economic returns to firms and suppliers of resources to domestic industry that face competition from foreign imports (Yu et al, 2009). Tariffs are widely used to protect domestic producers’ incomes from foreign competition. This protection comes at an economic cost to domestic consumers who pay higher prices for import competing goods and to the economy as a whole through the inefficient allocation of resources to the import competing domestic industry. Therefore, since 1948, when average tariffs on manufactured goods exceeded 30 percent in most developed economies, those economies have sought to reduce tariffs on manufactured goods through several rounds of negotiations under the general agreement on tariffs and trade (Bounthone, 2011). When tariffs paied into insignificance, countries resorted to a form of administered protection known as Non-Tariff barriers (NTBs) - Quantitative restrictions, tariff quota, voluntary export restraints, orderly marketing arrangements, export subsidy, export credit subsidy, government procurement, import licensing, antidumping/countervailing duties, technical barriers to trade, to name a few. It was a return to protectionism harder and more expensive than in the 1950’s and 1960’s (Andriamanajara, 2004).
Economists generally agree that trade barriers are detrimental to regional trade. NTBs and tariffs diminish the potential benefits that could be derived from the trade preferences offered through regional trading arrangements. These trade preference benefits include better access to partner country markets, increased export volumes and prices, improved economic welfare, more jobs, and more rapid economic growth. Moreover, they are a serious impediment to the growth of intra-regional trade and the associated benefits. So, it is generally accepted that these obstacles include both tariffs and non-tariff barriers lead to trade distortion with concomitant losses in welfare. However, the cost of these barriers, their impacts on regional trade and their welfare impacts are not well understood (Toshimitsu, 2005).
In Iran, The easiest way to measure a country’s formal trade barriers is the import-weighted average tariff rate, which can be readily calculated by dividing the revenue from import duties by the value of total imports. Unfortunately, this measure has four critical shortcomings that make it a poor indicator of the tariff’s height and static welfare cost. First, the average tariff is downward biased: goods that are subject to high tariffs receive a low weight in the index, and goods that are subject to prohibitive tariffs will not be represented at all. Second, the average tariff understates the welfare cost of a given tariff structure because it ignores the dispersion in import duties across goods. Third, the average tariff lacks any economic interpretation: an average tariff of 50 percent may or may not restrict trade more (or generate deadweight losses larger) than an average tariff of 25 percent. Fourth, the average tariff will not reflect the impact of non-tariff barriers, such as import quotas, in restricting trade.
Given these problems, economists developed several indices of trade barriers that have a well-defined theoretical basis in terms of economic welfare and the volume of trade. The trade restrictiveness index (TRI) refers to the uniform tariff which, if applied to all goods, would yield the same welfare level as the existing tariff structure. The TRI has several advantages over the average tariff: it has a clear interpretation in terms of economic welfare and also summarizes in a single metric the effects of varying import duties in a way that the average tariff cannot. The TRI index measures the distortions imposed by each country's trade policies on its own welfare (Anderson and Neary, 2005).
This study examines the welfare impacts of import tariffs and non-tariff barriers imposed on tradable agricultural products in Iran through trade restrictiveness index (TRI) over the period 1981 to 2011. In 1990’s early, (Feenstra, 1995) developed a simplified partial-equilibrium version of the TRI that can be calculated without resorting to complex general equilibrium simulations. Kee, Nicita and Olarreaga (2008), Irwin (2009) and Yu (2009) have used this index to evaluate the trade restrictiveness and its impact on welfare and trade.
2. The Theoretical Analysis of Trade Policies
One important question is to consider why, with all the research including both analytical and empirical evidence pointing towards benefits of free trade, countries still hold on to their anti-free trade positions? Specifically, why do so many countries still maintain the policy of import tariffs? The set of arguments in favor of tariffs produced by policy makers reads as follows (Takeshi, 2006):
1. Tariffs provide an important source of revenues for the government.
2. The change of policy from limited to free trade hurts the income of particular groups within the economy and is an unacceptable policy choice.
3. There is a form of "market failure" in the form of an externality in the import competing industry. In other words, the positive externality of producing more of the good domestically outweighs the negative effects of a tariff imposed to protect domestic production. This is essentially a type of "infant industry" argument for protection of a domestic industry.
4. Tariffs are used as a "retaliatory" tool against tariffs imposed by a trade partner or an act of "dumping" by a foreign firm. The latter are called anti-dumping duties.
5. Tariffs are part of a "strategic trade policy" by some countries. This entails government involvement with promotion of sale of product or service by a large firm in an international oligopoly (or some form of imperfectly competitive market where price and production follow a strategic or game type behavior).
This section discusses the probable market and welfare effects of tariffs imposed on agricultural imports in supply and demand equilibrium model. It illustrates the manner in which a market seeks equilibrium between supply and demand when an economic distortion (e.g., an import tariff) disturbs the existing equilibrium. As the graph 1 indicates, at the free trade world price, PW (or domestic price Pd), the country does not supply enough of the good to satisfy domestic demand QD>QS, and must import QD - QS. Now suppose that the government decides to impose a specific (percentage tax per unit value) tariff on import. The tariff raises the domestic price from Pd to PT (which is equal pd(1 +t)) which results in a theoretical expansion of domestic production from Qs to Qst, along with a reduction of demand from QD to Qdt. Consequently imposing tariff reduces imports to Qdt-Qst. As showed in the graph text, the economic impacts are: producers gain (amount A), consumers lose (amounts A+B+C+D), the government gains revenues (amount C, less the cost of administering the tariff), and net welfare loss (amounts B+D). Therefore, the overall welfare effect of the tariff is negative (Kee, Nicita and Olarreaga, 2008).
How does this increase in price affect the overall level of welfare? To answer this question, note that the import tariff has lowered consumer surplus, has partially enhanced the level of producer surplus, and has brought some revenues to the government. The net change in welfare is indeed the sum of all these losses and gains.
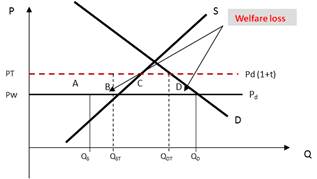
Figure (1). The impact of tariff on welfare
3. Materials and Method
With regard to trade restrictiveness index summarize the impact of all trade barriers (nominal tariff line and non- tariff barriers) in uniform tariff-equivalent thus we requires first to bring all types of trade policy instruments (tariffs and non tariffs barriers) into a common metric. Then, based on the partial equilibrium model and Following Feenstra's method, we calculate the TRI index in a similar method.
To obtain the ad-valorem equivalents (AVEs) of non-tariff barriers following Kee’s approach (2008), we first estimate the quantity-impact of NTBs on imports using log-linear model of import demand with assuming constant return technologies. Then we convert the quantity impact of NTBs on imports into a tariff equivalent based on import demand elasticity. Log-linear model used and adopted in this study is the following ( Kee et al, 2008):
![]() (1)
(1)
Where mi is the import volume of good i, GDP is real value added of agricultural sector, Di is a dummy variable indicating the presence of a core non-tariff such as technical barriers, import quota system and import license ( D=1 when these barriers imposed), NPRi is agricultural domestic support (nominal protection rate), ti is the nominal tariff imposed on good i in country and piw is domestic equivalent of world price of good i . In this paper, nominal protection rate (NPR) which is indicator of agricultural domestic support obtains the following:
![]()
Where pd is domestic price of good i, pc is CIF price of traded good i in country and E is formal exchange rate in country. In equation 1, ![]() and
and ![]() are the coefficients that captures the quantity impact of NTB on imports and
are the coefficients that captures the quantity impact of NTB on imports and ![]() is import demand elasticity. This model allows for both tariff and NTB to deter trade with effects that vary by importing country and good. The overall level of protection imposed on imports of good is given by ( Kee etal, 2008):
is import demand elasticity. This model allows for both tariff and NTB to deter trade with effects that vary by importing country and good. The overall level of protection imposed on imports of good is given by ( Kee etal, 2008):
![]() (2)
(2)
Where Ti is the overall level of protection that country imposes on imports of good i, ti and AVEi are nominal tariff and ad-valorem non tariff imposed on good i respectively. To make NTBs comparable with ad-valorem tariffs, one needs to transform the quantity impact into price-equivalents. This is referred to as an AVE of NTB, and is defined as follows (Kee etal, 2008):
![]() (3)
(3)
According to equations 1 and 3and with respect to non-tariff parameters of Di and NPRi:
![]() (4)
(4)
![]() (5)
(5)
Where AVEiD and AVEiNPR are the ad-valorem equivalents of core NTB and domestic support imposed on good i respectively. Solving equations 3 and 4 for two NTB, we obtain tariff equivalent of non-tariff barriers as follows:
![]() (6)
(6)
![]() (7)
(7)
Overall AVE for each good i is obtained by simply adding the two AVE of NTB components, and is denoted AVEi:
![]() (8)
(8)
As earlier mentioned, The TRI summarizes the restrictions imposed by each country's trade policies on its own welfare. It answers the following question: What is the uniform tariff that if applied to imports instead of the current structure of protection would fix welfare at its current level? The TRI is (implicitly) defined by (Anderson and Neary, 2005):
![]() (9)
(9)
Where Wn,i is the welfare associated with imports of good n in country i and W0i is the current level of aggregate welfare in country i given its protection structure. It is well known that in a partial equilibrium setup a second-order linear approximation to the welfare cost is given by (Anderson and Neary, 2005):
![]() (10)
(10)
Thus, the extent of welfare loss increases with the elasticity of import demand, imports, and the squared of the level of protection (overall tariff). Totally differentiating equation 9, using equation10 and solving for TRI yields (Kee etal, 2008):
 i=1… n (11)
Where mi is import volume of product i, ![]() is import demand elasticity of product i and Ti is overall tariff imposed on product i. With respect to the TRI index is the uniform tariff would fix welfare at its current level and it is iso-welfare measure, Therefore, we can recognize the effect of current trading policies imposed on agricultural products on the welfare level through this index.
is import demand elasticity of product i and Ti is overall tariff imposed on product i. With respect to the TRI index is the uniform tariff would fix welfare at its current level and it is iso-welfare measure, Therefore, we can recognize the effect of current trading policies imposed on agricultural products on the welfare level through this index.
In this paper, we study Trade restrictiveness of agricultural policies in Iran for the nine major agricultural product including wheat, rice, barely, maize, soybean, meat (beef meat), soybean oil, sugar and banana. These products own more 70 percent of the value of Iranian agricultural imports among 2006 to 2011. Data of this paper are annual data for during 1981-2011 periods which there are obtained from different sources. Tariff data is collected from tariff schedule were presented in the annually import and export rules. Exchange rate, Price index and real GDP data are available in central bank database of Iran. Domestic price of agricultural products are obtained from agriculture ministry of Iran. World price and trade data of agricultural products are obtained from FAO's statistical database.
4. Discussion of Results
This section reports the results of estimating advalorem equivalent of non-tariffs (especially Core NTBs such as import quota, technical regulations, as well as monopolistic measures and agricultural domestic support) and trade restrictiveness index (TRI) and their impacts on welfare. For this purpose, first, the import demand functions of agricultural products were estimated separately using ordinary least squares method. The results of estimation are shown in table 1 in appendix. As seen from the estimation results many of the regression coefficients especially those of rice, sugar and soybean are not statistically significant even at a 10 percent level. This might be due to the so-called source differentiation for the imported demand of these products. In other words, the quality of these crops imported demand varies and depends on the source country. Also, the simultaneity bias caused by using separated single equation demand for imported crops and ignoring the cross relations between domestic and imported demands might be consider as another reason to witness many insignificant coefficients. Therefore, it is suggested that future studies use a more sophisticated models such as the so-called Almost Ideal demand system (AIDS) models to overcome the shortcomings of the simple naïve models. This leads us to conclude that the present papers findings should be treated with caution.
Given results of the estimated import demand functions for agricultural products, the AVEs of NTBs for selected products estimated and the results are presented in table 1. The results shows the average AVE of NTBs for 9 group products are: -2.87% for wheat, 1.12% for rice, 1.86% for barely, 1.16% for maize, 1.73% for soybean, 1.61% for meat, ./68% for oil, 1.62%for sugar and 5.63% for banana. Based on the results reported in table 1 we can also conclude AVEs of all products are positive except wheat. It can be concluded that applying non tariff limitations for these products had a protective effect for producers in Iran. However, these barriers have the decreasing effect on domestic consumer's welfare. However, these barriers have the decreasing effect on domestic consumer's welfare. Because, when non-tariff barriers has imposed on agricultural products it decrease and restrict import value which results in raise of domestic price along with a reduction of demand by consumers. Consequently, imposing tariff or NTBs (As showed in the graph1), have lowered consumer surplus but have partially enhanced the level of producer surplus. Therefore, the overall welfare effect of the tariff is negative.
Considering the results of table (3) and based on equation (11) we compute trade restrictiveness index (TRI) for agriculture sector of Iran. As already mentioned, the trade restrictiveness index refers to the uniform tariff which, if applied to all goods, would yield the same welfare level as the existing tariff structure (iso-welfare measure). It answers the following question: What is the uniform tariff that if applied to imports instead of the current structure of protection would leave home welfare at its current level? So, if the current nominal tariff level of a product was less than optimum tariff (or TRI amount) then we can conclude that trade policy will reduce the welfare. Table 2 indicates the estimated results of TRI index and the prohibitive impact of trade tariff regime on Welfare in agriculture sector of Iran. As this tables show, optimal tariff to keep welfare in accordance with the TRI index is 12.8%. Moreover, we found that three products of rice, sugar and banana are heavily protected and their trade’s regime have the prohibitive role on welfare and import. This can lead to decrease in domestic welfare level as well as country’s trade volume with trading partners.
Table (1). AVE of NTBs for the selected products and their impacts
| Welfare effect | Trade support | AVE of NTBs (%) | Own Price elasticity of demand | product |
| + | no | -2.87 | -.21 | wheat |
| - | Yes=protective | 1.12 | -.36 | rice |
| - | Yes=protective | 1.86 | -.38 | barely |
| - | Yes=protective | 1.16 | -.41 | maize |
| - | Yes=protective | 1.73 | -.12 | soybean |
| - | Yes=protective | 1.61 | -1.02 | beef meat |
| - | Yes=protective | .68 | -.33 | oil |
| - | Yes=protective | 1.62 | -.26 | sugar |
| - | Yes=protective | 5.63 | -.62 | banana |
Table source: author’s calculations
Table (2). The influence of agricultural trade policies on welfare in Iran
| change in welfare | Condition analyze | Average TRI index (%) | Current tariff line (%) | Product |
| + | TRI>nominal tariff | 12.80 | ./9 | wheat |
| - | TRI | 12.80 | 22.6 | rice |
| + | TRI>nominal tariff | 12.80 | 6.2 | barely |
| + | TRI>nominal tariff | 12.80 | 6.5 | maize |
| + | TRI>nominal tariff | 12.80 | 8.2 | soybean |
| + | TRI>nominal tariff | 12.80 | 7.6 | meat |
| + | TRI>nominal tariff | 12.80 | 10.5 | oil |
| - | TRI | 12.80 | 24.6 | sugar |
| - | TRI | 12.80 | 65.3 | banana |
Table source: author’s calculations
5. Summary and Conclusions
This study examines the welfare impacts of import tariffs and non-tariff barriers imposed on tradable agricultural products in Iran through import demand function and trade restrictiveness index (TRI). Findings of estimation of AVE of NTBs indicated that except wheat, tariff equivalent of other products is positive and shows that applying non tariff limitations for these products had a protective effect. It will mean that the imposing these barriers on tradable agricultural products in Iran had a prohibitive effect on its imports and domestic consumer's welfare. Therefore, the reduction of NTBs (especially Core NTBs such as import quota, technical regulations, as well as monopolistic measures and agricultural domestic support) or their complete elimination would improve consumer's welfare in Ian.
With respect to the optimal tariff obtained from TRI index as the base tariff equal to 12.8% and the average rate of nominal tariff of the agricultural products under study in the period 1981-2011, we can conclude that in the present regime of tariff the three products of rice, sugar and banana have welfare preventing effect on the economy of the country and considering the average level of nominal tariff, these products, compared with optimum tariff, have a high level of support. Considering that the tariff of the above mentioned products have signs of making deviation and limitation of trade and social costs (social welfare decrease) it is suggested that something be done to decrease the nominal tariff of these products to the level of optimum tariff. With respect to the inhibiting effect of tariff and non tariff barriers, it is necessary to adjust Iran’s agricultural trade tariff regime in order to bridge the gap between the current structure of protection and optimum import duties. Undoubtedly, considering the way of making free trade and the membership of Iran in the World Trade organization, determining the level of optimum tariff, besides minimizing the negative economical and social effects can play an important role as a political tool in trade.
Appendix
Table (3). The results of the estimations of import demand functions for 9 agricultural products
| F-statistic | D.W | R2 | Ar (1) | LnPd | lnNPR | D | ln GDP | intercept | variable |
| 37.8 | 2.19 | .87 | - | -.21 (-3.65) | -.41 (-2.41) | 2.94 (10.06) | -.703 (-2.56) | 25.07 (2.26)* | wheat |
| 3.87 | 2.13 | .49 | -.32 (-1.49) | -.36 (-5.31) | -.17 (-2.85) | .0001 (.0004) | 1.21 (4.37) | 8.87 (2.14) | rice |
| 3.34 | 1.90 | .38 | - | -.38 (-2.86) | -.47 (-1.99) | -.34 (-3.75) | -4.49 (-2.60) | 61.52 (4.1) | barely |
| 12.65 | 1.91 | .76 | -.28 (-1.22) | -.41 (-3.18) | .17 (9.16) | -.57 (-3.81) | -.26 (-3.36) | 22.02 (3.45) | maize |
| 20.65 | 2.02 | .83 | -.10 (-.46) | -.88 (-2.78) | .096 (.54) | -.29 (-4.82) | .50 (5.62) | 12.83 (2.83) | soybean |
| 7.27 | 1.97 | .64 | -.46 (-2.06) | -1.02 (-2.51) | -1.33 (-6.06) | -1.75 (-5.55) | -.63 (-3.60) | 37.98 (3.96) | meat |
| 2.73 | 2.07 | .41 | .030 (.14) | -.33 (5.01) | .23 (1.94) | -.21 (-3.30) | .29 (2.31) | 15.77 (1.99) | oil |
| 7.28 | 1.99 | .44 | .38 (1.87) | -.26 (-6.21) | -.40 (-2.83) | .095 (3.34) | 1.29 (4.66) | 8.67 (2.51) | sugar |
| 36.05 | 1.93 | .90 | .53 (2.23) | -.66 (-4.39) | .11 (6.32) | -.14 (-5.24) | 4.39 (2.94) | 29.33 (2.07) | banana |
References
- Anderson, J., P. Neary, 2005. "the Mercantilist Index of Trade Policy". International Economic Review, 44(2): 627-649.
- Andriamanajara, S., J.M. Dean., R. Feinberg., M.J. Ferrantino., R. Ludema and M. Tsigas, 2004. "Office of Economics Working Paper", U.S. International Trade Commission.
- Bounthone, S, 2011. "The Impact of Trade Policy Reforms on Social Welfare Inequality and Poverty". Lao Trade Research Digest, V.2, 65-84.
- Central Bank of Islamic Republic of Iran, 2007. "Price Index of Goods and Services of Iran", 1981-2007.
- Central Bank of Islamic Republic of Iran, 2008. "Economic Reports of Central Bank", 1981-2007.
- Commerce Ministry of Iran, 2008 "Import and Export Rules Schedules of Iran", 1981-2007.
- Feenstra, R, 1995. "Estimating the Effects of Trade Policy". Handbook of International Economics., v.3, Amsterdam. March .
- Food and Agricultural Organization, 2008. "Trade and Price Statistics".www.fao.org/statistics. 1981-2007.
- Irwin. D, 2009. "Trade Restrictiveness and Deadweight Losses from U.S. Tariffs, 1859-1961". National Bureau of Economic Search, Cambridge University PRESS.
- Kee, H.L., A. Nicita and M. Olarreaga, 2008. "Estimating Trade Restrictiveness Indices". World Bank. September .
- Takeshi, I, (2006). "Welfare Effects of Import Tariff and Export Subsidy Games". Japan and the World Economy, V.5, 73-90.
- Toshimitsu, T, 2005. "Effect of a Tariff on the Environment and Welfare: The Case of an Environmentally Differentiated Duopoly in a Green Market". School of Economics, Kawansei Gahuin University, Japan.
- United States Agency for International Development, 2011. "Market and welfare impacts of foodstuffs imports tariff in Iraq".
- Yu, E., E.Wailes and E.Chavez, 2009. "A Quantitative Analysis of Trade Policy Responses to High Agriculture Commodity Prices". Agricultural Economics Conference. Beijing, China, August 16-22.


