
American Journal of Economics, Finance and Management, Vol. 1, No. 4, August 2015 Publish Date: May 28, 2015 Pages: 250-270
Whether It is Possible to Increase of the Investment Efficiency, Increasing Tax on Profit Rate
P. N. Brusov1, *, T. V. Filatova2, N. P. Orekhova3, I. K. Shevchenko4, A. Y. Arkhipov5, V. L. Kulik6
1Applied Mathematics Department, Financial University under the Government of Russian Federation, Moscow, Russia
2GMM Faculty, Financial University under the Government of Russian Federation, Moscow, Russia
3Investment and Taxation Laboratory, Research Consortium of Universities of the South of Russia, High School of Business, Southern Federal University, Rostov-on-Don, Russia
4 Vice-Rector for Research and Innovation Projects, Southern Federal University, Rostov-on-Don, Russia
5High School of Business, Southern Federal University, Rostov-on-Don, Russia
6Management Department, Financial University under the Government of Russian Federation, Moscow, Russia
Abstract
Within modern theory of capital cost and capital structure by Brusov-Filatova-Orekhova (BFO) theory and created within this theory modern investment models influence of growth of tax on profit rate on the efficiency of the investment is investigated. It has been shown that for long term investment projects, as well as for arbitrary duration projects the growth of tax on profit rate changes the nature of the NPV dependence on leverage at some value t*: there is a transition from diminishing function NPV(L) when t<t* to growing function NPV(L). An abnormal influence of growth of tax on profit rate on the efficiency of the investment projects has been discovered.
Keywords
Received: April 7, 2015
Accepted: April 27, 2015
Published online: May 27, 2015
@ 2015 The Authors. Published by American Institute of Science. This Open Access article is under the CC BY-NC license. http://creativecommons.org/licenses/by-nc/4.0/
Contents
1. Introduction 2. Dependence of NPV on Leverage Level L at Fixed Levels of Tax on Profit Rates T 2.1. The Effectiveness of the Investment Project from the Perspective of the Equity Holders Only 2.2. Perpetuity Limit 2.3. The Effectiveness of the Investment Project from the Perspective of the Equity and Debt Holders 3. Dependence of NPV on Tax on Profit Rates at Fixed Leverage Levels L 3.1. The Effectiveness of the Investment Project from the Perspective of the Equity Holders only 3.2. Perpetuity Limit 3.3. The Effectiveness of the Investment Project from the Perspective of the Equity and Debt Holders 4. Conclusion
1. Introduction
Within modern theory of capital cost and capital structure by Brusov-Filatova-Orekhova (BFO) theory and created within this theory modern investment models (Brusov P, Filatova T, Orehova N, Eskindarov M 2015) influence of growth of tax on profit rate on the efficiency of the investment is investigated. It has been shown that for long term investment projects, as well as for arbitrary duration projects the growth of tax on profit rate change the nature of the NPV dependence on leverage at some value t*: there is a transition from diminishing function NPV(L) when t<t* to growing function NPV(L). The t* value depends on the duration of the project, cost of capital (equity and debt) values and other parameters of the project.
At high leverage levels this leads to qualitatively new effect in investments: growth of the efficiency of the investments with growth of tax on profit rate. Discovered effects take place under consideration from the point of view of owners of equity capital as well as from the point of view of owners of equity and debt capital.
2. Dependence of NPV on Leverage Level L at Fixed Levels of Tax on Profit Rates T
2.1. The Effectiveness of the Investment Project from the Perspective of the Equity Holders Only
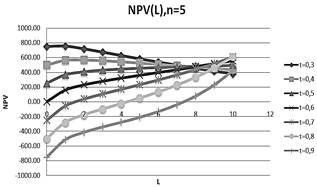
Figure 1. Dependence of NPV on leverage level L at fixed levels of tax on profit rates t for 5-year project.
One can see from the fig. 1, that the nature of the NPV dependence on
leverage at t*=0.5: there is a transition from diminishing function NPV(L)
when t<t* to growing function NPV(L) at t>t*.
Investigations will be done with the division of credit and investment flows: operating and finance flows are divided and discounted using different rates: operating flows - by the rate equal to equity cost ![]() , depending on leverage, and credit ones - by the rate equal to debt cost
, depending on leverage, and credit ones - by the rate equal to debt cost ![]() , which, until a sufficiently large values of leverage levels, remains constant and starts to grow only at sufficiently high leverage values L, when a risk of bankruptcy will appear. The consideration has been done upon constant value of investment capital I.
, which, until a sufficiently large values of leverage levels, remains constant and starts to grow only at sufficiently high leverage values L, when a risk of bankruptcy will appear. The consideration has been done upon constant value of investment capital I.
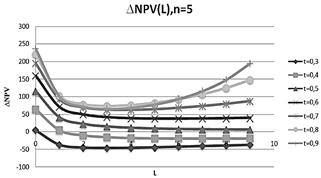
Figure 2. Dependence of DNPV on leverage level L at fixed levels of tax on profit rates t for 5-year project.
In this case NPV is described by the following formula (Brusov P, Filatova T, Orehova N, Eskindarov M 2015; Brusov & Filatova, 2011; Brusov, Filatova, Eskindarov, et al., 2011; Brusov, Filatova, Orehova, et al., 2011; Brusov, Filatova, & Orekhova, 2013b; Filatova, Orehova, & Brusova, 2008; P.N. Brusov, T.V. Filatova and N.P. Orekhova (2014))
![]() (1)
(1)
Using it we calculate NPV and ∆NPV at fixed levels of tax on profit rates t.
5-year project For 5-year projects we get the following results (Tables 1-7, Figures 1 and 2).
Table 1. Dependence of NPV and DNPV on leverage level L at fixed levels of tax on profit rates t for 5-year project at t=0.3.
| L | Ko | Kd | Wd | t | n | NOI | BFO | Ke | NPV | ∆NPV |
| 0 | 0,18 | 0,14 | 0 | 0,3 | 5 | 800 | 0,00 | 0,18 | 751,22 | 4,922709 |
| 1 | 0,18 | 0,14 | 0,5 | 0,3 | 5 | 800 | 0,00 | 0,197488 | 756,14 | -36,8599 |
| 2 | 0,18 | 0,14 | 0,66667 | 0,3 | 5 | 800 | 0,00 | 0,214367 | 719,28 | -44,7663 |
| 3 | 0,18 | 0,14 | 0,75 | 0,3 | 5 | 800 | 0,00 | 0,231082 | 674,51 | -46,126 |
| 4 | 0,18 | 0,14 | 0,8 | 0,3 | 5 | 800 | 0,00 | 0,24773 | 628,39 | -45,4549 |
| 5 | 0,18 | 0,14 | 0,83333 | 0,3 | 5 | 800 | 0,00 | 0,264343 | 582,93 | -44,027 |
| 6 | 0,18 | 0,14 | 0,85714 | 0,3 | 5 | 800 | 0,00 | 0,280937 | 538,90 | -42,3084 |
| 7 | 0,18 | 0,14 | 0,875 | 0,3 | 5 | 800 | 0,00 | 0,297518 | 496,60 | -40,4978 |
| 8 | 0,18 | 0,14 | 0,88889 | 0,3 | 5 | 800 | 0,00 | 0,314091 | 456,10 | -38,6879 |
| 9 | 0,18 | 0,14 | 0,9 | 0,3 | 5 | 800 | 0,00 | 0,330658 | 417,41 | -36,9239 |
| 10 | 0,18 | 0,14 | 0,90909 | 0,3 | 5 | 800 | 0,00 | 0,34722 | 380,49 |
Table 2. Dependence of NPV and DNPV on leverage level L at fixed levels of tax on profit rates t for 5-year project at t=0.4.
| L | Ko | Kd | Wd | t | n | NOI | BFO | Ke | NPV | ∆NPV |
| 0 | 0,18 | 0,14 | 0 | 0,4 | 5 | 800 | 0,00 | 0,18 | 501,04 | 64,13345 |
| 1 | 0,18 | 0,14 | 0,5 | 0,4 | 5 | 800 | 0,00 | 0,189578 | 565,18 | 4,73089 |
| 2 | 0,18 | 0,14 | 0,66667 | 0,4 | 5 | 800 | 0,00 | 0,19803 | 569,91 | -9,5017 |
| 3 | 0,18 | 0,14 | 0,75 | 0,4 | 5 | 800 | 0,00 | 0,206172 | 560,40 | -14,7815 |
| 4 | 0,18 | 0,14 | 0,8 | 0,4 | 5 | 800 | 0,00 | 0,214184 | 545,62 | -17,1025 |
| 5 | 0,18 | 0,14 | 0,83333 | 0,4 | 5 | 800 | 0,00 | 0,22213 | 528,52 | -18,1709 |
| 6 | 0,18 | 0,14 | 0,85714 | 0,4 | 5 | 800 | 0,00 | 0,230037 | 510,35 | -18,6246 |
| 7 | 0,18 | 0,14 | 0,875 | 0,4 | 5 | 800 | 0,00 | 0,23792 | 491,73 | -18,7461 |
| 8 | 0,18 | 0,14 | 0,88889 | 0,4 | 5 | 800 | 0,00 | 0,245786 | 472,98 | -18,6762 |
| 9 | 0,18 | 0,14 | 0,9 | 0,4 | 5 | 800 | 0,00 | 0,253642 | 454,30 | -18,4911 |
| 10 | 0,18 | 0,14 | 0,90909 | 0,4 | 5 | 800 | 0,00 | 0,261488 | 435,81 |
Table 3. Dependence of NPV and DNPV on leverage level L at fixed levels of tax on profit rates t for 5-year project at t=0.5.
| L | Ko | Kd | Wd | t | n | NOI | BFO | Ke | NPV | ∆NPV |
| 0 | 0,18 | 0,14 | 0 | 0,5 | 5 | 800 | 0,00 | 0,18 | 250,87 | 116,0669 |
| 1 | 0,18 | 0,14 | 0,5 | 0,5 | 5 | 800 | 0,00 | 0,181448 | 366,94 | 41,1323 |
| 2 | 0,18 | 0,14 | 0,66667 | 0,5 | 5 | 800 | 0,00 | 0,181065 | 408,07 | 22,57738 |
| 3 | 0,18 | 0,14 | 0,75 | 0,5 | 5 | 800 | 0,00 | 0,180162 | 430,65 | 15,19888 |
| 4 | 0,18 | 0,14 | 0,8 | 0,5 | 5 | 800 | 0,00 | 0,179041 | 445,84 | 11,52994 |
| 5 | 0,18 | 0,14 | 0,83333 | 0,5 | 5 | 800 | 0,00 | 0,177806 | 457,37 | 9,446706 |
| 6 | 0,18 | 0,14 | 0,85714 | 0,5 | 5 | 800 | 0,00 | 0,176505 | 466,82 | 8,154973 |
| 7 | 0,18 | 0,14 | 0,875 | 0,5 | 5 | 800 | 0,00 | 0,175162 | 474,98 | 7,302458 |
| 8 | 0,18 | 0,14 | 0,88889 | 0,5 | 5 | 800 | 0,00 | 0,173792 | 482,28 | 6,713275 |
| 9 | 0,18 | 0,14 | 0,9 | 0,5 | 5 | 800 | 0,00 | 0,172401 | 488,99 | 6,291579 |
| 10 | 0,18 | 0,14 | 0,90909 | 0,5 | 5 | 800 | 0,00 | 0,170996 | 495,28 |
Table 4. Dependence of NPV and DNPV on leverage level L at fixed levels of tax on profit rates t for 5-year project at t=0.6.
| L | Ko | Kd | Wd | t | n | NOI | BFO | Ke | NPV | ∆NPV |
| 0 | 0,18 | 0,14 | 0 | 0,6 | 5 | 800 | 0,00 | 0,18 | 0,69 | 160,0655 |
| 1 | 0,18 | 0,14 | 0,5 | 0,6 | 5 | 800 | 0,00 | 0,173086 | 160,76 | 70,95083 |
| 2 | 0,18 | 0,14 | 0,66667 | 0,6 | 5 | 800 | 0,00 | 0,163424 | 231,71 | 49,78654 |
| 3 | 0,18 | 0,14 | 0,75 | 0,6 | 5 | 800 | 0,00 | 0,15296 | 281,50 | 42,12961 |
| 4 | 0,18 | 0,14 | 0,8 | 0,6 | 5 | 800 | 0,00 | 0,142153 | 323,63 | 39,00243 |
| 5 | 0,18 | 0,14 | 0,83333 | 0,6 | 5 | 800 | 0,00 | 0,131168 | 362,63 | 37,85743 |
| 6 | 0,18 | 0,14 | 0,85714 | 0,6 | 5 | 800 | 0,00 | 0,120078 | 400,49 | 37,74625 |
| 7 | 0,18 | 0,14 | 0,875 | 0,6 | 5 | 800 | 0,00 | 0,108922 | 438,23 | 38,25211 |
| 8 | 0,18 | 0,14 | 0,88889 | 0,6 | 5 | 800 | 0,00 | 0,097721 | 476,49 | 39,17065 |
| 9 | 0,18 | 0,14 | 0,9 | 0,6 | 5 | 800 | 0,00 | 0,086488 | 515,66 | 40,39427 |
| 10 | 0,18 | 0,14 | 0,90909 | 0,6 | 5 | 800 | 0,00 | 0,075231 | 556,05 |
Table 5. Dependence of NPV and DNPV on leverage level L at fixed levels of tax on profit rates t for 5-year project at t=0.7.
| L | Ko | Kd | Wd | t | n | NOI | BFO | Ke | NPV | ∆NPV |
| 0 | 0,18 | 0,14 | 0 | 0,7 | 5 | 800 | 0,00 | 0,18 | -249,48 | 195,3877 |
| 1 | 0,18 | 0,14 | 0,5 | 0,7 | 5 | 800 | 0,00 | 0,16448 | -54,09 | 92,40829 |
| 2 | 0,18 | 0,14 | 0,66667 | 0,7 | 5 | 800 | 0,00 | 0,145057 | 38,32 | 69,68464 |
| 3 | 0,18 | 0,14 | 0,75 | 0,7 | 5 | 800 | 0,00 | 0,124461 | 108,00 | 63,19622 |
| 4 | 0,18 | 0,14 | 0,8 | 0,7 | 5 | 800 | 0,00 | 0,103355 | 171,20 | 62,43475 |
| 5 | 0,18 | 0,14 | 0,83333 | 0,7 | 5 | 800 | 0,00 | 0,081982 | 233,63 | 64,46977 |
| 6 | 0,18 | 0,14 | 0,85714 | 0,7 | 5 | 800 | 0,00 | 0,060453 | 298,10 | 68,26526 |
| 7 | 0,18 | 0,14 | 0,875 | 0,7 | 5 | 800 | 0,00 | 0,038822 | 366,37 | 73,42597 |
| 8 | 0,18 | 0,14 | 0,88889 | 0,7 | 5 | 800 | 0,00 | 0,017124 | 439,79 | 79,82524 |
| 9 | 0,18 | 0,14 | 0,9 | 0,7 | 5 | 800 | 0,00 | -0,00462 | 519,62 | 87,47314 |
| 10 | 0,18 | 0,14 | 0,90909 | 0,7 | 5 | 800 | 0,00 | -0,0264 | 607,09 |
Table 6. Dependence of NPV and DNPV on leverage level L at fixed levels of tax on profit rates t for 5-year project at t=0.8.
| L | Ko | Kd | Wd | t | n | NOI | BFO | Ke | NPV | ∆NPV |
| 0 | 0,18 | 0,14 | 0 | 0,8 | 5 | 800 | 0,00 | 0,18 | -499,65 | 221,1945 |
| 1 | 0,18 | 0,14 | 0,5 | 0,8 | 5 | 800 | 0,00 | 0,155616 | -278,46 | 103,2179 |
| 2 | 0,18 | 0,14 | 0,66667 | 0,8 | 5 | 800 | 0,00 | 0,125907 | -175,24 | 78,69376 |
| 3 | 0,18 | 0,14 | 0,75 | 0,8 | 5 | 800 | 0,00 | 0,094544 | -96,55 | 73,65304 |
| 4 | 0,18 | 0,14 | 0,8 | 0,8 | 5 | 800 | 0,00 | 0,062454 | -22,89 | 76,11182 |
| 5 | 0,18 | 0,14 | 0,83333 | 0,8 | 5 | 800 | 0,00 | 0,029979 | 53,22 | 82,93806 |
| 6 | 0,18 | 0,14 | 0,85714 | 0,8 | 5 | 800 | 0,00 | -0,00272 | 136,16 | 93,28915 |
| 7 | 0,18 | 0,14 | 0,875 | 0,8 | 5 | 800 | 0,00 | -0,03557 | 229,45 | 107,1925 |
| 8 | 0,18 | 0,14 | 0,88889 | 0,8 | 5 | 800 | 0,00 | -0,06852 | 336,64 | 125,1636 |
| 9 | 0,18 | 0,14 | 0,9 | 0,8 | 5 | 800 | 0,00 | -0,10154 | 461,80 | 148,1245 |
| 10 | 0,18 | 0,14 | 0,90909 | 0,8 | 5 | 800 | 0,00 | -0,13462 | 609,93 |
Table 7. Dependence of NPV and DNPV on leverage level L at fixed levels of tax on profit rates t for 5-year project at t=0.9.
| L | Ko | Kd | Wd | t | n | NOI | BFO | Ke | NPV | ∆NPV |
| 0 | 0,18 | 0,14 | 0 | 0,9 | 5 | 800 | 0,00 | 0,18 | -749,83 | 236,5329 |
| 1 | 0,18 | 0,14 | 0,5 | 0,9 | 5 | 800 | 0,00 | 0,14648 | -513,29 | 100,4127 |
| 2 | 0,18 | 0,14 | 0,66667 | 0,9 | 5 | 800 | 0,00 | 0,105908 | -412,88 | 71,49601 |
| 3 | 0,18 | 0,14 | 0,75 | 0,9 | 5 | 800 | 0,00 | 0,063074 | -341,38 | 65,36206 |
| 4 | 0,18 | 0,14 | 0,8 | 0,9 | 5 | 800 | 0,00 | 0,019228 | -276,02 | 68,55205 |
| 5 | 0,18 | 0,14 | 0,83333 | 0,9 | 5 | 800 | 0,00 | -0,02516 | -207,47 | 77,93497 |
| 6 | 0,18 | 0,14 | 0,85714 | 0,9 | 5 | 800 | 0,00 | -0,06987 | -129,54 | 93,29474 |
| 7 | 0,18 | 0,14 | 0,875 | 0,9 | 5 | 800 | 0,00 | -0,11479 | -36,24 | 115,8841 |
| 8 | 0,18 | 0,14 | 0,88889 | 0,9 | 5 | 800 | 0,00 | -0,15985 | 79,64 | 148,3017 |
| 9 | 0,18 | 0,14 | 0,9 | 0,9 | 5 | 800 | 0,00 | -0,20501 | 227,94 | 194,9563 |
| 10 | 0,18 | 0,14 | 0,90909 | 0,9 | 5 | 800 | 0,00 | -0,25024 | 422,90 |
Figure 3. Dependence of NPV on leverage level L at fixed levels of tax on profit rates t for 10-year project.
10-year project For 10-year projects we get the following results (Tables 8-14, Figures 3 and 4).
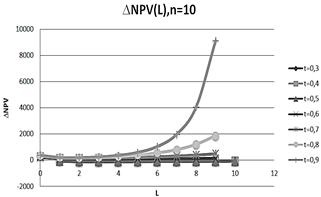
Figure 4. Dependence of DNPV on leverage level L at fixed levels of tax on profit rates t for 10-year project.
Table 8. Dependence of NPV and DNPV on leverage level L at fixed levels of tax on profit rates t for 10-year project at t=0.3.
| L | Ko | Kd | Wd | t | n | NOI | BFO | Ke | NPV | ∆NPV |
| 0 | 0,18 | 0,14 | 0 | 0,3 | 10 | 800 | 0,00 | 0,18 | 1516,69 | -51,935 |
| 1 | 0,18 | 0,14 | 0,5 | 0,3 | 10 | 800 | 0,00 | 0,19907 | 1464,75 | -101,47 |
| 2 | 0,18 | 0,14 | 0,66667 | 0,3 | 10 | 800 | 0,00 | 0,217182 | 1363,28 | -104,843 |
| 3 | 0,18 | 0,14 | 0,75 | 0,3 | 10 | 800 | 0,00 | 0,235022 | 1258,44 | -100,263 |
| 4 | 0,18 | 0,14 | 0,8 | 0,3 | 10 | 800 | 0,00 | 0,252747 | 1158,18 | -93,8156 |
| 5 | 0,18 | 0,14 | 0,83333 | 0,3 | 10 | 800 | 0,00 | 0,270413 | 1064,36 | -87,1129 |
| 6 | 0,18 | 0,14 | 0,85714 | 0,3 | 10 | 800 | 0,00 | 0,288045 | 977,25 | -80,6768 |
| 7 | 0,18 | 0,14 | 0,875 | 0,3 | 10 | 800 | 0,00 | 0,305654 | 896,57 | -74,6812 |
| 8 | 0,18 | 0,14 | 0,88889 | 0,3 | 10 | 800 | 0,00 | 0,323249 | 821,89 | -69,1705 |
| 9 | 0,18 | 0,14 | 0,9 | 0,3 | 10 | 800 | 0,00 | 0,340834 | 752,72 | -64,1369 |
| 10 | 0,18 | 0,14 | 0,90909 | 0,3 | 10 | 800 | 0,00 | 0,358411 | 688,58 |
Table 9. Dependence of NPV and DNPV on leverage level L at fixed levels of tax on profit rates t for 10-year project at t=0.4.
| L | Ko | Kd | Wd | t | n | NOI | BFO | Ke | NPV | ∆NPV |
| 0 | 0,18 | 0,14 | 0 | 0,4 | 10 | 800 | 0,00 | 0,18 | 1157,16 | 61,10029 |
| 1 | 0,18 | 0,14 | 0,5 | 0,4 | 10 | 800 | 0,00 | 0,191455 | 1218,26 | -18,517 |
| 2 | 0,18 | 0,14 | 0,66667 | 0,4 | 10 | 800 | 0,00 | 0,201083 | 1199,74 | -35,7995 |
| 3 | 0,18 | 0,14 | 0,75 | 0,4 | 10 | 800 | 0,00 | 0,210169 | 1163,95 | -41,1321 |
| 4 | 0,18 | 0,14 | 0,8 | 0,4 | 10 | 800 | 0,00 | 0,21902 | 1122,81 | -42,6427 |
| 5 | 0,18 | 0,14 | 0,83333 | 0,4 | 10 | 800 | 0,00 | 0,22775 | 1080,17 | -42,6081 |
| 6 | 0,18 | 0,14 | 0,85714 | 0,4 | 10 | 800 | 0,00 | 0,236408 | 1037,56 | -41,8669 |
| 7 | 0,18 | 0,14 | 0,875 | 0,4 | 10 | 800 | 0,00 | 0,24502 | 995,70 | -40,7844 |
| 8 | 0,18 | 0,14 | 0,88889 | 0,4 | 10 | 800 | 0,00 | 0,253602 | 954,91 | -39,5386 |
| 9 | 0,18 | 0,14 | 0,9 | 0,4 | 10 | 800 | 0,00 | 0,262161 | 915,37 | -38,2228 |
| 10 | 0,18 | 0,14 | 0,90909 | 0,4 | 10 | 800 | 0,00 | 0,270705 | 877,15 |
Table 10. Dependence of NPV and DNPV on leverage level L at fixed levels of tax on profit rates t for 10-year project at t=0.5.
| L | Ko | Kd | Wd | t | n | NOI | BFO | Ke | NPV | ∆NPV |
| 0 | 0,18 | 0,14 | 0 | 0,5 | 10 | 800 | 0,00 | 0,18 | 797,63 | -44,2013 |
| 1 | 0,18 | 0,14 | 0,5 | 0,5 | 10 | 800 | 0,00 | 0,219687 | 753,43 | -104,707 |
| 2 | 0,18 | 0,14 | 0,66667 | 0,5 | 10 | 800 | 0,00 | 0,255351 | 648,73 | -103,671 |
| 3 | 0,18 | 0,14 | 0,75 | 0,5 | 10 | 800 | 0,00 | 0,290005 | 545,06 | -93,6005 |
| 4 | 0,18 | 0,14 | 0,8 | 0,5 | 10 | 800 | 0,00 | 0,32421 | 451,45 | -82,6797 |
| 5 | 0,18 | 0,14 | 0,83333 | 0,5 | 10 | 800 | 0,00 | 0,358168 | 368,78 | -72,7174 |
| 6 | 0,18 | 0,14 | 0,85714 | 0,5 | 10 | 800 | 0,00 | 0,391982 | 296,06 | -64,0269 |
| 7 | 0,18 | 0,14 | 0,875 | 0,5 | 10 | 800 | 0,00 | 0,425702 | 232,03 | -56,5734 |
| 8 | 0,18 | 0,14 | 0,88889 | 0,5 | 10 | 800 | 0,00 | 0,459362 | 175,46 | -50,1953 |
| 9 | 0,18 | 0,14 | 0,9 | 0,5 | 10 | 800 | 0,00 | 0,492979 | 125,26 | -44,7383 |
| 10 | 0,18 | 0,14 | 0,90909 | 0,5 | 10 | 800 | 0,00 | 0,526564 | 80,52 |
Table 11. Dependence of NPV and DNPV on leverage level L at fixed levels of tax on profit rates t for 10-year project at t=0.6.
| L | Ko | Kd | Wd | t | n | NOI | BFO | Ke | NPV | ∆NPV |
| 0 | 0,18 | 0,14 | 0 | 0,6 | 10 | 800 | 0,00 | 0,18 | 438,11 | 244,5668 |
| 1 | 0,18 | 0,14 | 0,5 | 0,6 | 10 | 800 | 0,00 | 0,175084 | 682,67 | 125,4304 |
| 2 | 0,18 | 0,14 | 0,66667 | 0,6 | 10 | 800 | 0,00 | 0,165407 | 808,10 | 101,3662 |
| 3 | 0,18 | 0,14 | 0,75 | 0,6 | 10 | 800 | 0,00 | 0,154162 | 909,47 | 95,93652 |
| 4 | 0,18 | 0,14 | 0,8 | 0,6 | 10 | 800 | 0,00 | 0,142206 | 1005,41 | 97,02629 |
| 5 | 0,18 | 0,14 | 0,83333 | 0,6 | 10 | 800 | 0,00 | 0,129869 | 1102,43 | 101,3309 |
| 6 | 0,18 | 0,14 | 0,85714 | 0,6 | 10 | 800 | 0,00 | 0,117304 | 1203,76 | 107,7015 |
| 7 | 0,18 | 0,14 | 0,875 | 0,6 | 10 | 800 | 0,00 | 0,10459 | 1311,47 | 115,7055 |
| 8 | 0,18 | 0,14 | 0,88889 | 0,6 | 10 | 800 | 0,00 | 0,091775 | 1427,17 | 125,2046 |
| 9 | 0,18 | 0,14 | 0,9 | 0,6 | 10 | 800 | 0,00 | 0,078888 | 1552,38 | 136,2059 |
| 10 | 0,18 | 0,14 | 0,90909 | 0,6 | 10 | 800 | 0,00 | 0,065947 | 1688,58 |
Table 12. Dependence of NPV and DNPV on leverage level L at fixed levels of tax on profit rates t for 10-year project at t=0.7.
| L | Ko | Kd | Wd | t | n | NOI | BFO | Ke | NPV | ∆NPV |
| 0 | 0,18 | 0,14 | 0 | 0,7 | 10 | 800 | 0,00 | 0,18 | 78,58 | 310,4744 |
| 1 | 0,18 | 0,14 | 0,5 | 0,7 | 10 | 800 | 0,00 | 0,166255 | 389,06 | 177,1979 |
| 2 | 0,18 | 0,14 | 0,66667 | 0,7 | 10 | 800 | 0,00 | 0,145497 | 566,25 | 160,5402 |
| 3 | 0,18 | 0,14 | 0,75 | 0,7 | 10 | 800 | 0,00 | 0,122295 | 726,79 | 169,9063 |
| 4 | 0,18 | 0,14 | 0,8 | 0,7 | 10 | 800 | 0,00 | 0,097953 | 896,70 | 191,9196 |
| 5 | 0,18 | 0,14 | 0,83333 | 0,7 | 10 | 800 | 0,00 | 0,072986 | 1088,62 | 224,1724 |
| 6 | 0,18 | 0,14 | 0,85714 | 0,7 | 10 | 800 | 0,00 | 0,04764 | 1312,79 | 267,4019 |
| 7 | 0,18 | 0,14 | 0,875 | 0,7 | 10 | 800 | 0,00 | 0,022047 | 1580,19 | 323,9861 |
| 8 | 0,18 | 0,14 | 0,88889 | 0,7 | 10 | 800 | 0,00 | -0,00372 | 1904,18 | 397,7601 |
| 9 | 0,18 | 0,14 | 0,9 | 0,7 | 10 | 800 | 0,00 | -0,0296 | 2301,94 | 494,3094 |
| 10 | 0,18 | 0,14 | 0,90909 | 0,7 | 10 | 800 | 0,00 | -0,05558 | 2796,25 |
Table 13. Dependence of NPV and DNPV on leverage level L at fixed levels of tax on profit rates t for 10-year project at t=0.8.
| L | Ko | Kd | Wd | t | n | NOI | BFO | Ke | NPV | ∆NPV |
| 0 | 0,18 | 0,14 | 0 | 0,8 | 10 | 800 | 0,00 | 0,18 | -280,95 | 355,2633 |
| 1 | 0,18 | 0,14 | 0,5 | 0,8 | 10 | 800 | 0,00 | 0,156938 | 74,32 | 204,8466 |
| 2 | 0,18 | 0,14 | 0,66667 | 0,8 | 10 | 800 | 0,00 | 0,123925 | 279,16 | 198,4863 |
| 3 | 0,18 | 0,14 | 0,75 | 0,8 | 10 | 800 | 0,00 | 0,087223 | 477,65 | 232,7806 |
| 4 | 0,18 | 0,14 | 0,8 | 0,8 | 10 | 800 | 0,00 | 0,048741 | 710,43 | 297,8303 |
| 5 | 0,18 | 0,14 | 0,83333 | 0,8 | 10 | 800 | 0,00 | 0,009262 | 1008,26 | 400,9259 |
| 6 | 0,18 | 0,14 | 0,85714 | 0,8 | 10 | 800 | 0,00 | -0,03083 | 1409,19 | 560,3743 |
| 7 | 0,18 | 0,14 | 0,875 | 0,8 | 10 | 800 | 0,00 | -0,07133 | 1969,56 | 809,4944 |
| 8 | 0,18 | 0,14 | 0,88889 | 0,8 | 10 | 800 | 0,00 | -0,11211 | 2779,06 | 1207,425 |
| 9 | 0,18 | 0,14 | 0,9 | 0,8 | 10 | 800 | 0,00 | -0,1531 | 3986,48 | 1861,112 |
| 10 | 0,18 | 0,14 | 0,90909 | 0,8 | 10 | 800 | 0,00 | -0,19424 | 5847,59 |
Table 14. Dependence of NPV and NPV on leverage level L at fixed levels of tax on profit rates t for 10-year project at t=0.9.
| L | Ko | Kd | Wd | t | n | NOI | BFO | Ke | NPV | ∆NPV |
| 0 | 0,18 | 0,14 | 0 | 0,9 | 10 | 800 | 0,00 | 0,18 | -640,47 | 375,0978 |
| 1 | 0,18 | 0,14 | 0,5 | 0,9 | 10 | 800 | 0,00 | 0,147081 | -265,38 | 194,2145 |
| 2 | 0,18 | 0,14 | 0,66667 | 0,9 | 10 | 800 | 0,00 | 0,100417 | -71,16 | 186,9461 |
| 3 | 0,18 | 0,14 | 0,75 | 0,9 | 10 | 800 | 0,00 | 0,048303 | 115,79 | 239,586 |
| 4 | 0,18 | 0,14 | 0,8 | 0,9 | 10 | 800 | 0,00 | -0,00655 | 355,37 | 356,4744 |
| 5 | 0,18 | 0,14 | 0,83333 | 0,9 | 10 | 800 | 0,00 | -0,06297 | 711,85 | 583,6021 |
| 6 | 0,18 | 0,14 | 0,85714 | 0,9 | 10 | 800 | 0,00 | -0,12039 | 1295,45 | 1032,383 |
| 7 | 0,18 | 0,14 | 0,875 | 0,9 | 10 | 800 | 0,00 | -0,17847 | 2327,83 | 1967,211 |
| 8 | 0,18 | 0,14 | 0,88889 | 0,9 | 10 | 800 | 0,00 | -0,23701 | 4295,04 | 4054,338 |
| 9 | 0,18 | 0,14 | 0,9 | 0,9 | 10 | 800 | 0,00 | -0,2959 | 8349,38 | 9115,336 |
| 10 | 0,18 | 0,14 | 0,90909 | 0,9 | 10 | 800 | 0,00 | -0,35504 | 17464,72 |
Table 15. Dependence of NPV and DNPV on leverage level L at fixed levels of tax on profit rates t for perpetuity project at t=0.3.
| L | t | k0 | kd | I | NOI | NPV | ∆NPV |
| 0 | 0,3 | 0,18 | 0,14 | 1000 | 800 | 2111,111 | -268,803 |
| 1 | 0,3 | 0,18 | 0,14 | 1000 | 800 | 1842,308 | -269,426 |
| 2 | 0,3 | 0,18 | 0,14 | 1000 | 800 | 1572,881 | -226,669 |
| 3 | 0,3 | 0,18 | 0,14 | 1000 | 800 | 1346,212 | -188,404 |
| 4 | 0,3 | 0,18 | 0,14 | 1000 | 800 | 1157,808 | -157,808 |
| 5 | 0,3 | 0,18 | 0,14 | 1000 | 800 | 1000 | -133,662 |
| 6 | 0,3 | 0,18 | 0,14 | 1000 | 800 | 866,3383 | -114,477 |
| 7 | 0,3 | 0,18 | 0,14 | 1000 | 800 | 751,8617 | -99,0564 |
| 8 | 0,3 | 0,18 | 0,14 | 1000 | 800 | 652,8053 | -86,509 |
| 9 | 0,3 | 0,18 | 0,14 | 1000 | 800 | 566,2963 | -76,1777 |
| 10 | 0,3 | 0,18 | 0,14 | 1000 | 800 | 490,1186 |
Table 16. Dependence of NPV and NPV on leverage level L at fixed levels of tax on profit rates t for perpetuity project at t=0.4.
| L | t | k0 | kd | I | NOI | NPV | ∆NPV |
| 0 | 0,4 | 0,18 | 0,14 | 1000 | 800 | 1666,667 | -113,725 |
| 1 | 0,4 | 0,18 | 0,14 | 1000 | 800 | 1552,941 | -181,011 |
| 2 | 0,4 | 0,18 | 0,14 | 1000 | 800 | 1371,93 | -167,168 |
| 3 | 0,4 | 0,18 | 0,14 | 1000 | 800 | 1204,762 | -145,631 |
| 4 | 0,4 | 0,18 | 0,14 | 1000 | 800 | 1059,13 | -125,797 |
| 5 | 0,4 | 0,18 | 0,14 | 1000 | 800 | 933,3333 | -108,995 |
| 6 | 0,4 | 0,18 | 0,14 | 1000 | 800 | 824,3386 | -95,0283 |
| 7 | 0,4 | 0,18 | 0,14 | 1000 | 800 | 729,3103 | -83,4322 |
| 8 | 0,4 | 0,18 | 0,14 | 1000 | 800 | 645,8781 | -73,7569 |
| 9 | 0,4 | 0,18 | 0,14 | 1000 | 800 | 572,1212 | -65,6277 |
| 10 | 0,4 | 0,18 | 0,14 | 1000 | 800 | 506,4935 |
Table 17. Dependence of NPV and DNPV on leverage level L at fixed levels of tax on profit rates t for perpetuity project at t=0.5.
| L | t | k0 | kd | I | NOI | NPV | ∆NPV |
| 0 | 0,5 | 0,18 | 0,14 | 1000 | 800 | 1222,222 | 27,77778 |
| 1 | 0,5 | 0,18 | 0,14 | 1000 | 800 | 1250 | -98,4848 |
| 2 | 0,5 | 0,18 | 0,14 | 1000 | 800 | 1151,515 | -109,848 |
| 3 | 0,5 | 0,18 | 0,14 | 1000 | 800 | 1041,667 | -103,205 |
| 4 | 0,5 | 0,18 | 0,14 | 1000 | 800 | 938,4615 | -93,2234 |
| 5 | 0,5 | 0,18 | 0,14 | 1000 | 800 | 845,2381 | -83,3333 |
| 6 | 0,5 | 0,18 | 0,14 | 1000 | 800 | 761,9048 | -74,4048 |
| 7 | 0,5 | 0,18 | 0,14 | 1000 | 800 | 687,5 | -66,585 |
| 8 | 0,5 | 0,18 | 0,14 | 1000 | 800 | 620,915 | -59,8039 |
| 9 | 0,5 | 0,18 | 0,14 | 1000 | 800 | 561,1111 | -53,9341 |
| 10 | 0,5 | 0,18 | 0,14 | 1000 | 800 | 507,177 |
Table 18. Dependence of NPV and DNPV on leverage level L at fixed levels of tax on profit rates t for perpetuity project at t=0.6.
| L | t | k0 | kd | I | NOI | NPV | ∆NPV |
| 0 | 0,6 | 0,18 | 0,14 | 1000 | 800 | 777,7778 | 154,8753 |
| 1 | 0,6 | 0,18 | 0,14 | 1000 | 800 | 932,6531 | -23,2191 |
| 2 | 0,6 | 0,18 | 0,14 | 1000 | 800 | 909,434 | -55,9252 |
| 3 | 0,6 | 0,18 | 0,14 | 1000 | 800 | 853,5088 | -62,0334 |
| 4 | 0,6 | 0,18 | 0,14 | 1000 | 800 | 791,4754 | -60,7062 |
| 5 | 0,6 | 0,18 | 0,14 | 1000 | 800 | 730,7692 | -57,0632 |
| 6 | 0,6 | 0,18 | 0,14 | 1000 | 800 | 673,706 | -52,8156 |
| 7 | 0,6 | 0,18 | 0,14 | 1000 | 800 | 620,8904 | -48,596 |
| 8 | 0,6 | 0,18 | 0,14 | 1000 | 800 | 572,2944 | -44,6401 |
| 9 | 0,6 | 0,18 | 0,14 | 1000 | 800 | 527,6543 | -41,0233 |
| 10 | 0,6 | 0,18 | 0,14 | 1000 | 800 | 486,631 |
Table 19. Dependence of NPV and DNPV on leverage level L at fixed levels of tax on profit rates t for perpetuity project at t=0.7.
| L | t | k0 | kd | I | NOI | NPV | ∆NPV |
| 0 | 0,7 | 0,18 | 0,14 | 1000 | 800 | 333,3333 | 266,6667 |
| 1 | 0,7 | 0,18 | 0,14 | 1000 | 800 | 600 | 43,13725 |
| 2 | 0,7 | 0,18 | 0,14 | 1000 | 800 | 643,1373 | -7,02614 |
| 3 | 0,7 | 0,18 | 0,14 | 1000 | 800 | 636,1111 | -23,4795 |
| 4 | 0,7 | 0,18 | 0,14 | 1000 | 800 | 612,6316 | -29,2982 |
| 5 | 0,7 | 0,18 | 0,14 | 1000 | 800 | 583,3333 | -30,9524 |
| 6 | 0,7 | 0,18 | 0,14 | 1000 | 800 | 552,381 | -30,79 |
| 7 | 0,7 | 0,18 | 0,14 | 1000 | 800 | 521,5909 | -29,8035 |
| 8 | 0,7 | 0,18 | 0,14 | 1000 | 800 | 491,7874 | -28,4541 |
| 9 | 0,7 | 0,18 | 0,14 | 1000 | 800 | 463,3333 | -26,9697 |
| 10 | 0,7 | 0,18 | 0,14 | 1000 | 800 | 436,3636 |
Table 20. Dependence of NPV and DNPV on leverage level L at fixed levels of tax on profit rates t for perpetuity project at t=0.8.
| L | t | k0 | kd | I | NOI | NPV | ∆NPV |
| 0 | 0,8 | 0,18 | 0,14 | 1000 | 800 | -111,111 | 362,1749 |
| 1 | 0,8 | 0,18 | 0,14 | 1000 | 800 | 251,0638 | 98,59603 |
| 2 | 0,8 | 0,18 | 0,14 | 1000 | 800 | 349,6599 | 34,65386 |
| 3 | 0,8 | 0,18 | 0,14 | 1000 | 800 | 384,3137 | 10,40326 |
| 4 | 0,8 | 0,18 | 0,14 | 1000 | 800 | 394,717 | -0,77759 |
| 5 | 0,8 | 0,18 | 0,14 | 1000 | 800 | 393,9394 | -6,47072 |
| 6 | 0,8 | 0,18 | 0,14 | 1000 | 800 | 387,4687 | -9,50257 |
| 7 | 0,8 | 0,18 | 0,14 | 1000 | 800 | 377,9661 | -11,1173 |
| 8 | 0,8 | 0,18 | 0,14 | 1000 | 800 | 366,8488 | -11,9282 |
| 9 | 0,8 | 0,18 | 0,14 | 1000 | 800 | 354,9206 | -12,2633 |
| 10 | 0,8 | 0,18 | 0,14 | 1000 | 800 | 342,6573 |
Table 21. Dependence of NPV and DNPV on leverage level L at fixed levels of tax on profit rates t for perpetuity project at t=0.9.
| L | t | k0 | kd | I | NOI | NPV | ∆NPV |
| 0 | 0,9 | 0,18 | 0,14 | 1000 | 800 | -555,556 | 440,3382 |
| 1 | 0,9 | 0,18 | 0,14 | 1000 | 800 | -115,217 | 140,7493 |
| 2 | 0,9 | 0,18 | 0,14 | 1000 | 800 | 25,53191 | 66,13475 |
| 3 | 0,9 | 0,18 | 0,14 | 1000 | 800 | 91,66667 | 36,4966 |
| 4 | 0,9 | 0,18 | 0,14 | 1000 | 800 | 128,1633 | 21,83673 |
| 5 | 0,9 | 0,18 | 0,14 | 1000 | 800 | 150 | 13,58543 |
| 6 | 0,9 | 0,18 | 0,14 | 1000 | 800 | 163,5854 | 8,52995 |
| 7 | 0,9 | 0,18 | 0,14 | 1000 | 800 | 172,1154 | 5,243106 |
| 8 | 0,9 | 0,18 | 0,14 | 1000 | 800 | 177,3585 | 3,01188 |
| 9 | 0,9 | 0,18 | 0,14 | 1000 | 800 | 180,3704 | 1,447811 |
| 10 | 0,9 | 0,18 | 0,14 | 1000 | 800 | 181,8182 |
Table 22. Dependence of NPV and DNPV on leverage level L at fixed levels of tax on profit rates t for 5-year project at t=0.3.
| I | L | WACC | Ko | Kd | Wd | t | n | NOI | BFO | Ke | NPV | ∆NPV |
| 1000 | 0 | 0,18 | 0,18 | 0,14 | 0 | 0,3 | 5 | 800 | 0,00 | 0,18 | 751,2158 | 4,922709 |
| 1000 | 1 | 0,14774 | 0,18 | 0,14 | 0,5 | 0,3 | 5 | 800 | 0,00 | 0,197488 | 756,1385 | -36,8599 |
| 1000 | 2 | 0,13679 | 0,18 | 0,14 | 0,66667 | 0,3 | 5 | 800 | 0,00 | 0,214367 | 719,2786 | -44,7663 |
| 1000 | 3 | 0,13127 | 0,18 | 0,14 | 0,75 | 0,3 | 5 | 800 | 0,00 | 0,231082 | 674,5122 | -46,126 |
| 1000 | 4 | 0,12795 | 0,18 | 0,14 | 0,8 | 0,3 | 5 | 800 | 0,00 | 0,24773 | 628,3863 | -45,4549 |
| 1000 | 5 | 0,12572 | 0,18 | 0,14 | 0,83333 | 0,3 | 5 | 800 | 0,00 | 0,264343 | 582,9313 | -44,027 |
| 1000 | 6 | 0,12413 | 0,18 | 0,14 | 0,85714 | 0,3 | 5 | 800 | 0,00 | 0,280937 | 538,9044 | -42,3084 |
| 1000 | 7 | 0,12294 | 0,18 | 0,14 | 0,875 | 0,3 | 5 | 800 | 0,00 | 0,297518 | 496,596 | -40,4978 |
| 1000 | 8 | 0,12201 | 0,18 | 0,14 | 0,88889 | 0,3 | 5 | 800 | 0,00 | 0,314091 | 456,0982 | -38,6879 |
| 1000 | 9 | 0,12127 | 0,18 | 0,14 | 0,9 | 0,3 | 5 | 800 | 0,00 | 0,330658 | 417,4103 | -36,9239 |
| 1000 | 10 | 0,12066 | 0,18 | 0,14 | 0,90909 | 0,3 | 5 | 800 | 0,00 | 0,34722 | 380,4865 |
Table 23. Dependence of NPV and DNPV on leverage level L at fixed levels of tax on profit rates t for 5-year project at t=0.4.
| I | L | WACC | Ko | Kd | Wd | t | n | NOI | BFO | Ke | NPV | ∆NPV |
| 1000 | 0 | 0,18 | 0,18 | 0,14 | 0 | 0,4 | 5 | 800 | 0,00 | 0,18 | 501,0421 | 64,13345 |
| 1000 | 1 | 0,13679 | 0,18 | 0,14 | 0,5 | 0,4 | 5 | 800 | 0,00 | 0,189578 | 565,1755 | 4,73089 |
| 1000 | 2 | 0,12201 | 0,18 | 0,14 | 0,66667 | 0,4 | 5 | 800 | 0,00 | 0,19803 | 569,9064 | -9,5017 |
| 1000 | 3 | 0,11454 | 0,18 | 0,14 | 0,75 | 0,4 | 5 | 800 | 0,00 | 0,206172 | 560,4047 | -14,7815 |
| 1000 | 4 | 0,11004 | 0,18 | 0,14 | 0,8 | 0,4 | 5 | 800 | 0,00 | 0,214184 | 545,6233 | -17,1025 |
| 1000 | 5 | 0,10702 | 0,18 | 0,14 | 0,83333 | 0,4 | 5 | 800 | 0,00 | 0,22213 | 528,5208 | -18,1709 |
| 1000 | 6 | 0,10486 | 0,18 | 0,14 | 0,85714 | 0,4 | 5 | 800 | 0,00 | 0,230037 | 510,3499 | -18,6246 |
| 1000 | 7 | 0,10324 | 0,18 | 0,14 | 0,875 | 0,4 | 5 | 800 | 0,00 | 0,23792 | 491,7254 | -18,7461 |
| 1000 | 8 | 0,10198 | 0,18 | 0,14 | 0,88889 | 0,4 | 5 | 800 | 0,00 | 0,245786 | 472,9793 | -18,6762 |
| 1000 | 9 | 0,10096 | 0,18 | 0,14 | 0,9 | 0,4 | 5 | 800 | 0,00 | 0,253642 | 454,3031 | -18,4911 |
| 1000 | 10 | 0,10014 | 0,18 | 0,14 | 0,90909 | 0,4 | 5 | 800 | 0,00 | 0,261488 | 435,812 |
Table 24. Dependence of NPV and DNPV on leverage level L at fixed levels of tax on profit rates t for 5-year project at t=0.5.
| I | L | WACC | Ko | Kd | Wd | t | n | NOI | BFO | Ke | NPV | ∆NPV |
| 1000 | 0 | 0,18 | 0,18 | 0,14 | 0 | 0,5 | 5 | 800 | 0,00 | 0,18 | 250,8684 | 116,0669 |
| 1000 | 1 | 0,12572 | 0,18 | 0,14 | 0,5 | 0,5 | 5 | 800 | 0,00 | 0,181448 | 366,9353 | 41,1323 |
| 1000 | 2 | 0,10702 | 0,18 | 0,14 | 0,66667 | 0,5 | 5 | 800 | 0,00 | 0,181065 | 408,0676 | 22,57738 |
| 1000 | 3 | 0,09754 | 0,18 | 0,14 | 0,75 | 0,5 | 5 | 800 | 0,00 | 0,180162 | 430,645 | 15,19888 |
| 1000 | 4 | 0,09181 | 0,18 | 0,14 | 0,8 | 0,5 | 5 | 800 | 0,00 | 0,179041 | 445,8439 | 11,52994 |
| 1000 | 5 | 0,08797 | 0,18 | 0,14 | 0,83333 | 0,5 | 5 | 800 | 0,00 | 0,177806 | 457,3738 | 9,446706 |
| 1000 | 6 | 0,08522 | 0,18 | 0,14 | 0,85714 | 0,5 | 5 | 800 | 0,00 | 0,176505 | 466,8205 | 8,154973 |
| 1000 | 7 | 0,08315 | 0,18 | 0,14 | 0,875 | 0,5 | 5 | 800 | 0,00 | 0,175162 | 474,9755 | 7,302458 |
| 1000 | 8 | 0,08153 | 0,18 | 0,14 | 0,88889 | 0,5 | 5 | 800 | 0,00 | 0,173792 | 482,278 | 6,713275 |
| 1000 | 9 | 0,08024 | 0,18 | 0,14 | 0,9 | 0,5 | 5 | 800 | 0,00 | 0,172401 | 488,9912 | 6,291579 |
| 1000 | 10 | 0,07918 | 0,18 | 0,14 | 0,90909 | 0,5 | 5 | 800 | 0,00 | 0,170996 | 495,2828 |
Table 25. Dependence of NPV and DNPV on leverage level L at fixed levels of tax on profit rates t for 5-year project at t=0.6.
| I | L | WACC | Ko | Kd | Wd | t | n | NOI | BFO | Ke | NPV | ∆NPV |
| 1000 | 0 | 0,18 | 0,18 | 0,14 | 0 | 0,6 | 5 | 800 | 0,00 | 0,18 | 0,694727 | 160,0655 |
| 1000 | 1 | 0,11454 | 0,18 | 0,14 | 0,5 | 0,6 | 5 | 800 | 0,00 | 0,173086 | 160,7602 | 70,95083 |
| 1000 | 2 | 0,09181 | 0,18 | 0,14 | 0,66667 | 0,6 | 5 | 800 | 0,00 | 0,163424 | 231,711 | 49,78654 |
| 1000 | 3 | 0,08024 | 0,18 | 0,14 | 0,75 | 0,6 | 5 | 800 | 0,00 | 0,15296 | 281,4976 | 42,12961 |
| 1000 | 4 | 0,07323 | 0,18 | 0,14 | 0,8 | 0,6 | 5 | 800 | 0,00 | 0,142153 | 323,6272 | 39,00243 |
| 1000 | 5 | 0,06853 | 0,18 | 0,14 | 0,83333 | 0,6 | 5 | 800 | 0,00 | 0,131168 | 362,6296 | 37,85743 |
| 1000 | 6 | 0,06515 | 0,18 | 0,14 | 0,85714 | 0,6 | 5 | 800 | 0,00 | 0,120078 | 400,487 | 37,74625 |
| 1000 | 7 | 0,06262 | 0,18 | 0,14 | 0,875 | 0,6 | 5 | 800 | 0,00 | 0,108922 | 438,2333 | 38,25211 |
| 1000 | 8 | 0,06064 | 0,18 | 0,14 | 0,88889 | 0,6 | 5 | 800 | 0,00 | 0,097721 | 476,4854 | 39,17065 |
| 1000 | 9 | 0,05905 | 0,18 | 0,14 | 0,9 | 0,6 | 5 | 800 | 0,00 | 0,086488 | 515,656 | 40,39427 |
| 1000 | 10 | 0,05775 | 0,18 | 0,14 | 0,90909 | 0,6 | 5 | 800 | 0,00 | 0,075231 | 556,0503 |
Table 26. Dependence of NPV and DNPV on leverage level L at fixed levels of tax on profit rates t for 5-year project at t=0.7.
| I | L | WACC | Ko | Kd | Wd | t | n | NOI | BFO | Ke | NPV | ∆NPV |
| 1000 | 0 | 0,18 | 0,18 | 0,14 | 0 | 0,7 | 5 | 800 | 0,00 | 0,18 | -249,479 | 195,3877 |
| 1000 | 1 | 0,10324 | 0,18 | 0,14 | 0,5 | 0,7 | 5 | 800 | 0,00 | 0,16448 | -54,0913 | 92,40829 |
| 1000 | 2 | 0,07635 | 0,18 | 0,14 | 0,66667 | 0,7 | 5 | 800 | 0,00 | 0,145057 | 38,31702 | 69,68464 |
| 1000 | 3 | 0,06262 | 0,18 | 0,14 | 0,75 | 0,7 | 5 | 800 | 0,00 | 0,124461 | 108,0017 | 63,19622 |
| 1000 | 4 | 0,05427 | 0,18 | 0,14 | 0,8 | 0,7 | 5 | 800 | 0,00 | 0,103355 | 171,1979 | 62,43475 |
| 1000 | 5 | 0,04866 | 0,18 | 0,14 | 0,83333 | 0,7 | 5 | 800 | 0,00 | 0,081982 | 233,6326 | 64,46977 |
| 1000 | 6 | 0,04464 | 0,18 | 0,14 | 0,85714 | 0,7 | 5 | 800 | 0,00 | 0,060453 | 298,1024 | 68,26526 |
| 1000 | 7 | 0,0416 | 0,18 | 0,14 | 0,875 | 0,7 | 5 | 800 | 0,00 | 0,038822 | 366,3677 | 73,42597 |
| 1000 | 8 | 0,03924 | 0,18 | 0,14 | 0,88889 | 0,7 | 5 | 800 | 0,00 | 0,017124 | 439,7936 | 79,82524 |
| 1000 | 9 | 0,03734 | 0,18 | 0,14 | 0,9 | 0,7 | 5 | 800 | 0,00 | -0,00462 | 519,6189 | 87,47314 |
| 1000 | 10 | 0,03578 | 0,18 | 0,14 | 0,90909 | 0,7 | 5 | 800 | 0,00 | -0,0264 | 607,092 |
Table 27. Dependence of NPV and DNPV on leverage level L at fixed levels of tax on profit rates t for 5-year project at t=0.8.
| I | L | WACC | Ko | Kd | Wd | t | n | NOI | BFO | Ke | NPV | ∆NPV |
| 1000 | 0 | 0,18 | 0,18 | 0,14 | 0 | 0,8 | 5 | 800 | 0,00 | 0,18 | -499,653 | 221,1945 |
| 1000 | 1 | 0,09181 | 0,18 | 0,14 | 0,5 | 0,8 | 5 | 800 | 0,00 | 0,155616 | -278,458 | 103,2179 |
| 1000 | 2 | 0,06064 | 0,18 | 0,14 | 0,66667 | 0,8 | 5 | 800 | 0,00 | 0,125907 | -175,24 | 78,69376 |
| 1000 | 3 | 0,04464 | 0,18 | 0,14 | 0,75 | 0,8 | 5 | 800 | 0,00 | 0,094544 | -96,5465 | 73,65304 |
| 1000 | 4 | 0,03489 | 0,18 | 0,14 | 0,8 | 0,8 | 5 | 800 | 0,00 | 0,062454 | -22,8934 | 76,11182 |
| 1000 | 5 | 0,02833 | 0,18 | 0,14 | 0,83333 | 0,8 | 5 | 800 | 0,00 | 0,029979 | 53,21839 | 82,93806 |
| 1000 | 6 | 0,02361 | 0,18 | 0,14 | 0,85714 | 0,8 | 5 | 800 | 0,00 | -0,00272 | 136,1565 | 93,28915 |
| 1000 | 7 | 0,02005 | 0,18 | 0,14 | 0,875 | 0,8 | 5 | 800 | 0,00 | -0,03557 | 229,4456 | 107,1925 |
| 1000 | 8 | 0,01728 | 0,18 | 0,14 | 0,88889 | 0,8 | 5 | 800 | 0,00 | -0,06852 | 336,6381 | 125,1636 |
| 1000 | 9 | 0,01505 | 0,18 | 0,14 | 0,9 | 0,8 | 5 | 800 | 0,00 | -0,10154 | 461,8017 | 148,1245 |
| 1000 | 10 | 0,01322 | 0,18 | 0,14 | 0,90909 | 0,8 | 5 | 800 | 0,00 | -0,13462 | 609,9262 |
Table 28. Dependence of NPV and DNPV on leverage level L at fixed levels of tax on profit rates t for 5-year project at t=0.9.
| I | L | WACC | Ko | Kd | Wd | t | n | NOI | BFO | Ke | NPV | ∆NPV |
| 1000 | 0 | 0,18 | 0,18 | 0,14 | 0 | 0,9 | 5 | 800 | 0,00 | 0,18 | -749,826 | 236,5329 |
| 1000 | 1 | 0,08024 | 0,18 | 0,14 | 0,5 | 0,9 | 5 | 800 | 0,00 | 0,14648 | -513,293 | 100,4127 |
| 1000 | 2 | 0,04464 | 0,18 | 0,14 | 0,66667 | 0,9 | 5 | 800 | 0,00 | 0,105908 | -412,881 | 71,49601 |
| 1000 | 3 | 0,02627 | 0,18 | 0,14 | 0,75 | 0,9 | 5 | 800 | 0,00 | 0,063074 | -341,385 | 65,36206 |
| 1000 | 4 | 0,01505 | 0,18 | 0,14 | 0,8 | 0,9 | 5 | 800 | 0,00 | 0,019228 | -276,023 | 68,55205 |
| 1000 | 5 | 0,00747 | 0,18 | 0,14 | 0,83333 | 0,9 | 5 | 800 | 0,00 | -0,02516 | -207,471 | 77,93497 |
| 1000 | 6 | 0,00202 | 0,18 | 0,14 | 0,85714 | 0,9 | 5 | 800 | 0,00 | -0,06987 | -129,536 | 93,29474 |
| 1000 | 7 | -0,0021 | 0,18 | 0,14 | 0,875 | 0,9 | 5 | 800 | 0,00 | -0,11479 | -36,2409 | 115,8841 |
| 1000 | 8 | -0,0053 | 0,18 | 0,14 | 0,88889 | 0,9 | 5 | 800 | 0,00 | -0,15985 | 79,64322 | 148,3017 |
| 1000 | 9 | -0,0079 | 0,18 | 0,14 | 0,9 | 0,9 | 5 | 800 | 0,00 | -0,20501 | 227,945 | 194,9563 |
| 1000 | 10 | -0,01 | 0,18 | 0,14 | 0,90909 | 0,9 | 5 | 800 | 0,00 | -0,25024 | 422,9012 |
2.2. Perpetuity Limit
In perpetuity limit ![]() (Мodigliani and Мiller limit) formula for NPV is as following
(Мodigliani and Мiller limit) formula for NPV is as following
![]() . (2)
. (2)
At constant value of investment capital (I = const), accounting ![]() ,
, ![]() , one gets
, one gets
![]() . (3)
. (3)
![]() , (4)
, (4)
here ![]() – leverage level ;
– leverage level ; ![]() – equity cost of leverage company (use the debt capital);
– equity cost of leverage company (use the debt capital); ![]() – equity cost of financially independent company.
– equity cost of financially independent company.
In the transition from the equation (3) to (4) we have used the formula for equity capital cost, received by Мodigliani and Мiller (Мodigliani and Мiller (1958, 1963, 1966)
![]() (5)
(5)
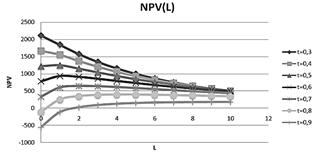
Figure 5. Dependence of NPV on leverage level L at fixed levels of tax on profit rates t for perpetuity project.
For perpetuity projects we get the following results (Tables 15-21, Figures 5 and 6).
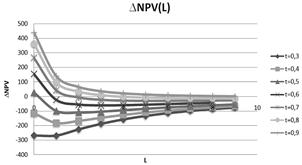
Figure 6. Dependence of DNPV on leverage level L at fixed levels of tax on profit rates t for perpetuity project.
2.3. The Effectiveness of the Investment Project from the Perspective of the Equity and Debt Holders
In this case we use the following expression for NPV (Brusov & Filatova, 2011; Brusov, Filatova, Eskindarov, et al., 2011; Brusov, Filatova, Orehova, et al., 2011; Brusov, Filatova, & Orekhova, 2013b; Filatova, Orehova, & Brusova, 2008; P.N. Brusov, T.V. Filatova and N.P. Orekhova (2014).
![]() (6)
(6)
Using it we calculate the dependence of NPV and DNPV on leverage level L at fixed levels of tax on profit rates t. 5-year project For 5-year projects we get the following results (Tables 22-28,Figures 7 and 8).
10-year project For 10-year projects we get the following results (Tables 29-35, Figures 9 and 10).
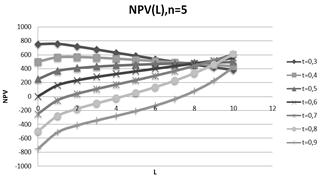
Figure 7. Dependence of NPV on leverage level L at fixed levels of tax on profit rates t for 5-year project.
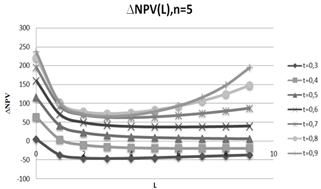
Figure 8. Dependence of DNPV on leverage level L at fixed levels of tax on profit rates t for 5-year project.
Table 29. Dependence of NPV and DNPV on leverage level L at fixed levels of tax on profit rates t for 10-year project at t=0.3.
| I | L | WACC | Ko | Kd | Wd | t | n | NOI | BFO | Ke | NPV | ∆NPV |
| 1000 | 0 | 0,18 | 0,18 | 0,14 | 0 | 0,3 | 10 | 800 | 0,00 | 0,18 | 1516,688 | -51,935 |
| 1000 | 1 | 0,14854 | 0,18 | 0,14 | 0,5 | 0,3 | 10 | 800 | 0,00 | 0,19907 | 1464,753 | -101,47 |
| 1000 | 2 | 0,13773 | 0,18 | 0,14 | 0,66667 | 0,3 | 10 | 800 | 0,00 | 0,217182 | 1363,283 | -104,843 |
| 1000 | 3 | 0,13226 | 0,18 | 0,14 | 0,75 | 0,3 | 10 | 800 | 0,00 | 0,235022 | 1258,441 | -100,263 |
| 1000 | 4 | 0,12895 | 0,18 | 0,14 | 0,8 | 0,3 | 10 | 800 | 0,00 | 0,252747 | 1158,178 | -93,8156 |
| 1000 | 5 | 0,12674 | 0,18 | 0,14 | 0,83333 | 0,3 | 10 | 800 | 0,00 | 0,270413 | 1064,362 | -87,1129 |
| 1000 | 6 | 0,12515 | 0,18 | 0,14 | 0,85714 | 0,3 | 10 | 800 | 0,00 | 0,288045 | 977,2493 | -80,6768 |
| 1000 | 7 | 0,12396 | 0,18 | 0,14 | 0,875 | 0,3 | 10 | 800 | 0,00 | 0,305654 | 896,5725 | -74,6812 |
| 1000 | 8 | 0,12303 | 0,18 | 0,14 | 0,88889 | 0,3 | 10 | 800 | 0,00 | 0,323249 | 821,8913 | -69,1705 |
| 1000 | 9 | 0,12228 | 0,18 | 0,14 | 0,9 | 0,3 | 10 | 800 | 0,00 | 0,340834 | 752,7207 | -64,1369 |
| 1000 | 10 | 0,12167 | 0,18 | 0,14 | 0,90909 | 0,3 | 10 | 800 | 0,00 | 0,358411 | 688,5839 |
Table 30. Dependence of NPV and DNPV on leverage level L at fixed levels of tax on profit rates t for 10-year project at t=0.4.
| I | L | WACC | Ko | Kd | Wd | t | n | NOI | BFO | Ke | NPV | ∆NPV |
| 1000 | 0 | 0,18 | 0,18 | 0,14 | 0 | 0,4 | 10 | 800 | 0,00 | 0,18 | 1157,161 | 61,10029 |
| 1000 | 1 | 0,13773 | 0,18 | 0,14 | 0,5 | 0,4 | 10 | 800 | 0,00 | 0,191455 | 1218,262 | -18,517 |
| 1000 | 2 | 0,12303 | 0,18 | 0,14 | 0,66667 | 0,4 | 10 | 800 | 0,00 | 0,201083 | 1199,745 | -35,7995 |
| 1000 | 3 | 0,11554 | 0,18 | 0,14 | 0,75 | 0,4 | 10 | 800 | 0,00 | 0,210169 | 1163,945 | -41,1321 |
| 1000 | 4 | 0,111 | 0,18 | 0,14 | 0,8 | 0,4 | 10 | 800 | 0,00 | 0,21902 | 1122,813 | -42,6427 |
| 1000 | 5 | 0,10796 | 0,18 | 0,14 | 0,83333 | 0,4 | 10 | 800 | 0,00 | 0,22775 | 1080,17 | -42,6081 |
| 1000 | 6 | 0,10577 | 0,18 | 0,14 | 0,85714 | 0,4 | 10 | 800 | 0,00 | 0,236408 | 1037,562 | -41,8669 |
| 1000 | 7 | 0,10413 | 0,18 | 0,14 | 0,875 | 0,4 | 10 | 800 | 0,00 | 0,24502 | 995,6955 | -40,7844 |
| 1000 | 8 | 0,10284 | 0,18 | 0,14 | 0,88889 | 0,4 | 10 | 800 | 0,00 | 0,253602 | 954,9111 | -39,5386 |
| 1000 | 9 | 0,10182 | 0,18 | 0,14 | 0,9 | 0,4 | 10 | 800 | 0,00 | 0,262161 | 915,3725 | -38,2228 |
| 1000 | 10 | 0,10097 | 0,18 | 0,14 | 0,90909 | 0,4 | 10 | 800 | 0,00 | 0,270705 | 877,1497 |
Table 31. Dependence of NPV and DNPV on leverage level L at fixed levels of tax on profit rates t for 10-year project at t=0.5.
| I | L | WACC | Ko | Kd | Wd | t | n | NOI | BFO | Ke | NPV | ∆NPV |
| 1000 | 0 | 0,18 | 0,18 | 0,14 | 0 | 0,5 | 10 | 800 | 0,00 | 0,18 | 797,6345 | -44,2013 |
| 1000 | 1 | 0,14484 | 0,20056 | 0,14 | 0,5 | 0,5 | 10 | 800 | 0,00 | 0,219687 | 753,4333 | -104,707 |
| 1000 | 2 | 0,13178 | 0,20836 | 0,14 | 0,66667 | 0,5 | 10 | 800 | 0,00 | 0,255351 | 648,7259 | -103,671 |
| 1000 | 3 | 0,125 | 0,21253 | 0,14 | 0,75 | 0,5 | 10 | 800 | 0,00 | 0,290005 | 545,0552 | -93,6005 |
| 1000 | 4 | 0,12084 | 0,21513 | 0,14 | 0,8 | 0,5 | 10 | 800 | 0,00 | 0,32421 | 451,4547 | -82,6797 |
| 1000 | 5 | 0,11803 | 0,2169 | 0,14 | 0,83333 | 0,5 | 10 | 800 | 0,00 | 0,358168 | 368,775 | -72,7174 |
| 1000 | 6 | 0,116 | 0,21819 | 0,14 | 0,85714 | 0,5 | 10 | 800 | 0,00 | 0,391982 | 296,0576 | -64,0269 |
| 1000 | 7 | 0,11446 | 0,21917 | 0,14 | 0,875 | 0,5 | 10 | 800 | 0,00 | 0,425702 | 232,0307 | -56,5734 |
| 1000 | 8 | 0,11326 | 0,21994 | 0,14 | 0,88889 | 0,5 | 10 | 800 | 0,00 | 0,459362 | 175,4573 | -50,1953 |
| 1000 | 9 | 0,1123 | 0,22055 | 0,14 | 0,9 | 0,5 | 10 | 800 | 0,00 | 0,492979 | 125,262 | -44,7383 |
| 1000 | 10 | 0,11151 | 0,22106 | 0,14 | 0,90909 | 0,5 | 10 | 800 | 0,00 | 0,526564 | 80,52365 |
Table 32. Dependence of NPV and DNPV on leverage level L at fixed levels of tax on profit rates t for 10-year project at t=0.6.
| I | L | WACC | Ko | Kd | Wd | t | n | NOI | BFO | Ke | NPV | ∆NPV |
| 1000 | 0 | 0,18 | 0,18 | 0,14 | 0 | 0,6 | 10 | 800 | 0,00 | 0,18 | 438,1076 | 244,5668 |
| 1000 | 1 | 0,11554 | 0,18 | 0,14 | 0,5 | 0,6 | 10 | 800 | 0,00 | 0,175084 | 682,6744 | 125,4304 |
| 1000 | 2 | 0,09247 | 0,18 | 0,14 | 0,66667 | 0,6 | 10 | 800 | 0,00 | 0,165407 | 808,1048 | 101,3662 |
| 1000 | 3 | 0,08054 | 0,18 | 0,14 | 0,75 | 0,6 | 10 | 800 | 0,00 | 0,154162 | 909,471 | 95,93652 |
| 1000 | 4 | 0,07324 | 0,18 | 0,14 | 0,8 | 0,6 | 10 | 800 | 0,00 | 0,142206 | 1005,408 | 97,02629 |
| 1000 | 5 | 0,06831 | 0,18 | 0,14 | 0,83333 | 0,6 | 10 | 800 | 0,00 | 0,129869 | 1102,434 | 101,3309 |
| 1000 | 6 | 0,06476 | 0,18 | 0,14 | 0,85714 | 0,6 | 10 | 800 | 0,00 | 0,117304 | 1203,765 | 107,7015 |
| 1000 | 7 | 0,06207 | 0,18 | 0,14 | 0,875 | 0,6 | 10 | 800 | 0,00 | 0,10459 | 1311,466 | 115,7055 |
| 1000 | 8 | 0,05998 | 0,18 | 0,14 | 0,88889 | 0,6 | 10 | 800 | 0,00 | 0,091775 | 1427,172 | 125,2046 |
| 1000 | 9 | 0,05829 | 0,18 | 0,14 | 0,9 | 0,6 | 10 | 800 | 0,00 | 0,078888 | 1552,376 | 136,2059 |
| 1000 | 10 | 0,0569 | 0,18 | 0,14 | 0,90909 | 0,6 | 10 | 800 | 0,00 | 0,065947 | 1688,582 |
Table 33. Dependence of NPV and DNPV on leverage level L at fixed levels of tax on profit rates t for 10-year project at t=0.7.
| I | L | WACC | Ko | Kd | Wd | t | n | NOI | BFO | Ke | NPV | ∆NPV |
| 1000 | 0 | 0,18 | 0,18 | 0,14 | 0 | 0,7 | 10 | 800 | 0,00 | 0,18 | 78,58071 | 310,4744 |
| 1000 | 1 | 0,10413 | 0,18 | 0,14 | 0,5 | 0,7 | 10 | 800 | 0,00 | 0,166255 | 389,0551 | 177,1979 |
| 1000 | 2 | 0,0765 | 0,18 | 0,14 | 0,66667 | 0,7 | 10 | 800 | 0,00 | 0,145497 | 566,253 | 160,5402 |
| 1000 | 3 | 0,06207 | 0,18 | 0,14 | 0,75 | 0,7 | 10 | 800 | 0,00 | 0,122295 | 726,7932 | 169,9063 |
| 1000 | 4 | 0,05319 | 0,18 | 0,14 | 0,8 | 0,7 | 10 | 800 | 0,00 | 0,097953 | 896,6995 | 191,9196 |
| 1000 | 5 | 0,04716 | 0,18 | 0,14 | 0,83333 | 0,7 | 10 | 800 | 0,00 | 0,072986 | 1088,619 | 224,1724 |
| 1000 | 6 | 0,04281 | 0,18 | 0,14 | 0,85714 | 0,7 | 10 | 800 | 0,00 | 0,04764 | 1312,791 | 267,4019 |
| 1000 | 7 | 0,03951 | 0,18 | 0,14 | 0,875 | 0,7 | 10 | 800 | 0,00 | 0,022047 | 1580,193 | 323,9861 |
| 1000 | 8 | 0,03692 | 0,18 | 0,14 | 0,88889 | 0,7 | 10 | 800 | 0,00 | -0,00372 | 1904,18 | 397,7601 |
| 1000 | 9 | 0,03484 | 0,18 | 0,14 | 0,9 | 0,7 | 10 | 800 | 0,00 | -0,0296 | 2301,94 | 494,3094 |
| 1000 | 10 | 0,03313 | 0,18 | 0,14 | 0,90909 | 0,7 | 10 | 800 | 0,00 | -0,05558 | 2796,249 |
Table 34. Dependence of NPV and DNPV on leverage level L at fixed levels of tax on profit rates t for 10-year project at t=0.8.
| I | L | WACC | Ko | Kd | Wd | t | n | NOI | BFO | Ke | NPV | ∆NPV |
| 1000 | 0 | 0,18 | 0,18 | 0,14 | 0 | 0,8 | 10 | 800 | 0,00 | 0,18 | -280,946 | 355,2633 |
| 1000 | 1 | 0,09247 | 0,18 | 0,14 | 0,5 | 0,8 | 10 | 800 | 0,00 | 0,156938 | 74,31716 | 204,8466 |
| 1000 | 2 | 0,05998 | 0,18 | 0,14 | 0,66667 | 0,8 | 10 | 800 | 0,00 | 0,123925 | 279,1638 | 198,4863 |
| 1000 | 3 | 0,04281 | 0,18 | 0,14 | 0,75 | 0,8 | 10 | 800 | 0,00 | 0,087223 | 477,6501 | 232,7806 |
| 1000 | 4 | 0,03215 | 0,18 | 0,14 | 0,8 | 0,8 | 10 | 800 | 0,00 | 0,048741 | 710,4306 | 297,8303 |
| 1000 | 5 | 0,02488 | 0,18 | 0,14 | 0,83333 | 0,8 | 10 | 800 | 0,00 | 0,009262 | 1008,261 | 400,9259 |
| 1000 | 6 | 0,0196 | 0,18 | 0,14 | 0,85714 | 0,8 | 10 | 800 | 0,00 | -0,03083 | 1409,187 | 560,3743 |
| 1000 | 7 | 0,01558 | 0,18 | 0,14 | 0,875 | 0,8 | 10 | 800 | 0,00 | -0,07133 | 1969,561 | 809,4944 |
| 1000 | 8 | 0,01243 | 0,18 | 0,14 | 0,88889 | 0,8 | 10 | 800 | 0,00 | -0,11211 | 2779,056 | 1207,425 |
| 1000 | 9 | 0,00989 | 0,18 | 0,14 | 0,9 | 0,8 | 10 | 800 | 0,00 | -0,1531 | 3986,481 | 1861,112 |
| 1000 | 10 | 0,0078 | 0,18 | 0,14 | 0,90909 | 0,8 | 10 | 800 | 0,00 | -0,19424 | 5847,593 |
Table 35. Dependence of NPV and DNPV on leverage level L at fixed levels of tax on profit rates t for 10-year project at t=0.9.
| I | L | WACC | Ko | Kd | Wd | t | n | NOI | BFO | Ke | NPV | ∆NPV |
| 1000 | 0 | 0,18 | 0,18 | 0,14 | 0 | 0,9 | 10 | 800 | 0,00 | 0,18 | -640,473 | 375,0978 |
| 1000 | 1 | 0,08054 | 0,18 | 0,14 | 0,5 | 0,9 | 10 | 800 | 0,00 | 0,147081 | -265,375 | 194,2145 |
| 1000 | 2 | 0,04281 | 0,18 | 0,14 | 0,66667 | 0,9 | 10 | 800 | 0,00 | 0,100417 | -71,1609 | 186,9461 |
| 1000 | 3 | 0,02258 | 0,18 | 0,14 | 0,75 | 0,9 | 10 | 800 | 0,00 | 0,048303 | 115,7852 | 239,586 |
| 1000 | 4 | 0,00989 | 0,18 | 0,14 | 0,8 | 0,9 | 10 | 800 | 0,00 | -0,00655 | 355,3712 | 356,4744 |
| 1000 | 5 | 0,00117 | 0,18 | 0,14 | 0,83333 | 0,9 | 10 | 800 | 0,00 | -0,06297 | 711,8456 | 583,6021 |
| 1000 | 6 | -0,0052 | 0,18 | 0,14 | 0,85714 | 0,9 | 10 | 800 | 0,00 | -0,12039 | 1295,448 | 1032,383 |
| 1000 | 7 | -0,0101 | 0,18 | 0,14 | 0,875 | 0,9 | 10 | 800 | 0,00 | -0,17847 | 2327,831 | 1967,211 |
| 1000 | 8 | -0,0139 | 0,18 | 0,14 | 0,88889 | 0,9 | 10 | 800 | 0,00 | -0,23701 | 4295,041 | 4054,338 |
| 1000 | 9 | -0,017 | 0,18 | 0,14 | 0,9 | 0,9 | 10 | 800 | 0,00 | -0,2959 | 8349,379 | 9115,336 |
| 1000 | 10 | -0,0195 | 0,18 | 0,14 | 0,90909 | 0,9 | 10 | 800 | 0,00 | -0,35504 | 17464,72 |
Table 36. Dependence of NPV and DNPV on tax on profit rate t at fixed leverage level L for 5-year project at L=0.
| I | L | WACC | Ko | Kd | Wd | t | n | NOI | BFO | Ke | NPV | ∆NPV |
| 1000 | 0 | 0,18 | 0,18 | 0,14 | 0 | 0 | 5 | 800 | 0,00 | 0,18 | 1501,74 | -250,174 |
| 1000 | 0 | 0,18 | 0,18 | 0,14 | 0 | 0,1 | 5 | 800 | 0,00 | 0,18 | 1251,56 | -250,174 |
| 1000 | 0 | 0,18 | 0,18 | 0,14 | 0 | 0,2 | 5 | 800 | 0,00 | 0,18 | 1001,39 | -250,174 |
| 1000 | 0 | 0,18 | 0,18 | 0,14 | 0 | 0,3 | 5 | 800 | 0,00 | 0,18 | 751,22 | -250,174 |
| 1000 | 0 | 0,18 | 0,18 | 0,14 | 0 | 0,4 | 5 | 800 | 0,00 | 0,18 | 501,04 | -250,174 |
| 1000 | 0 | 0,18 | 0,18 | 0,14 | 0 | 0,5 | 5 | 800 | 0,00 | 0,18 | 250,87 | -250,174 |
| 1000 | 0 | 0,18 | 0,18 | 0,14 | 0 | 0,6 | 5 | 800 | 0,00 | 0,18 | 0,69 | -250,174 |
| 1000 | 0 | 0,18 | 0,18 | 0,14 | 0 | 0,7 | 5 | 800 | 0,00 | 0,18 | -249,48 | -250,174 |
| 1000 | 0 | 0,18 | 0,18 | 0,14 | 0 | 0,8 | 5 | 800 | 0,00 | 0,18 | -499,65 | -250,174 |
| 1000 | 0 | 0,18 | 0,18 | 0,14 | 0 | 0,9 | 5 | 800 | 0,00 | 0,18 | -749,83 | -250,174 |
| 1000 | 0 | 0,18 | 0,18 | 0,14 | 0 | 1 | 5 | 800 | 0,00 | 0,18 | -1000,00 |
Table 37. Dependence of NPV and DNPV on tax on profit rate t at fixed leverage level L for 5-year project at L=2.
| I | L | WACC | Ko | Kd | Wd | t | n | NOI | BFO | Ke | NPV | ∆NPV |
| 1000 | 2 | 0,18 | 0,18 | 0,14 | 0,66667 | 0 | 5 | 800 | 0,00 | 0,26 | 1108,06 | -120,983 |
| 1000 | 2 | 0,16577 | 0,18 | 0,14 | 0,66667 | 0,1 | 5 | 800 | 0,00 | 0,245315 | 987,07 | -129,204 |
| 1000 | 2 | 0,15137 | 0,18 | 0,14 | 0,66667 | 0,2 | 5 | 800 | 0,00 | 0,230116 | 857,87 | -138,59 |
| 1000 | 2 | 0,13679 | 0,18 | 0,14 | 0,66667 | 0,3 | 5 | 800 | 0,00 | 0,214367 | 719,28 | -149,372 |
| 1000 | 2 | 0,12201 | 0,18 | 0,14 | 0,66667 | 0,4 | 5 | 800 | 0,00 | 0,19803 | 569,91 | -161,839 |
| 1000 | 2 | 0,10702 | 0,18 | 0,14 | 0,66667 | 0,5 | 5 | 800 | 0,00 | 0,181065 | 408,07 | -176,357 |
| 1000 | 2 | 0,09181 | 0,18 | 0,14 | 0,66667 | 0,6 | 5 | 800 | 0,00 | 0,163424 | 231,71 | -193,394 |
| 1000 | 2 | 0,07635 | 0,18 | 0,14 | 0,66667 | 0,7 | 5 | 800 | 0,00 | 0,145057 | 38,32 | -213,557 |
| 1000 | 2 | 0,06064 | 0,18 | 0,14 | 0,66667 | 0,8 | 5 | 800 | 0,00 | 0,125907 | -175,24 | -237,64 |
| 1000 | 2 | 0,04464 | 0,18 | 0,14 | 0,66667 | 0,9 | 5 | 800 | 0,00 | 0,105908 | -412,88 | -266,698 |
| 1000 | 2 | 0,02833 | 0,18 | 0,14 | 0,66667 | 1 | 5 | 800 | 0,00 | 0,084989 | -679,58 |
Table 38. Dependence of NPV and DNPV on tax on profit rate t at fixed leverage level L for 5-year project at L=4.
| I | L | WACC | Ko | Kd | Wd | t | n | NOI | BFO | Ke | NPV | ∆NPV |
| 1000 | 4 | 0,18 | 0,18 | 0,14 | 0,8 | 0 | 5 | 800 | 0,00 | 0,34 | 808,33 | -51,044 |
| 1000 | 4 | 0,16291 | 0,18 | 0,14 | 0,8 | 0,1 | 5 | 800 | 0,00 | 0,31053 | 757,29 | -59,2842 |
| 1000 | 4 | 0,14556 | 0,18 | 0,14 | 0,8 | 0,2 | 5 | 800 | 0,00 | 0,279807 | 698,00 | -69,6148 |
| 1000 | 4 | 0,12795 | 0,18 | 0,14 | 0,8 | 0,3 | 5 | 800 | 0,00 | 0,24773 | 628,39 | -82,763 |
| 1000 | 4 | 0,11004 | 0,18 | 0,14 | 0,8 | 0,4 | 5 | 800 | 0,00 | 0,214184 | 545,62 | -99,7794 |
| 1000 | 4 | 0,09181 | 0,18 | 0,14 | 0,8 | 0,5 | 5 | 800 | 0,00 | 0,179041 | 445,84 | -122,217 |
| 1000 | 4 | 0,07323 | 0,18 | 0,14 | 0,8 | 0,6 | 5 | 800 | 0,00 | 0,142153 | 323,63 | -152,429 |
| 1000 | 4 | 0,05427 | 0,18 | 0,14 | 0,8 | 0,7 | 5 | 800 | 0,00 | 0,103355 | 171,20 | -194,091 |
| 1000 | 4 | 0,03489 | 0,18 | 0,14 | 0,8 | 0,8 | 5 | 800 | 0,00 | 0,062454 | -22,89 | -253,129 |
| 1000 | 4 | 0,01505 | 0,18 | 0,14 | 0,8 | 0,9 | 5 | 800 | 0,00 | 0,019228 | -276,02 | -339,472 |
| 1000 | 4 | -0,0053 | 0,18 | 0,14 | 0,8 | 1 | 5 | 800 | 0,00 | -0,02658 | -615,49 |
Table 39. Dependence of NPV and DNPV on tax on profit rate t at fixed leverage level L for 5-year project at L=6.
| I | L | WACC | Ko | Kd | Wd | t | n | NOI | BFO | Ke | NPV | ∆NPV |
| 1000 | 6 | 0,18 | 0,18 | 0,14 | 0,85714 | 0 | 5 | 800 | 0,00 | 0,42 | 574,85 | -6,23744 |
| 1000 | 6 | 0,16168 | 0,18 | 0,14 | 0,85714 | 0,1 | 5 | 800 | 0,00 | 0,375729 | 568,61 | -11,31 |
| 1000 | 6 | 0,14306 | 0,18 | 0,14 | 0,85714 | 0,2 | 5 | 800 | 0,00 | 0,329434 | 557,30 | -18,3975 |
| 1000 | 6 | 0,12413 | 0,18 | 0,14 | 0,85714 | 0,3 | 5 | 800 | 0,00 | 0,280937 | 538,90 | -28,5544 |
| 1000 | 6 | 0,10486 | 0,18 | 0,14 | 0,85714 | 0,4 | 5 | 800 | 0,00 | 0,230037 | 510,35 | -43,5294 |
| 1000 | 6 | 0,08522 | 0,18 | 0,14 | 0,85714 | 0,5 | 5 | 800 | 0,00 | 0,176505 | 466,82 | -66,3335 |
| 1000 | 6 | 0,06515 | 0,18 | 0,14 | 0,85714 | 0,6 | 5 | 800 | 0,00 | 0,120078 | 400,49 | -102,385 |
| 1000 | 6 | 0,04464 | 0,18 | 0,14 | 0,85714 | 0,7 | 5 | 800 | 0,00 | 0,060453 | 298,10 | -161,946 |
| 1000 | 6 | 0,02361 | 0,18 | 0,14 | 0,85714 | 0,8 | 5 | 800 | 0,00 | -0,00272 | 136,16 | -265,692 |
| 1000 | 6 | 0,00202 | 0,18 | 0,14 | 0,85714 | 0,9 | 5 | 800 | 0,00 | -0,06987 | -129,54 | -458,495 |
| 1000 | 6 | -0,0202 | 0,18 | 0,14 | 0,85714 | 1 | 5 | 800 | 0,00 | -0,14147 | -588,03 |
Table 40. Dependence of NPV and DNPV on tax on profit rate t at fixed leverage level L for 5-year project at L=8.
| I | L | WACC | Ko | Kd | Wd | t | n | NOI | BFO | Ke | NPV | ∆NPV |
| 1000 | 8 | 0,18 | 0,18 | 0,14 | 0,88889 | 0 | 5 | 800 | 0,00 | 0,5 | 389,30 | 23,47489 |
| 1000 | 8 | 0,16099 | 0,18 | 0,14 | 0,88889 | 0,1 | 5 | 800 | 0,00 | 0,440923 | 412,78 | 22,6083 |
| 1000 | 8 | 0,14167 | 0,18 | 0,14 | 0,88889 | 0,2 | 5 | 800 | 0,00 | 0,379039 | 435,38 | 20,71462 |
| 1000 | 8 | 0,12201 | 0,18 | 0,14 | 0,88889 | 0,3 | 5 | 800 | 0,00 | 0,314091 | 456,10 | 16,88106 |
| 1000 | 8 | 0,10198 | 0,18 | 0,14 | 0,88889 | 0,4 | 5 | 800 | 0,00 | 0,245786 | 472,98 | 9,298693 |
| 1000 | 8 | 0,08153 | 0,18 | 0,14 | 0,88889 | 0,5 | 5 | 800 | 0,00 | 0,173792 | 482,28 | -5,79258 |
| 1000 | 8 | 0,06064 | 0,18 | 0,14 | 0,88889 | 0,6 | 5 | 800 | 0,00 | 0,097721 | 476,49 | -36,6918 |
| 1000 | 8 | 0,03924 | 0,18 | 0,14 | 0,88889 | 0,7 | 5 | 800 | 0,00 | 0,017124 | 439,79 | -103,156 |
| 1000 | 8 | 0,01728 | 0,18 | 0,14 | 0,88889 | 0,8 | 5 | 800 | 0,00 | -0,06852 | 336,64 | -256,995 |
| 1000 | 8 | -0,0053 | 0,18 | 0,14 | 0,88889 | 0,9 | 5 | 800 | 0,00 | -0,15985 | 79,64 | -652,415 |
| 1000 | 8 | -0,0286 | 0,18 | 0,14 | 0,88889 | 1 | 5 | 800 | 0,00 | -0,25759 | -572,77 |
Table 41. Dependence of NPV and DNPV on tax on profit rate t at fixed leverage level L for 5-year project at L=10.
| I | L | WACC | Ko | Kd | Wd | t | n | NOI | BFO | Ke | NPV | ∆NPV |
| 1000 | 10 | 0,18 | 0,18 | 0,14 | 0,90909 | 0 | 5 | 800 | 0,00 | 0,58 | 239,23 | 43,49836 |
| 1000 | 10 | 0,16056 | 0,18 | 0,14 | 0,90909 | 0,1 | 5 | 800 | 0,00 | 0,506115 | 282,73 | 46,87962 |
| 1000 | 10 | 0,14078 | 0,18 | 0,14 | 0,90909 | 0,2 | 5 | 800 | 0,00 | 0,428635 | 329,61 | 50,87829 |
| 1000 | 10 | 0,12066 | 0,18 | 0,14 | 0,90909 | 0,3 | 5 | 800 | 0,00 | 0,34722 | 380,49 | 55,32552 |
| 1000 | 10 | 0,10014 | 0,18 | 0,14 | 0,90909 | 0,4 | 5 | 800 | 0,00 | 0,261488 | 435,81 | 59,47085 |
| 1000 | 10 | 0,07918 | 0,18 | 0,14 | 0,90909 | 0,5 | 5 | 800 | 0,00 | 0,170996 | 495,28 | 60,76747 |
| 1000 | 10 | 0,05775 | 0,18 | 0,14 | 0,90909 | 0,6 | 5 | 800 | 0,00 | 0,075231 | 556,05 | 51,04171 |
| 1000 | 10 | 0,03578 | 0,18 | 0,14 | 0,90909 | 0,7 | 5 | 800 | 0,00 | -0,0264 | 607,09 | 2,834166 |
| 1000 | 10 | 0,01322 | 0,18 | 0,14 | 0,90909 | 0,8 | 5 | 800 | 0,00 | -0,13462 | 609,93 | -187,024 |
| 1000 | 10 | -0,01 | 0,18 | 0,14 | 0,90909 | 0,9 | 5 | 800 | 0,00 | -0,25024 | 422,90 | -985,964 |
| 1000 | 10 | -0,034 | 0,18 | 0,14 | 0,90909 | 1 | 5 | 800 | 0,00 | -0,37429 | -563,06 |
Table 42. Dependence of NPV and DNPV on tax on profit rate t at fixed leverage level L for 10-year project at L=0.
| I | L | WACC | Ko | Kd | Wd | t | n | NOI | BFO | Ke | NPV | ∆NPV |
| 1000 | 0 | 0,18 | 0,18 | 0,14 | 0 | 0 | 10 | 800 | 0,00 | 0,18 | 2595,27 | -359,527 |
| 1000 | 0 | 0,18 | 0,18 | 0,14 | 0 | 0,1 | 10 | 800 | 0,00 | 0,18 | 2235,74 | -359,527 |
| 1000 | 0 | 0,18 | 0,18 | 0,14 | 0 | 0,2 | 10 | 800 | 0,00 | 0,18 | 1876,22 | -359,527 |
| 1000 | 0 | 0,18 | 0,18 | 0,14 | 0 | 0,3 | 10 | 800 | 0,00 | 0,18 | 1516,69 | -359,527 |
| 1000 | 0 | 0,18 | 0,18 | 0,14 | 0 | 0,4 | 10 | 800 | 0,00 | 0,18 | 1157,16 | -359,527 |
| 1000 | 0 | 0,18 | 0,18 | 0,14 | 0 | 0,5 | 10 | 800 | 0,00 | 0,18 | 797,63 | -359,527 |
| 1000 | 0 | 0,18 | 0,18 | 0,14 | 0 | 0,6 | 10 | 800 | 0,00 | 0,18 | 438,11 | -359,527 |
| 1000 | 0 | 0,18 | 0,18 | 0,14 | 0 | 0,7 | 10 | 800 | 0,00 | 0,18 | 78,58 | -359,527 |
| 1000 | 0 | 0,18 | 0,18 | 0,14 | 0 | 0,8 | 10 | 800 | 0,00 | 0,18 | -280,95 | -359,527 |
| 1000 | 0 | 0,18 | 0,18 | 0,14 | 0 | 0,9 | 10 | 800 | 0,00 | 0,18 | -640,47 | -359,527 |
| 1000 | 0 | 0,18 | 0,18 | 0,14 | 0 | 1 | 10 | 800 | 0,00 | 0,18 | -1000,00 |
Table 43. Dependence of NPV and DNPV on tax on profit rate t at fixed leverage level L for 10-year project at L=2.
| I | L | WACC | Ko | Kd | Wd | t | n | NOI | BFO | Ke | NPV | ∆NPV |
| 1000 | 2 | 0,18 | 0,18 | 0,14 | 0,66667 | 0 | 10 | 800 | 0,00 | 0,26 | 1771,84 | -125,137 |
| 1000 | 2 | 0,16618 | 0,18 | 0,14 | 0,66667 | 0,1 | 10 | 800 | 0,00 | 0,24654 | 1646,71 | -135,437 |
| 1000 | 2 | 0,1521 | 0,18 | 0,14 | 0,66667 | 0,2 | 10 | 800 | 0,00 | 0,232299 | 1511,27 | -147,987 |
| 1000 | 2 | 0,13773 | 0,18 | 0,14 | 0,66667 | 0,3 | 10 | 800 | 0,00 | 0,217182 | 1363,28 | -163,538 |
| 1000 | 2 | 0,12303 | 0,18 | 0,14 | 0,66667 | 0,4 | 10 | 800 | 0,00 | 0,201083 | 1199,74 | -183,17 |
| 1000 | 2 | 0,10796 | 0,18 | 0,14 | 0,66667 | 0,5 | 10 | 800 | 0,00 | 0,183875 | 1016,58 | -208,47 |
| 1000 | 2 | 0,09247 | 0,18 | 0,14 | 0,66667 | 0,6 | 10 | 800 | 0,00 | 0,165407 | 808,10 | -241,852 |
| 1000 | 2 | 0,0765 | 0,18 | 0,14 | 0,66667 | 0,7 | 10 | 800 | 0,00 | 0,145497 | 566,25 | -287,089 |
| 1000 | 2 | 0,05998 | 0,18 | 0,14 | 0,66667 | 0,8 | 10 | 800 | 0,00 | 0,123925 | 279,16 | -350,325 |
| 1000 | 2 | 0,04281 | 0,18 | 0,14 | 0,66667 | 0,9 | 10 | 800 | 0,00 | 0,100417 | -71,16 | -442,002 |
| 1000 | 2 | 0,02488 | 0,18 | 0,14 | 0,66667 | 1 | 10 | 800 | 0,00 | 0,074631 | -513,16 |
Table 44. Dependence of NPV and DNPV on tax on profit rate t at fixed leverage level L for 10-year project at L=4.
| I | L | WACC | Ko | Kd | Wd | t | n | NOI | BFO | Ke | NPV | ∆NPV |
| 1000 | 4 | 0,18 | 0,18 | 0,14 | 0,8 | 0 | 10 | 800 | 0,00 | 0,34 | 1226,89 | -475,625 |
| 1000 | 4 | 0,18316 | 0,20056 | 0,14 | 0,8 | 0,1 | 10 | 800 | 0,00 | 0,411801 | 751,26 | -139,495 |
| 1000 | 4 | 0,17256 | 0,20836 | 0,14 | 0,8 | 0,2 | 10 | 800 | 0,00 | 0,414791 | 611,77 | -74,4553 |
| 1000 | 4 | 0,15772 | 0,21253 | 0,14 | 0,8 | 0,3 | 10 | 800 | 0,00 | 0,396579 | 537,31 | -54,8815 |
| 1000 | 4 | 0,14072 | 0,21513 | 0,14 | 0,8 | 0,4 | 10 | 800 | 0,00 | 0,367589 | 482,43 | -52,0879 |
| 1000 | 4 | 0,12227 | 0,2169 | 0,14 | 0,8 | 0,5 | 10 | 800 | 0,00 | 0,331331 | 430,34 | -60,1971 |
| 1000 | 4 | 0,10261 | 0,21819 | 0,14 | 0,8 | 0,6 | 10 | 800 | 0,00 | 0,289071 | 370,14 | -80,4792 |
| 1000 | 4 | 0,08181 | 0,21917 | 0,14 | 0,8 | 0,7 | 10 | 800 | 0,00 | 0,241069 | 289,66 | -120,753 |
| 1000 | 4 | 0,0598 | 0,21994 | 0,14 | 0,8 | 0,8 | 10 | 800 | 0,00 | 0,186991 | 168,91 | -202,021 |
| 1000 | 4 | 0,0364 | 0,22055 | 0,14 | 0,8 | 0,9 | 10 | 800 | 0,00 | 0,126013 | -33,11 | -382,685 |
| 1000 | 4 | 0,01135 | 0,22106 | 0,14 | 0,8 | 1 | 10 | 800 | 0,00 | 0,056769 | -415,80 |
Table 45. Dependence of NPV and DNPV on tax on profit rate t at fixed leverage level L for 10-year project at L=6.
| I | L | WACC | Ko | Kd | Wd | t | n | NOI | BFO | Ke | NPV | ∆NPV |
| 1000 | 6 | 0,18 | 0,18 | 0,14 | 0,85714 | 0 | 10 | 800 | 0,00 | 0,42 | 847,62 | 37,06285 |
| 1000 | 6 | 0,16218 | 0,18 | 0,14 | 0,85714 | 0,1 | 10 | 800 | 0,00 | 0,379295 | 884,68 | 42,53552 |
| 1000 | 6 | 0,14392 | 0,18 | 0,14 | 0,85714 | 0,2 | 10 | 800 | 0,00 | 0,335473 | 927,22 | 50,03126 |
| 1000 | 6 | 0,12515 | 0,18 | 0,14 | 0,85714 | 0,3 | 10 | 800 | 0,00 | 0,288045 | 977,25 | 60,31305 |
| 1000 | 6 | 0,10577 | 0,18 | 0,14 | 0,85714 | 0,4 | 10 | 800 | 0,00 | 0,236408 | 1037,56 | 74,23617 |
| 1000 | 6 | 0,08569 | 0,18 | 0,14 | 0,85714 | 0,5 | 10 | 800 | 0,00 | 0,179813 | 1111,80 | 91,96624 |
| 1000 | 6 | 0,06476 | 0,18 | 0,14 | 0,85714 | 0,6 | 10 | 800 | 0,00 | 0,117304 | 1203,76 | 109,0267 |
| 1000 | 6 | 0,04281 | 0,18 | 0,14 | 0,85714 | 0,7 | 10 | 800 | 0,00 | 0,04764 | 1312,79 | 96,39537 |
| 1000 | 6 | 0,0196 | 0,18 | 0,14 | 0,85714 | 0,8 | 10 | 800 | 0,00 | -0,03083 | 1409,19 | -113,739 |
| 1000 | 6 | -0,0052 | 0,18 | 0,14 | 0,85714 | 0,9 | 10 | 800 | 0,00 | -0,12039 | 1295,45 | -1669,51 |
| 1000 | 6 | -0,032 | 0,18 | 0,14 | 0,85714 | 1 | 10 | 800 | 0,00 | -0,22431 | -374,07 |
Table 46. Dependence of NPV and DNPV on tax on profit rate t at fixed leverage level L for 10-year project at L=8.
| I | L | WACC | Ko | Kd | Wd | t | n | NOI | BFO | Ke | NPV | ∆NPV |
| 1000 | 8 | 0,18 | 0,18 | 0,14 | 0,88889 | 0 | 10 | 800 | 0,00 | 0,5 | 572,25 | 67,74227 |
| 1000 | 8 | 0,16152 | 0,18 | 0,14 | 0,88889 | 0,1 | 10 | 800 | 0,00 | 0,445653 | 640,00 | 80,91054 |
| 1000 | 8 | 0,14255 | 0,18 | 0,14 | 0,88889 | 0,2 | 10 | 800 | 0,00 | 0,386973 | 720,91 | 100,9849 |
| 1000 | 8 | 0,12303 | 0,18 | 0,14 | 0,88889 | 0,3 | 10 | 800 | 0,00 | 0,323249 | 821,89 | 133,0198 |
| 1000 | 8 | 0,10284 | 0,18 | 0,14 | 0,88889 | 0,4 | 10 | 800 | 0,00 | 0,253602 | 954,91 | 187,1372 |
| 1000 | 8 | 0,08188 | 0,18 | 0,14 | 0,88889 | 0,5 | 10 | 800 | 0,00 | 0,17692 | 1142,05 | 285,1235 |
| 1000 | 8 | 0,05998 | 0,18 | 0,14 | 0,88889 | 0,6 | 10 | 800 | 0,00 | 0,091775 | 1427,17 | 477,0078 |
| 1000 | 8 | 0,03692 | 0,18 | 0,14 | 0,88889 | 0,7 | 10 | 800 | 0,00 | -0,00372 | 1904,18 | 874,876 |
| 1000 | 8 | 0,01243 | 0,18 | 0,14 | 0,88889 | 0,8 | 10 | 800 | 0,00 | -0,11211 | 2779,06 | 1515,986 |
| 1000 | 8 | -0,0139 | 0,18 | 0,14 | 0,88889 | 0,9 | 10 | 800 | 0,00 | -0,23701 | 4295,04 | -4645,92 |
| 1000 | 8 | -0,0426 | 0,18 | 0,14 | 0,88889 | 1 | 10 | 800 | 0,00 | -0,38375 | -350,88 |
Table 47. Dependence of NPV and DNPV on tax on profit rate t at fixed leverage level L for 10-year project at L=10.
| I | L | WACC | Ko | Kd | Wd | t | n | NOI | BFO | Ke | NPV | ∆NPV |
| 1000 | 10 | 0,18 | 0,18 | 0,14 | 0,90909 | 0 | 10 | 800 | 0,00 | 0,58 | 365,08 | 85,01433 |
| 1000 | 10 | 0,16109 | 0,18 | 0,14 | 0,90909 | 0,1 | 10 | 800 | 0,00 | 0,512008 | 450,10 | 103,8568 |
| 1000 | 10 | 0,14168 | 0,18 | 0,14 | 0,90909 | 0,2 | 10 | 800 | 0,00 | 0,438456 | 553,96 | 134,6286 |
| 1000 | 10 | 0,12167 | 0,18 | 0,14 | 0,90909 | 0,3 | 10 | 800 | 0,00 | 0,358411 | 688,58 | 188,5659 |
| 1000 | 10 | 0,10097 | 0,18 | 0,14 | 0,90909 | 0,4 | 10 | 800 | 0,00 | 0,270705 | 877,15 | 292,3814 |
| 1000 | 10 | 0,07944 | 0,18 | 0,14 | 0,90909 | 0,5 | 10 | 800 | 0,00 | 0,173857 | 1169,53 | 519,0512 |
| 1000 | 10 | 0,0569 | 0,18 | 0,14 | 0,90909 | 0,6 | 10 | 800 | 0,00 | 0,065947 | 1688,58 | 1107,667 |
| 1000 | 10 | 0,03313 | 0,18 | 0,14 | 0,90909 | 0,7 | 10 | 800 | 0,00 | -0,05558 | 2796,25 | 3051,344 |
| 1000 | 10 | 0,0078 | 0,18 | 0,14 | 0,90909 | 0,8 | 10 | 800 | 0,00 | -0,19424 | 5847,59 | 11617,12 |
| 1000 | 10 | -0,0195 | 0,18 | 0,14 | 0,90909 | 0,9 | 10 | 800 | 0,00 | -0,35504 | 17464,71 | -17800,8 |
| 1000 | 10 | -0,0496 | 0,18 | 0,14 | 0,90909 | 1 | 10 | 800 | 0,00 | -0,54557 | -336,13 |
Table 48. Dependence of NPV and DNPV on tax on profit rate t at fixed leverage level L for perpetuity project at L=8.
| t | L | k0 | kd | I | NOI | NPV | ∆NPV |
| 0 | 8 | 0,18 | 0,14 | 1000 | 800 | -32111,1 | -5003,72 |
| 0,1 | 8 | 0,18 | 0,14 | 1000 | 800 | -37114,8 | -7713,12 |
| 0,2 | 8 | 0,18 | 0,14 | 1000 | 800 | -44828 | -12659,2 |
| 0,3 | 8 | 0,18 | 0,14 | 1000 | 800 | -57487,2 | -23580 |
| 0,4 | 8 | 0,18 | 0,14 | 1000 | 800 | -81067,2 | -57266,1 |
| 0,5 | 8 | 0,18 | 0,14 | 1000 | 800 | -138333 | -326333 |
| 0,6 | 8 | 0,18 | 0,14 | 1000 | 800 | -464667 | 816960,8 |
| 0,7 | 8 | 0,18 | 0,14 | 1000 | 800 | 352294,1 | -222466 |
| 0,8 | 8 | 0,18 | 0,14 | 1000 | 800 | 129828,3 | -49261 |
| 0,9 | 8 | 0,18 | 0,14 | 1000 | 800 | 80567,25 | -21567,3 |
| 1 | 8 | 0,18 | 0,14 | 1000 | 800 | 59000 |
Table 49. Dependence of NPV and DNPV on tax on profit rate t at fixed leverage level L for perpetuity project at L=10.
| t | L | k0 | kd | I | NOI | NPV | ∆NPV |
| 0 | 10 | 0,18 | 0,14 | 1000 | 800 | -41000 | -9090,91 |
| 0,1 | 10 | 0,18 | 0,14 | 1000 | 800 | -50090,9 | -15909,1 |
| 0,2 | 10 | 0,18 | 0,14 | 1000 | 800 | -66000 | -32692,3 |
| 0,3 | 10 | 0,18 | 0,14 | 1000 | 800 | -98692,3 | -99450,5 |
| 0,4 | 10 | 0,18 | 0,14 | 1000 | 800 | -198143 | -8,6E+19 |
| 0,5 | 10 | 0,18 | 0,14 | 1000 | 800 | -8,6E+19 | 8,65E+19 |
| 0,6 | 10 | 0,18 | 0,14 | 1000 | 800 | 202750 | -99632,4 |
| 0,7 | 10 | 0,18 | 0,14 | 1000 | 800 | 103117,6 | -33006,5 |
| 0,8 | 10 | 0,18 | 0,14 | 1000 | 800 | 70111,11 | -16374,3 |
| 0,9 | 10 | 0,18 | 0,14 | 1000 | 800 | 53736,84 | -9736,84 |
| 1 | 10 | 0,18 | 0,14 | 1000 | 800 | 44000 |
Table 50. Dependence of NPV and DNPV on tax on profit rate t at fixed leverage level L for 5-year project at L=0.
| I | L | WACC | Ko | Kd | Wd | t | n | NOI | BFO | Ke | NPV | ∆NPV |
| 1000 | 0 | 0,18 | 0,18 | 0,14 | 0 | 0 | 5 | 800 | 0,00 | 0,18 | 1501,737 | -250,174 |
| 1000 | 0 | 0,18 | 0,18 | 0,14 | 0 | 0,1 | 5 | 800 | 0,00 | 0,18 | 1251,563 | -250,174 |
| 1000 | 0 | 0,18 | 0,18 | 0,14 | 0 | 0,2 | 5 | 800 | 0,00 | 0,18 | 1001,389 | -250,174 |
| 1000 | 0 | 0,18 | 0,18 | 0,14 | 0 | 0,3 | 5 | 800 | 0,00 | 0,18 | 751,2158 | -250,174 |
| 1000 | 0 | 0,18 | 0,18 | 0,14 | 0 | 0,4 | 5 | 800 | 0,00 | 0,18 | 501,0421 | -250,174 |
| 1000 | 0 | 0,18 | 0,18 | 0,14 | 0 | 0,5 | 5 | 800 | 0,00 | 0,18 | 250,8684 | -250,174 |
| 1000 | 0 | 0,18 | 0,18 | 0,14 | 0 | 0,6 | 5 | 800 | 0,00 | 0,18 | 0,694727 | -250,174 |
| 1000 | 0 | 0,18 | 0,18 | 0,14 | 0 | 0,7 | 5 | 800 | 0,00 | 0,18 | -249,479 | -250,174 |
| 1000 | 0 | 0,18 | 0,18 | 0,14 | 0 | 0,8 | 5 | 800 | 0,00 | 0,18 | -499,653 | -250,174 |
| 1000 | 0 | 0,18 | 0,18 | 0,14 | 0 | 0,9 | 5 | 800 | 0,00 | 0,18 | -749,826 | -250,174 |
| 1000 | 0 | 0,18 | 0,18 | 0,14 | 0 | 1 | 5 | 800 | 0,00 | 0,18 | -1000 |
Table 51. Dependence of NPV and DNPV on tax on profit rate t at fixed leverage level L for 5-year project at L=2.
| I | L | WACC | Ko | Kd | Wd | t | n | NOI | BFO | Ke | NPV | ∆NPV |
| 1000 | 2 | 0,18 | 0,18 | 0,14 | 0,66667 | 0 | 5 | 800 | 0,00 | 0,26 | 1108,057 | -120,983 |
| 1000 | 2 | 0,16577 | 0,18 | 0,14 | 0,66667 | 0,1 | 5 | 800 | 0,00 | 0,245315 | 987,0733 | -129,204 |
| 1000 | 2 | 0,15137 | 0,18 | 0,14 | 0,66667 | 0,2 | 5 | 800 | 0,00 | 0,230116 | 857,869 | -138,59 |
| 1000 | 2 | 0,13679 | 0,18 | 0,14 | 0,66667 | 0,3 | 5 | 800 | 0,00 | 0,214367 | 719,2786 | -149,372 |
| 1000 | 2 | 0,12201 | 0,18 | 0,14 | 0,66667 | 0,4 | 5 | 800 | 0,00 | 0,19803 | 569,9064 | -161,839 |
| 1000 | 2 | 0,10702 | 0,18 | 0,14 | 0,66667 | 0,5 | 5 | 800 | 0,00 | 0,181065 | 408,0676 | -176,357 |
| 1000 | 2 | 0,09181 | 0,18 | 0,14 | 0,66667 | 0,6 | 5 | 800 | 0,00 | 0,163424 | 231,711 | -193,394 |
| 1000 | 2 | 0,07635 | 0,18 | 0,14 | 0,66667 | 0,7 | 5 | 800 | 0,00 | 0,145057 | 38,31702 | -213,557 |
| 1000 | 2 | 0,06064 | 0,18 | 0,14 | 0,66667 | 0,8 | 5 | 800 | 0,00 | 0,125907 | -175,24 | -237,64 |
| 1000 | 2 | 0,04464 | 0,18 | 0,14 | 0,66667 | 0,9 | 5 | 800 | 0,00 | 0,105908 | -412,881 | -266,698 |
| 1000 | 2 | 0,02833 | 0,18 | 0,14 | 0,66667 | 1 | 5 | 800 | 0,00 | 0,084989 | -679,579 |
Table 52. Dependence of NPV and DNPV on tax on profit rate t at fixed leverage level L for 5-year project at L=4.
| I | L | WACC | Ko | Kd | Wd | t | n | NOI | BFO | Ke | NPV | ∆NPV |
| 1000 | 4 | 0,18 | 0,18 | 0,14 | 0,8 | 0 | 5 | 800 | 0,00 | 0,34 | 808,3293 | -51,044 |
| 1000 | 4 | 0,16291 | 0,18 | 0,14 | 0,8 | 0,1 | 5 | 800 | 0,00 | 0,31053 | 757,2853 | -59,2842 |
| 1000 | 4 | 0,14556 | 0,18 | 0,14 | 0,8 | 0,2 | 5 | 800 | 0,00 | 0,279807 | 698,0011 | -69,6148 |
| 1000 | 4 | 0,12795 | 0,18 | 0,14 | 0,8 | 0,3 | 5 | 800 | 0,00 | 0,24773 | 628,3863 | -82,763 |
| 1000 | 4 | 0,11004 | 0,18 | 0,14 | 0,8 | 0,4 | 5 | 800 | 0,00 | 0,214184 | 545,6233 | -99,7794 |
| 1000 | 4 | 0,09181 | 0,18 | 0,14 | 0,8 | 0,5 | 5 | 800 | 0,00 | 0,179041 | 445,8439 | -122,217 |
| 1000 | 4 | 0,07323 | 0,18 | 0,14 | 0,8 | 0,6 | 5 | 800 | 0,00 | 0,142153 | 323,6272 | -152,429 |
| 1000 | 4 | 0,05427 | 0,18 | 0,14 | 0,8 | 0,7 | 5 | 800 | 0,00 | 0,103355 | 171,1979 | -194,091 |
| 1000 | 4 | 0,03489 | 0,18 | 0,14 | 0,8 | 0,8 | 5 | 800 | 0,00 | 0,062454 | -22,8934 | -253,129 |
| 1000 | 4 | 0,01505 | 0,18 | 0,14 | 0,8 | 0,9 | 5 | 800 | 0,00 | 0,019228 | -276,023 | -339,472 |
| 1000 | 4 | -0,0053 | 0,18 | 0,14 | 0,8 | 1 | 5 | 800 | 0,00 | -0,02658 | -615,495 |
Table 53. Dependence of NPV and DNPV on tax on profit rate t at fixed leverage level L for 5-year project at L=6.
| I | L | WACC | Ko | Kd | Wd | t | n | NOI | BFO | Ke | NPV | ∆NPV |
| 1000 | 6 | 0,18 | 0,18 | 0,14 | 0,85714 | 0 | 5 | 800 | 0,00 | 0,42 | 574,8492 | -6,23744 |
| 1000 | 6 | 0,16168 | 0,18 | 0,14 | 0,85714 | 0,1 | 5 | 800 | 0,00 | 0,375729 | 568,6118 | -11,31 |
| 1000 | 6 | 0,14306 | 0,18 | 0,14 | 0,85714 | 0,2 | 5 | 800 | 0,00 | 0,329434 | 557,3019 | -18,3975 |
| 1000 | 6 | 0,12413 | 0,18 | 0,14 | 0,85714 | 0,3 | 5 | 800 | 0,00 | 0,280937 | 538,9044 | -28,5544 |
| 1000 | 6 | 0,10486 | 0,18 | 0,14 | 0,85714 | 0,4 | 5 | 800 | 0,00 | 0,230037 | 510,3499 | -43,5294 |
| 1000 | 6 | 0,08522 | 0,18 | 0,14 | 0,85714 | 0,5 | 5 | 800 | 0,00 | 0,176505 | 466,8205 | -66,3335 |
| 1000 | 6 | 0,06515 | 0,18 | 0,14 | 0,85714 | 0,6 | 5 | 800 | 0,00 | 0,120078 | 400,487 | -102,385 |
| 1000 | 6 | 0,04464 | 0,18 | 0,14 | 0,85714 | 0,7 | 5 | 800 | 0,00 | 0,060453 | 298,1024 | -161,946 |
| 1000 | 6 | 0,02361 | 0,18 | 0,14 | 0,85714 | 0,8 | 5 | 800 | 0,00 | -0,00272 | 136,1565 | -265,692 |
| 1000 | 6 | 0,00202 | 0,18 | 0,14 | 0,85714 | 0,9 | 5 | 800 | 0,00 | -0,06987 | -129,536 | -458,495 |
| 1000 | 6 | -0,0202 | 0,18 | 0,14 | 0,85714 | 1 | 5 | 800 | 0,00 | -0,14147 | -588,03 |
Table 54. Dependence of NPV and DNPV on tax on profit rate t at fixed leverage level L for 5-year project at L=8.
| I | L | WACC | Ko | Kd | Wd | t | n | NOI | BFO | Ke | NPV | ∆NPV |
| 1000 | 8 | 0,18 | 0,18 | 0,14 | 0,88889 | 0 | 5 | 800 | 0,00 | 0,5 | 389,3004 | 23,47489 |
| 1000 | 8 | 0,16099 | 0,18 | 0,14 | 0,88889 | 0,1 | 5 | 800 | 0,00 | 0,440923 | 412,7753 | 22,6083 |
| 1000 | 8 | 0,14167 | 0,18 | 0,14 | 0,88889 | 0,2 | 5 | 800 | 0,00 | 0,379039 | 435,3836 | 20,71462 |
| 1000 | 8 | 0,12201 | 0,18 | 0,14 | 0,88889 | 0,3 | 5 | 800 | 0,00 | 0,314091 | 456,0982 | 16,88106 |
| 1000 | 8 | 0,10198 | 0,18 | 0,14 | 0,88889 | 0,4 | 5 | 800 | 0,00 | 0,245786 | 472,9793 | 9,298693 |
| 1000 | 8 | 0,08153 | 0,18 | 0,14 | 0,88889 | 0,5 | 5 | 800 | 0,00 | 0,173792 | 482,278 | -5,79258 |
| 1000 | 8 | 0,06064 | 0,18 | 0,14 | 0,88889 | 0,6 | 5 | 800 | 0,00 | 0,097721 | 476,4854 | -36,6918 |
| 1000 | 8 | 0,03924 | 0,18 | 0,14 | 0,88889 | 0,7 | 5 | 800 | 0,00 | 0,017124 | 439,7936 | -103,156 |
| 1000 | 8 | 0,01728 | 0,18 | 0,14 | 0,88889 | 0,8 | 5 | 800 | 0,00 | -0,06852 | 336,6381 | -256,995 |
| 1000 | 8 | -0,0053 | 0,18 | 0,14 | 0,88889 | 0,9 | 5 | 800 | 0,00 | -0,15985 | 79,64322 | -652,415 |
| 1000 | 8 | -0,0286 | 0,18 | 0,14 | 0,88889 | 1 | 5 | 800 | 0,00 | -0,25759 | -572,772 |
Table 55. Dependence of NPV and DNPV on tax on profit rate t at fixed leverage level L for 5-year project at L=10.
| I | L | WACC | Ko | Kd | Wd | t | n | NOI | BFO | Ke | NPV | ∆NPV |
| 1000 | 10 | 0,18 | 0,18 | 0,14 | 0,90909 | 0 | 5 | 800 | 0,00 | 0,58 | 239,2302 | 43,49836 |
| 1000 | 10 | 0,16056 | 0,18 | 0,14 | 0,90909 | 0,1 | 5 | 800 | 0,00 | 0,506115 | 282,7286 | 46,87962 |
| 1000 | 10 | 0,14078 | 0,18 | 0,14 | 0,90909 | 0,2 | 5 | 800 | 0,00 | 0,428635 | 329,6082 | 50,87829 |
| 1000 | 10 | 0,12066 | 0,18 | 0,14 | 0,90909 | 0,3 | 5 | 800 | 0,00 | 0,34722 | 380,4865 | 55,32552 |
| 1000 | 10 | 0,10014 | 0,18 | 0,14 | 0,90909 | 0,4 | 5 | 800 | 0,00 | 0,261488 | 435,812 | 59,47085 |
| 1000 | 10 | 0,07918 | 0,18 | 0,14 | 0,90909 | 0,5 | 5 | 800 | 0,00 | 0,170996 | 495,2828 | 60,76747 |
| 1000 | 10 | 0,05775 | 0,18 | 0,14 | 0,90909 | 0,6 | 5 | 800 | 0,00 | 0,075231 | 556,0503 | 51,04171 |
| 1000 | 10 | 0,03578 | 0,18 | 0,14 | 0,90909 | 0,7 | 5 | 800 | 0,00 | -0,0264 | 607,092 | 2,834166 |
| 1000 | 10 | 0,01322 | 0,18 | 0,14 | 0,90909 | 0,8 | 5 | 800 | 0,00 | -0,13462 | 609,9262 | -187,024 |
| 1000 | 10 | -0,01 | 0,18 | 0,14 | 0,90909 | 0,9 | 5 | 800 | 0,00 | -0,25024 | 422,9017 | -985,964 |
| 1000 | 10 | -0,034 | 0,18 | 0,14 | 0,90909 | 1 | 5 | 800 | 0,00 | -0,37429 | -563,062 |
10-year projects For 10-year projects we get the following results (Tables 56-61,Figure 18-21).
Table 56. Dependence of NPV and DNPV on tax on profit rate t at fixed leverage level L for 10-year project at L=0.
| I | L | WACC | Ko | Kd | Wd | t | n | NOI | BFO | Ke | NPV | ∆NPV |
| 1000 | 0 | 0,18 | 0,18 | 0,14 | 0 | 0 | 10 | 800 | 0,00 | 0,18 | 2595,269 | -359,527 |
| 1000 | 0 | 0,18 | 0,18 | 0,14 | 0 | 0,1 | 10 | 800 | 0,00 | 0,18 | 2235,742 | -359,527 |
| 1000 | 0 | 0,18 | 0,18 | 0,14 | 0 | 0,2 | 10 | 800 | 0,00 | 0,18 | 1876,215 | -359,527 |
| 1000 | 0 | 0,18 | 0,18 | 0,14 | 0 | 0,3 | 10 | 800 | 0,00 | 0,18 | 1516,688 | -359,527 |
| 1000 | 0 | 0,18 | 0,18 | 0,14 | 0 | 0,4 | 10 | 800 | 0,00 | 0,18 | 1157,161 | -359,527 |
| 1000 | 0 | 0,18 | 0,18 | 0,14 | 0 | 0,5 | 10 | 800 | 0,00 | 0,18 | 797,6345 | -359,527 |
| 1000 | 0 | 0,18 | 0,18 | 0,14 | 0 | 0,6 | 10 | 800 | 0,00 | 0,18 | 438,1076 | -359,527 |
| 1000 | 0 | 0,18 | 0,18 | 0,14 | 0 | 0,7 | 10 | 800 | 0,00 | 0,18 | 78,58071 | -359,527 |
| 1000 | 0 | 0,18 | 0,18 | 0,14 | 0 | 0,8 | 10 | 800 | 0,00 | 0,18 | -280,946 | -359,527 |
| 1000 | 0 | 0,18 | 0,18 | 0,14 | 0 | 0,9 | 10 | 800 | 0,00 | 0,18 | -640,473 | -359,527 |
| 1000 | 0 | 0,18 | 0,18 | 0,14 | 0 | 1 | 10 | 800 | 0,00 | 0,18 | -1000 |
Table 57. Dependence of NPV and DNPV on tax on profit rate t at fixed leverage level L for 10-year project at L=2.
| I | L | WACC | Ko | Kd | Wd | t | n | NOI | BFO | Ke | NPV | ∆NPV |
| 1000 | 2 | 0,18 | 0,18 | 0,14 | 0,66667 | 0 | 10 | 800 | 0,00 | 0,26 | 1771,845 | -125,137 |
| 1000 | 2 | 0,16618 | 0,18 | 0,14 | 0,66667 | 0,1 | 10 | 800 | 0,00 | 0,24654 | 1646,708 | -135,437 |
| 1000 | 2 | 0,1521 | 0,18 | 0,14 | 0,66667 | 0,2 | 10 | 800 | 0,00 | 0,232299 | 1511,27 | -147,987 |
| 1000 | 2 | 0,13773 | 0,18 | 0,14 | 0,66667 | 0,3 | 10 | 800 | 0,00 | 0,217182 | 1363,283 | -163,538 |
| 1000 | 2 | 0,12303 | 0,18 | 0,14 | 0,66667 | 0,4 | 10 | 800 | 0,00 | 0,201083 | 1199,745 | -183,17 |
| 1000 | 2 | 0,10796 | 0,18 | 0,14 | 0,66667 | 0,5 | 10 | 800 | 0,00 | 0,183875 | 1016,575 | -208,47 |
| 1000 | 2 | 0,09247 | 0,18 | 0,14 | 0,66667 | 0,6 | 10 | 800 | 0,00 | 0,165407 | 808,1048 | -241,852 |
| 1000 | 2 | 0,0765 | 0,18 | 0,14 | 0,66667 | 0,7 | 10 | 800 | 0,00 | 0,145497 | 566,253 | -287,089 |
| 1000 | 2 | 0,05998 | 0,18 | 0,14 | 0,66667 | 0,8 | 10 | 800 | 0,00 | 0,123925 | 279,1638 | -350,325 |
| 1000 | 2 | 0,04281 | 0,18 | 0,14 | 0,66667 | 0,9 | 10 | 800 | 0,00 | 0,100417 | -71,1609 | -442,002 |
| 1000 | 2 | 0,02488 | 0,18 | 0,14 | 0,66667 | 1 | 10 | 800 | 0,00 | 0,074631 | -513,163 |
Table 58. Dependence of NPV and DNPV on tax on profit rate t at fixed leverage level L for 10-year project at L=4.
| I | L | WACC | Ko | Kd | Wd | t | n | NOI | BFO | Ke | NPV | ∆NPV |
| 1000 | 4 | 0,18 | 0,18 | 0,14 | 0,8 | 0 | 10 | 800 | 0,00 | 0,34 | 1226,885 | -475,625 |
| 1000 | 4 | 0,18316 | 0,20056 | 0,14 | 0,8 | 0,1 | 10 | 800 | 0,00 | 0,411801 | 751,2601 | -139,495 |
| 1000 | 4 | 0,17256 | 0,20836 | 0,14 | 0,8 | 0,2 | 10 | 800 | 0,00 | 0,414791 | 611,7654 | -74,4553 |
| 1000 | 4 | 0,15772 | 0,21253 | 0,14 | 0,8 | 0,3 | 10 | 800 | 0,00 | 0,396579 | 537,3101 | -54,8815 |
| 1000 | 4 | 0,14072 | 0,21513 | 0,14 | 0,8 | 0,4 | 10 | 800 | 0,00 | 0,367589 | 482,4286 | -52,0879 |
| 1000 | 4 | 0,12227 | 0,2169 | 0,14 | 0,8 | 0,5 | 10 | 800 | 0,00 | 0,331331 | 430,3407 | -60,1971 |
| 1000 | 4 | 0,10261 | 0,21819 | 0,14 | 0,8 | 0,6 | 10 | 800 | 0,00 | 0,289071 | 370,1436 | -80,4792 |
| 1000 | 4 | 0,08181 | 0,21917 | 0,14 | 0,8 | 0,7 | 10 | 800 | 0,00 | 0,241069 | 289,6644 | -120,753 |
| 1000 | 4 | 0,0598 | 0,21994 | 0,14 | 0,8 | 0,8 | 10 | 800 | 0,00 | 0,186991 | 168,9112 | -202,021 |
| 1000 | 4 | 0,0364 | 0,22055 | 0,14 | 0,8 | 0,9 | 10 | 800 | 0,00 | 0,126013 | -33,1095 | -382,685 |
| 1000 | 4 | 0,01135 | 0,22106 | 0,14 | 0,8 | 1 | 10 | 800 | 0,00 | 0,056769 | -415,795 |
Table 59. Dependence of NPV and DNPV on tax on profit rate t at fixed leverage level L for 10-year project at L=6.
| I | L | WACC | Ko | Kd | Wd | t | n | NOI | BFO | Ke | NPV | ∆NPV |
| 1000 | 6 | 0,18 | 0,18 | 0,14 | 0,85714 | 0 | 10 | 800 | 0,00 | 0,42 | 847,6197 | 37,06285 |
| 1000 | 6 | 0,16218 | 0,18 | 0,14 | 0,85714 | 0,1 | 10 | 800 | 0,00 | 0,379295 | 884,6825 | 42,53552 |
| 1000 | 6 | 0,14392 | 0,18 | 0,14 | 0,85714 | 0,2 | 10 | 800 | 0,00 | 0,335473 | 927,218 | 50,03126 |
| 1000 | 6 | 0,12515 | 0,18 | 0,14 | 0,85714 | 0,3 | 10 | 800 | 0,00 | 0,288045 | 977,2493 | 60,31305 |
| 1000 | 6 | 0,10577 | 0,18 | 0,14 | 0,85714 | 0,4 | 10 | 800 | 0,00 | 0,236408 | 1037,562 | 74,23617 |
| 1000 | 6 | 0,08569 | 0,18 | 0,14 | 0,85714 | 0,5 | 10 | 800 | 0,00 | 0,179813 | 1111,799 | 91,96624 |
| 1000 | 6 | 0,06476 | 0,18 | 0,14 | 0,85714 | 0,6 | 10 | 800 | 0,00 | 0,117304 | 1203,765 | 109,0267 |
| 1000 | 6 | 0,04281 | 0,18 | 0,14 | 0,85714 | 0,7 | 10 | 800 | 0,00 | 0,04764 | 1312,791 | 96,39537 |
| 1000 | 6 | 0,0196 | 0,18 | 0,14 | 0,85714 | 0,8 | 10 | 800 | 0,00 | -0,03083 | 1409,187 | -113,739 |
| 1000 | 6 | -0,0052 | 0,18 | 0,14 | 0,85714 | 0,9 | 10 | 800 | 0,00 | -0,12039 | 1295,448 | -1669,51 |
| 1000 | 6 | -0,032 | 0,18 | 0,14 | 0,85714 | 1 | 10 | 800 | 0,00 | -0,22431 | -374,066 |
Table 60. Dependence of NPV and DNPV on tax on profit rate t at fixed leverage level L for 10-year project at L=8.
| I | L | WACC | Ko | Kd | Wd | t | n | NOI | BFO | Ke | NPV | ∆NPV |
| 1000 | 8 | 0,18 | 0,18 | 0,14 | 0,88889 | 0 | 10 | 800 | 0,00 | 0,5 | 572,2536 | 67,74227 |
| 1000 | 8 | 0,16152 | 0,18 | 0,14 | 0,88889 | 0,1 | 10 | 800 | 0,00 | 0,445653 | 639,9958 | 80,91054 |
| 1000 | 8 | 0,14255 | 0,18 | 0,14 | 0,88889 | 0,2 | 10 | 800 | 0,00 | 0,386973 | 720,9064 | 100,9849 |
| 1000 | 8 | 0,12303 | 0,18 | 0,14 | 0,88889 | 0,3 | 10 | 800 | 0,00 | 0,323249 | 821,8913 | 133,0198 |
| 1000 | 8 | 0,10284 | 0,18 | 0,14 | 0,88889 | 0,4 | 10 | 800 | 0,00 | 0,253602 | 954,9111 | 187,1372 |
| 1000 | 8 | 0,08188 | 0,18 | 0,14 | 0,88889 | 0,5 | 10 | 800 | 0,00 | 0,17692 | 1142,048 | 285,1235 |
| 1000 | 8 | 0,05998 | 0,18 | 0,14 | 0,88889 | 0,6 | 10 | 800 | 0,00 | 0,091775 | 1427,172 | 477,0078 |
| 1000 | 8 | 0,03692 | 0,18 | 0,14 | 0,88889 | 0,7 | 10 | 800 | 0,00 | -0,00372 | 1904,18 | 874,876 |
| 1000 | 8 | 0,01243 | 0,18 | 0,14 | 0,88889 | 0,8 | 10 | 800 | 0,00 | -0,11211 | 2779,056 | 1515,986 |
| 1000 | 8 | -0,0139 | 0,18 | 0,14 | 0,88889 | 0,9 | 10 | 800 | 0,00 | -0,23701 | 4295,041 | -4645,92 |
| 1000 | 8 | -0,0426 | 0,18 | 0,14 | 0,88889 | 1 | 10 | 800 | 0,00 | -0,38375 | -350,883 |
Table 61. Dependence of NPV and DNPV on tax on profit rate t at fixed leverage level L for 10-year project at L=10.
| I | L | WACC | Ko | Kd | Wd | t | n | NOI | BFO | Ke | NPV | ∆NPV |
| 1000 | 10 | 0,18 | 0,18 | 0,14 | 0,90909 | 0 | 10 | 800 | 0,00 | 0,58 | 365,0841 | 85,01433 |
| 1000 | 10 | 0,16109 | 0,18 | 0,14 | 0,90909 | 0,1 | 10 | 800 | 0,00 | 0,512008 | 450,0984 | 103,8568 |
| 1000 | 10 | 0,14168 | 0,18 | 0,14 | 0,90909 | 0,2 | 10 | 800 | 0,00 | 0,438456 | 553,9552 | 134,6286 |
| 1000 | 10 | 0,12167 | 0,18 | 0,14 | 0,90909 | 0,3 | 10 | 800 | 0,00 | 0,358411 | 688,5839 | 188,5659 |
| 1000 | 10 | 0,10097 | 0,18 | 0,14 | 0,90909 | 0,4 | 10 | 800 | 0,00 | 0,270705 | 877,1497 | 292,3814 |
| 1000 | 10 | 0,07944 | 0,18 | 0,14 | 0,90909 | 0,5 | 10 | 800 | 0,00 | 0,173857 | 1169,531 | 519,0512 |
| 1000 | 10 | 0,0569 | 0,18 | 0,14 | 0,90909 | 0,6 | 10 | 800 | 0,00 | 0,065947 | 1688,582 | 1107,667 |
| 1000 | 10 | 0,03313 | 0,18 | 0,14 | 0,90909 | 0,7 | 10 | 800 | 0,00 | -0,05558 | 2796,249 | 3051,344 |
| 1000 | 10 | 0,0078 | 0,18 | 0,14 | 0,90909 | 0,8 | 10 | 800 | 0,00 | -0,19424 | 5847,593 | 11617,12 |
| 1000 | 10 | -0,0195 | 0,18 | 0,14 | 0,90909 | 0,9 | 10 | 800 | 0,00 | -0,35504 | 17464,71 | -17800,8 |
| 1000 | 10 | -0,0496 | 0,18 | 0,14 | 0,90909 | 1 | 10 | 800 | 0,00 | -0,54557 | -336,131 |
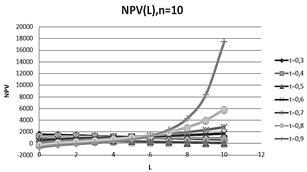
Figure 9. Dependence of NPV on leverage level L at fixed levels of tax on profit rates t for 10-year project.
3. Dependence of NPV on Tax on Profit Rates at Fixed Leverage Levels L
Below we study the dependence of NPV on tax on profit rates at fixed leverage levels L .
3.1. The Effectiveness of the Investment Project from the Perspective of the Equity Holders only
5-year project For 5-year projects we get the following results (Tables 36-41, Figures 11 and 12).
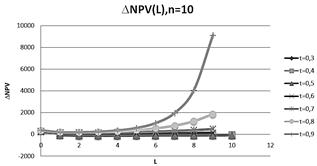
Figure 10. Dependence of DNPV on leverage level L at fixed levels of tax on profit rates t for 10-year project.
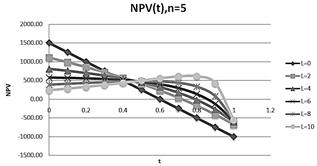
Figure 11. Dependence of NPV on tax on profit rate t at fixed leverage level L for 5-year project.
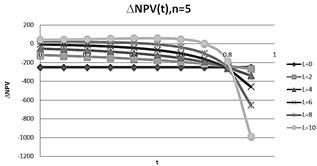
Figure 12. Dependence of DNPV on tax on profit rate t at fixed leverage level L for 5-year project.
10-year project For 10-year projects we get the following results (Tables 42-47,Figures 13 and 14).
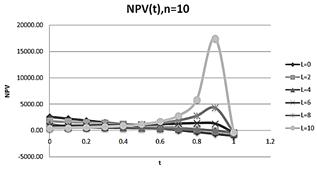
Figure 13. Dependence of NPV on tax on profit rate t at fixed leverage level L for 10-year project.
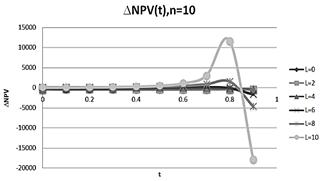
Figure 14. Dependence of DNPV on tax on profit rate t at fixed leverage level L for 10-year project.
3.2. Perpetuity Limit
For perpetuity projects we get the following results (Tables 48-49, Figure 15).
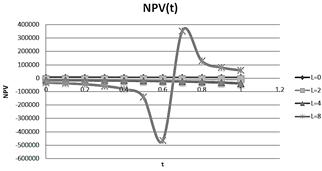
Figure 15. Dependence of DNPV on tax on profit rate t at fixed leverage level L for perpetuity project.
3.3. The Effectiveness of the Investment Project from the Perspective of the Equity and Debt Holders
5-year project For 5-year projects we get the following results (Tables 50-55,Figure 16 and 17).
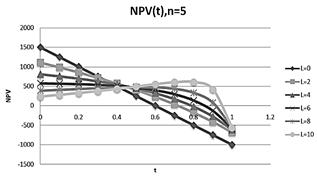
Figure 16. Dependence of NPV on tax on profit rate t at fixed leverage level L for 5-year project.

Figure 17. Dependence of DNPV on tax on profit rate t at fixed leverage level L for 5-year project.
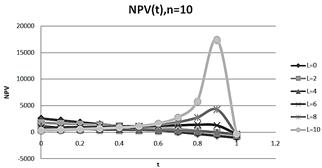
Figure 18. Dependence of NPV on tax on profit rate t at fixed leverage level L for 10-year project.
Or with more details
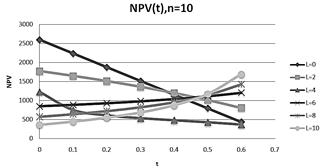
Figure 19. Dependence of NPV on tax on profit rate t at fixed leverage level L for 10-year project (more detailed).
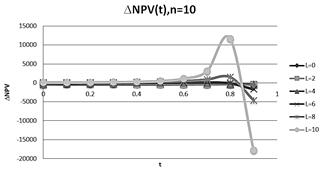
Figure 20. Dependence of DNPV on tax on profit rate t at fixed leverage level L for 10-year project.
Or with more details
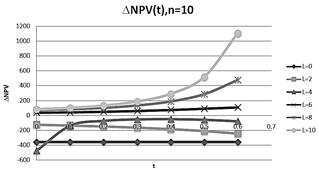
Figure 21. Dependence of DNPV on tax on profit rate t at fixed leverage level L for 10-year project (more detailed).
4. Conclusion
Within modern theory of capital cost and capital structure by Brusov- Filatova- Orekhova (BFO theory) and created within this theory modern investment models (Brusov P, Filatova T, Orehova N, Eskindarov M 2015), influence of growth of tax on profit rate on the efficiency of the investment is investigated. It has been shown that for arbitrary duration projects as well as for perpetuity projects the growth of tax on profit rate change the nature of the NPV dependence on leverage at some value t*: there is a transition from diminishing function NPV(L) when t<t* to growing function NPV(L). The t* value depends on the duration of the project, cost of capital (equity and debt) values and other parameters of the project.
At high leverage levels this leads to qualitatively new effect in investments: growth of the efficiency of the investments with growth of tax on profit rate. Discovered effects take place under consideration from the point of view of owners of equity capital as well as from the point of view of owners of equity and debt capital.
So, two very important qualitatively new effects in investments have been discovered:
1) change the character of NPV dependence on leverage;
2) growth of the efficiency of the investments with growth of tax on profit rate.
Both effects could be used in practice to optimize the investments.
References
- Brusov P, Filatova T, Orehova N, Eskindarov M (2015), Modern corporate finance, investments and taxation, Springer International Publishing, Switzerland, 373 p.
- Brusov, P. N., & Filatova, T. V. (2011). From Modigliani–Miller to general theory of capital cost and capital structure of the company. Finance and Credit, 435, 2–8.
- Brusov, P., Filatova, T., Eskindarov, M., Orehova, N., Brusov, P., & Brusova, A. (2011). Influence of debt financing on the effectiveness of the finite duration investment project. Applied Financial Economics, 22, 1043–1052.
- Brusov, P., Filatova, T., Orehova, N., & Brusova, N. (2011). Weighted average cost of capital in the theory of Modigliani–Miller, modified for a finite life-time company. Applied Financial Economics, 21, 815–824.http://dx.doi.org/10.1080/09603107.2010.537635
- Brusov, P., Filatova, T., Orehova, N., Brusov, P. P., & Brusova, N. (2011a). Influence of debt financing on the effectiveness of the investment project within Modigliani–Miller theory. Research Journal of Economics, Business and ICT, 2, 11–15.
- Brusov, P., Filatova, T., Orehova, N., Brusov, P. P., & Brusova, N. (2011b). From Modigliani–Miller to general theory of capital cost and capital structure of the company. Research Journal of Economics, Business and ICT, 2, 16–21.
- Brusov, P. N., Filatova, T. V., & Orekhova, N. P. (2013a). Absence of an optimal capital structure in the famous tradeoff theory! Journal of Reviews on Global Economics, 2, 94–1
- Filatova, T. V., Orehova, N. P., & Brusova, A. P. (2008). Weighted average cost of capital in the theory of Modigliani–Miller, modified for a finite life-time company. Bulletin of the FU, 48, 68–77.
- Modigliani, F., & Miller, M. (1958). The cost of capital, corporate finance and the theory of investment. American Economic Review, 48, 261–297.
- Modigliani, F., & Miller, M. (1963). Corporate income taxes and the cost of capital: A correction. American Economic Review, 53, 147–175.
- Modigliani, F., & Miller, M. (1966). Some estimates of the cost of capital to the electric utility industry 1954–1957. American Economic Review, 56, 333–391.
- P.N. Brusov, T.V. Filatova and N.P. Orekhova (2014), Mechanism of formation of the company optimal capital structure, different from suggested by trade off theory// Cogent Economics & Finance, v.2, p. 1-13; http://dx.doi.org/10.1080/23322039.2014.946150.


