
American Journal of Economics, Finance and Management, Vol. 1, No. 4, August 2015 Publish Date: May 28, 2015 Pages: 242-249
Whether It is Possible to Increase Taxing and Conserve Good Investment Climate in the Country
P. N. Brusov1, *, T. V. Filatova2, N. P. Orekhova3, M. A. Eskindarov4, I. K. Shevchenko5, V. L. Kulik6
1Applied Mathematics Department, Financial University under the Government of Russian Federation, Moscow, Russia
2Public Administration and Municipal Management Faculty, Financial University under the Government of Russian Federation, Moscow, Russia
3High School of Business, South Federal University, Corporate finance, Investment and Taxation Laboratory, Research Consortium of Universities of the South of Russia, Rostov-on-Don, Russia
4Financial University under the Government of Russian Federation, Moscow, Russia
5Research and Innovation Projects, South Federal University, Rostov-on-Don, Russia
6Management Department, Financial University under the Government of Russian Federation, Moscow, Russia
Abstract
Within investment models, developed by Brusov, Filatova, Orekhova earlier the influence of tax on profit rate on effectiveness of long–term investment projects at different debt levels is investigated. It is shown, that increase of tax on profit rate from one side leads to decrease of project NPV, but from other side it leads to decrease of sensitivity of NPV with respect to leverage level. At high leverage level L the influence of tax on profit rate increase on effectiveness of investment projects becomes significantly less. We come to conclusion, that taxing could be differentiated depending on debt level of investment projects of the company: for projects with high debt level L it is possible to apply a higher tax on profit rate.
Keywords
Tax On Profit Rate, Long–Term Investment Projects, Effectiveness of Investment Project, Leverage Level, Brusov-Filatova-Orekhova (BFO Theory)
Received: April 7, 2015
Accepted: May 2, 2015
Published online: May 27, 2015
@ 2015 The Authors. Published by American Institute of Science. This Open Access article is under the CC BY-NC license. http://creativecommons.org/licenses/by-nc/4.0/
Contents
1. Introduction 2. Model 2.1. With the Division of Credit and Investment Flows 2.2. At a Constant Value of the Total Invested Capital (I = Const) 2.3. Borrowings Abroad 2.4. Dependence of NPV on Tax on Profit Rates at Different Leverage Levels 2.5. At a Constant Value of Equity Capital (S = Const) 3. Without Flows Separation 3.1. At a Constant value of the Total Invested Capital (I = Const) 3.2. At a Constant Value of Equity Capital (S = Const) 4. Conclusions
1. Introduction
Basis of the modern tax systems are the following taxes: tax on profit of organizations, income tax (tax on the income of individuals), social tax (contributions into state extrabudgetary funds), the sales tax (the value-added tax), tax on property of the organization. In this paper we investigate the influence of tax on profit rates on the efficiency of the investment projects.
The problems that we are currently investigating now, those questions which we can analyze now in all of their complexity and diversity and to which we give answers, not be tractable by analysis and assessment previously, for them one was not able to give an answer, they even not been raised in such a setting. What should be the taxes scale: flat, progressive or otherwise, differentiated, as well as tax rate has an impact on the cost of attract of company capital, its capitalization. What is cumulative effect of increase of taxes: whether the system "state–employer" will win, or will lose as a whole from the tax growth, and if it will lose, then how much. Whether the redistribution of income in favor of the state does not destroy the spirit of enterprise, its driving force. If tax on profit rate will increase by 1%, for how much does the cost of attractive capital of company will increase, for how much its capitalization will decrease. If by 3- 6 %, it should be serious reasons for such increase, but if by 0.5 -1.5 %, it is possible to discuss such increase.
How taxation affects the efficiency of investment? How much does the NPV of investment project will decrease, if tax on profit rate will increase by 1 %? If on 5- 10 %, it has a strong negative impact on investment, if on the 1 %, or 0.5 %, or 0.25 %, Regulator can accept this: this will help to the state and do not exert much to investment programs of companies.
One of the main reasons for which it has become possible to carry out such studies, has been a progress in corporate finance, has been made in recent years. It relates primarily to the establishment of a modern theory of capital cost and capital structure by BrusovFilatova-Orekhova (BFO theory) and to the creation by them in the framework of this theory of modern investment models (Brusov, Filatova, Orekhova,Eskindarov, 2015; Brusov & Filatova, 2011; Brusov, Filatova, Eskindarov, et al., 2011; Brusov, Filatova, Orekhova, et al., 2011; Brusov, Filatova, & Orekhova, 2013b; Filatova, Orehova, & Brusova, 2008; P.N. Brusov, T.V. Filatova and N.P. Orekhova (2014)).
The BFO theory allows to make correct assessment of the financial performance of companies with arbitrary life time and of efficiency of investment projects of arbitrary duration. This distinguishes BFO theory from Мodigliani - Мiller theory, which is a perpetuity limit of BFO theory. Archived after the appearance of BFO theory the Мodigliani -Miller theory (Modigliani & Miller, 1958, 1963, 1966), still heavily used in the West, despite of its obvious limitations, may, mutatis mutandis, be applied to long living stable companies and long-term investment projects. In its framework in this paper effects of taxation on the effectiveness of long-term investment will be investigated.
So, at present, there are two main theories, that allow to explore the effects of taxation on the efficiency of investments: perpetuity Modigliani-Miller theory and the modern theory of capital cost and capital structure developed by Brusov, Filatova, Orekhova. In this paper we describe the first real results obtained by us within created by us investment projects in perpetuity limit, which can be applied to long-term projects.
The effectiveness of the investment project is considered from the perspectives of the equity holders. For this case, NPV is calculated in two ways: with the division of credit and investment flows (and thus discounting the payments at two different rates) and without such a division (in this case, both flows are discounted at the same rate as which, obviously, can be chosen WACC). For each of the four situations two cases are considered: 1) a constant value of equity S; 2) a constant value of the total invested capital I = S + D (D is value of debt funds).
We start first from the case with the division of credit and investment flows and then consider the case without the division of flows.
2. Model
Let us remind shortly the main points of the investment models with debt repayment at the end of the project, well-proven in the analysis of real investment projects.
Investments at the initial time moment ![]() , are equal to –S, and the flow of capital for the period (in addition to the tax shields
, are equal to –S, and the flow of capital for the period (in addition to the tax shields ![]() it includes a payment of interest on a loan
it includes a payment of interest on a loan ![]() )
)
![]() . (1)
. (1)
Here, for simplicity, we suppose that interest on the loan will be paid in equal shares ![]() during all periods. Note, that principal repayment is made at the end of last period.
during all periods. Note, that principal repayment is made at the end of last period.
Here NOI – Net Operating Income (before taxes), ![]() – debt cost, t– tax on profit rate.
– debt cost, t– tax on profit rate.
2.1. With the Division of Credit and Investment Flows
In our model in case with the division of credit and investment flows in perpetuity limit (Modigliani-Miller approximation) expression for NPV takes a following form
![]() . (2)
. (2)
We will consider two cases: 1) a constant value of the total invested capital I = S + D (D is value of debt funds);
2) a constant value of equity S.
2.2. At a Constant Value of the Total Invested Capital (I = Const)
At a constant value of the total invested capital (I = const), accounting ![]() ,
, ![]() , one gets
, one gets
![]() . (3)
. (3)
![]() , (4)
, (4)
where ![]() – leverage level;
– leverage level; ![]() – equity cost of leverage company (which uses the debt financing);
– equity cost of leverage company (which uses the debt financing); ![]() – equity cost of non-leverage company (which does not use the debt financing).
– equity cost of non-leverage company (which does not use the debt financing).
Under the transition from the equation (3) to (4) we have used the dependence of equity capital on leverage, received by Modigliani and Miller (Modigliani & Miller, 1958, 1963, 1966):
![]() . (5)
. (5)
So, we explore the equation (4). A number of conclusions can be drawn from the study of dependence of NPV of the project on leverage level at different values of tax on profit rates t (Fig. 1). It is clear that the increase of tax on profit rates leads not only to reduce of NPV of the project, but as well to decrease of the sensitivity of effectiveness of investment projects NPV to the leverage level L. At high leverage levels the influence of growth of tax on profit rates on the effectiveness of investment projects is significantly reduced.
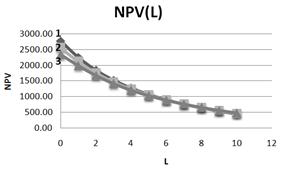
Fig. 1. Dependence of NPV on leverage level L at three values of tax on profit rate (1– t=0, 15; 2– t=0, 20; 3– t=0,25). NOI=800.
Hence, in particular, it should be noted, that taxation can be differentiated depending on the debt financing level in the company investment projects: for projects with a high leverage level L the higher tax on profit rates t can be used. The foregoing is illustrated also at Fig. 2, where it is clear that the change of NPV (DNPV) with leverage level decreases when the tax on profit rate t grows, and as well when leverage level increases.
Let us increase our return on investment in 1.5 times (NOI=1200 instead of 800) (Fig. 3). Still, the impact of the tax on profit rate on the NPV value significantly depends on the level of debt financing. So the increase in tax on profit rate by 1% from the existing (in Russia) (20 %) leads to a reduction in the NPV by 44.5 units at L=0, by 27, 7 units at L=1, by 12,2 units at L=3, by 5 units at L=5.
I.e. for companies with a high level of the debt financing (for example, companies in the telecommunication sector and other) an increase in tax on profit rate will have less impact on the effectiveness of their investment projects and will be less painful, than for companies with low leverage level in investment. It should be noted that the increase of NOI in 1.5 times increases NPV in 1.7 times (from 2555 up to 4333), and increases DNPV (L) in 1.62 at L=0, and in 1.5 times when L=9 (fig. 4).
It is clear also that, with the increase of the leverage level L curves, describing the dependence DNPV (L), virtually converge, which demonstrates once again the reduction of impact of the change of the tax on profit rate t on the efficiency of investment projects with the increase of the leverage level L.
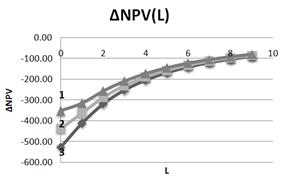
Fig. 2. Dependence of DNPV on leverage level L at three values of tax on profit rate (1– t=0, 25; 2– t=0,20; 3– t=0,15). NOI=800, I=1000.
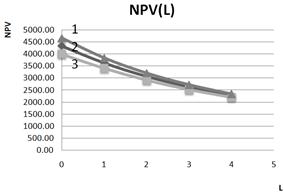
Fig. 3. Dependence of NPV on leverage level L at three values of tax on profit rate (1– t=0, 15; 2– t=0,20; 3– t=0,25). NOI=1200, I=1000.
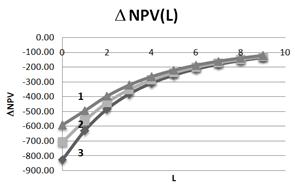
Fig. 4. Dependence of DNPV on leverage level L at three values of tax on profit rate (1– t=0, 25; 2– t=0, 20; 3– t=0,15). NOI=1200, I=1000.
2.3. Borrowings Abroad
Until recently, Russian companies have preferred to borrow abroad, because overseas credits are much cheaper than domestic ones. Although relevance of studies using such loans now is not so high in connection with the West sanctions, all same, realizing that, in the not-too-distant future, all will return to the its circles, here's a comparison of NPV dependencies on leverage at typical values of rates on credit, with borrowings abroad (![]() =0,1;
=0,1; ![]() =0,07) and with borrowings at domestic (Russian) credit market (
=0,07) and with borrowings at domestic (Russian) credit market (![]() =0,18;
=0,18; ![]() =0,14). (Here
=0,14). (Here ![]() – equity cost of financially independent company (Fig. 5). The growing of effectiveness of investment when using cheaper foreign credit is obvious. The stabilization of the situation on the external credit market a detailed analysis of this case, as well as of the case of use of domestic and overseas credits can be done.
– equity cost of financially independent company (Fig. 5). The growing of effectiveness of investment when using cheaper foreign credit is obvious. The stabilization of the situation on the external credit market a detailed analysis of this case, as well as of the case of use of domestic and overseas credits can be done.
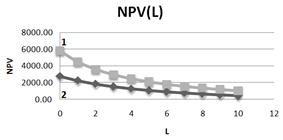
Fig. 5. Comparison of dependences of NPV on leverage level L at typical values of credit rates with borrowings abroad (1– ![]() =0, 1;
=0, 1; ![]() =0, 07) and with borrowings at domestic (Russian) credit market (2–
=0, 07) and with borrowings at domestic (Russian) credit market (2– ![]() =0, 18;
=0, 18; ![]() =0,14). NOI=800, I=1000, t=15%.
=0,14). NOI=800, I=1000, t=15%.
We analyze now the impact of the tax on profit rates on dependence of NPV on leverage level at typical values of credit rates with borrowings abroad and with borrowings at domestic (Russian) credit market.
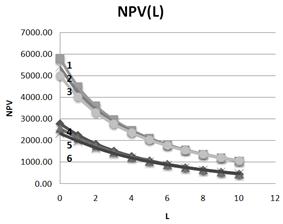
Fig. 6. Influence of tax on profit rates on dependence of NPV on leverage level at typical values of credit rates with borrowings abroad (lines 1-2 -3) and with borrowings at domestic (russian) credit market (lines 4-5 -6).
![]() =0, 1;
=0, 1; ![]() =0, 07; T=0, 15
=0, 07; T=0, 15
![]() =0, 1;
=0, 1; ![]() =0, 07; T=0, 2
=0, 07; T=0, 2
![]() =0, 1;
=0, 1; ![]() =0, 07; T=0, 25
=0, 07; T=0, 25
![]() =0, 18;
=0, 18; ![]() =0, 14; T=0, 15
=0, 14; T=0, 15
![]() =0, 18;
=0, 18; ![]() =0, 14; T=0, 2
=0, 14; T=0, 2
![]() =0, 18;
=0, 18; ![]() =0, 14; T=0, 25
=0, 14; T=0, 25
It is clear that, at low leverage levels influence of tax on profit rates is very significant: at zero leverage the NPV drops by 80 units at increase of tax on profit rates on 1% when one borrows abroad and on 44 units when one borrows at domestic (russian) credit market. It would seem that this could be one of the signals for borrowing within the country, however, taking into account the different values of NPV at two considering cases (ratio is 2.1), we come to the conclusion that the impact of tax on profit rates is in close proportions (ratio is 80/44 = 1.8). So it seems that after the West sanctions will be over, to borrow at the West will be more advantageous for a long time.
2.4. Dependence of NPV on Tax on Profit Rates at Different Leverage Levels
From Fig.7 it is seen that dependence of NPV on tax on profit rates significantly depends on the leverage level L.
When there is no borrowing NPV linearly decreases with t with a factor - 43.44 units at 1 %. When L=1 this factor (at t = 20 %) is equal to - 27.7 units at 1 %, when L=3 this factor (when t = 20 %) is equal to - 12.3 units at 1 %, and when L=5 this factor (at t = 20 %) is equal to - 5.8 units. at 1 %. It can be seen that the influence of tax on profit rate on efficiency of investment projects drops significantly with increase of the leverage level L used in investments.
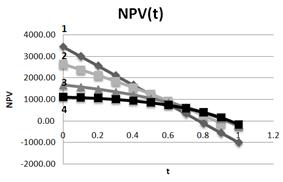
Fig. 7. Dependence of NPV on tax on profit rate at different leverage levels L (1– L=0; 2– L=1; 3– L=3; 4–L=5). NOI=800.I=1000.
This is particularly seen at Fig. 8 in the dependence of DNPV on tax on profit rate at different leverage levels L (here DNPV - increment of NPV under change of t for 10 %). When there is no borrowing DNPV= – 450 and does not depend on tax on profit rate. At t=20%: at L=1 DNPV= – 276, 6; at L=3 DNPV= – 122, 6; at L=5 DNPV=– 49. It is clear that the change of tax on profit rate affect mostly the effectiveness of the projects, funded by equity capital only, and if you use debt financing to finance the projects impact of the change of tax on profit rate drops very substantially (up to ten times).
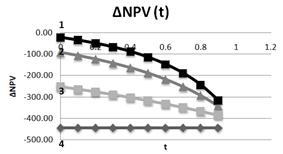
Fig. 8. Dependence of DNPV on tax on profit rate at different leverage levels L (1– L=5; 2– L=3; 3– L=1; 4– L=0). NOI=800.I=1000.
2.5. At a Constant Value of Equity Capital (S = Const)
At a constant value of equity capital (S = const), when investment growth is associated with the increased borrowing only, the dependence of NPV on leverage level is qualitatively different in nature, rather than in the case of a constant value of invested capital. Now, depending on the values of the coefficient ![]() NPV can grow with leverage level. It should be noted that, in this case (at large values of the coefficient b) the optimal structure of invested capital, in which NPV is maximized could take place. NPV in this case is described by the following expression
NPV can grow with leverage level. It should be noted that, in this case (at large values of the coefficient b) the optimal structure of invested capital, in which NPV is maximized could take place. NPV in this case is described by the following expression
![]() (6)
(6)
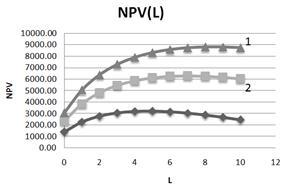
Fig. 9. Dependence of NPV on leverage level L at three values of β-coefficient (1–β =1, 5; 2–β =1, 2; 3 – β =0, 8).S=500.
It is seen from the fig. 9 that with the increase of the coefficients β value NPV and its optimal (maximum) values grow.
It follows from Fig.10, that with the increase of the leverage level DNPV drops and either goes to the saturation (DNPV= 0), or becomes negative (DNPV< 0), and that means that there is an optimum (after DNPV>0 at small leverage level L).
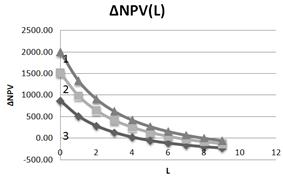
Fig. 10. Dependence of DNPV on leverage level L at three values of β- coefficient (1–β =1, 5; 2–β =1,2; 3 – β =0,8).S=500.
Below at Fig. 11 and 12 the dependencies of DNPV and NPV on tax on profit rate at different leverage levels and at S=500, β=0, 8 are shown.
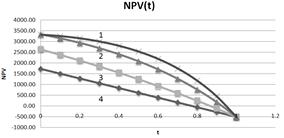
Fig. 11. Dependence of NPV on tax on profit rate at different leverage levels L (1– L=5; 2– L=3; 3– L=1; 4– L=0). S=500, β=0, 8.
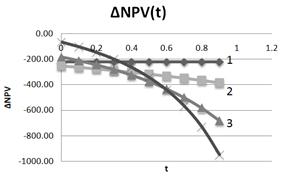
Fig. 12. Dependence of DNPV on tax on profit rate at different leverage levels L (1– L=0; 2– L=1; 3– L=3; 4– L=5). S=500, β=0, 8.
From Fig. 11 as well as from Fig. 9, it is seen, that at fixed tax on profit rate NPV grows with leverage level. With the increasing of tax on profit rate NPV drops, and curves, corresponding to the different leverage level converge in one point at t= 100% and NPV= - S in accordance to equation (6). Change of DNPV with increasing of t also depends on the leverage level: with the growth of the leverage level it changes from constant (at L= 0) up to the increasingly growing at t>30%–40% at L=1; 3; 5.
3. Without Flows Separation
Let us consider the case without the division of credit and investment flows. In this case, both flows are discounted at the same rate as which, obviously, can be chosen WACC). In perpetuity limit (![]() ) one has
) one has
![]() . (7)
. (7)
3.1. At a Constant value of the Total Invested Capital (I = Const)
In case of a constant value of the total invested capital (I = const), accounting
![]() ,
, ![]() , we get
, we get
![]() (8)
(8)
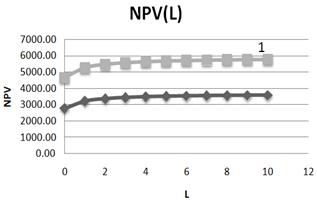
Fig. 13. Dependence of NPV on leverage level L at two values of NOI (1– NOI=1200; 2– NOI=800). I=1000.
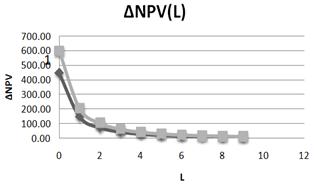
Fig. 14. Dependence of DNPV on leverage level L at two values of NOI (1– NOI=1200; 2– NOI=800). I=1000.
NPV rather quickly goes to the saturation, at L>4 it varies weakly, and the leverage level, at which the saturation of NPV (L) takes place, practically does not depend on NOI.
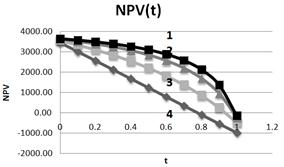
Fig. 15. Dependence of DNPV on tax on profit rate at different leverage levels L (1– L=5; 2– L=3; 3– L=1; 4–L=0). NOI=800. I=1000.
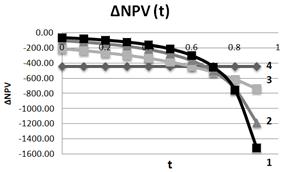
Fig. 16. Dependence of DNPV on tax on profit rate at different leverage levels L (1– L=5; 2– L=3; 3– L=1; 4–L=0). NOI=800. I=1000.
NPV falls down with growth of tax on profits rate at different leverage levels:
At L=0 at change of tax on profits rate on 1%, NPV falls down on 1.74%;
At L=1 at change of tax on profits rate on 1%, NPV falls down on 0.85%;
At L=3 at change of tax on profits rate on 1%, NPV falls down on 0.43%;
At L=5 at change of tax on profits rate on 1%, NPV falls down on 0.29%;
It is seen that, with the rising of the tax on profit rate by 1 %, NPV drops the less at the higher leverage level. This confirms the conclusion, made in the previous section, that with the increase of the leverage level a negative impact of the growth of the tax on profit rate declines in a few times, allowing to the Regulator to establish the differentiated tax on profit rates (as can be seen from Fig.16, the founded conclusions are true up to tax on profit rates values of 70% to 80 %).
3.2. At a Constant Value of Equity Capital (S = Const)
![]() . (9)
. (9)
Substituting ![]() , one gets
, one gets
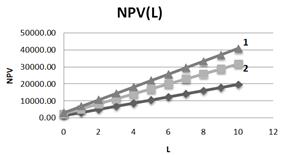
Fig. 17. Dependence of NPV on leverage level L at three values of β - coefficient (1–β =1, 5; 2–β =1,2; 3 – β =0,8).S=500.
![]() (10)
(10)
From Fig.17 it follows, that NPV grows linearly with leverage level and speed of its growth increases with grows of coefficient β.
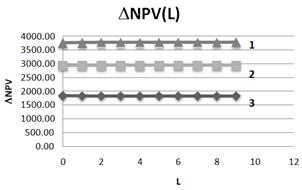
Fig. 18. Dependence of DNPV on leverage level L at three values of β - coefficient (1–β =1,5; 2–β =1,2; 3 – β =0,8).S=500.
From Fig. 18 it follows, that DNPV practically does not depend on leverage level L and at decrease of β - coefficient in 1.25 times (the transition from line 1 to line 2) DNPV is decreased in 1.28 times (practically so), and at decrease of β - coefficient in 1.5 times (the transition from line 2 to line 3) DNPV is decreased in 1.59 times (practically so).
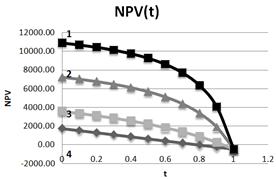
Fig. 19. Dependence of NPV on tax on profit rate t at different leverage levels L (1– L=5; 2– L=3; 3– L=1; 4–L=0). S=500.
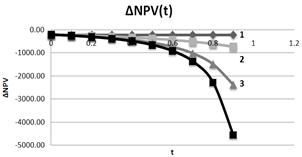
Fig. 20. Dependence of NPV on tax on profit rate t at different leverage levels L (1– L=0; 2– L=1; 3– L=3; 4–L=5). S=500.
As in case of constant value of investments (I = const), at constant equity capital value (S = const) NPV falls down with growth of tax on profit rate t at different leverage levels L.
Let's take a look at the region of changes of tax on profits rates from 0% up to 60%. In this region:
At L=0 at change of tax on profits rate on 1%, NPV falls down on 3.6%;
At L=1 at change of tax on profits rate on 1%, NPV falls down on 1.23%;
At L=3 at change of tax on profits rate on 1%, NPV falls down on 0.46%;
At L=5 at change of tax on profits rate on 1%, NPV falls down on 0.22%;
And so, with the increasing of the tax on profits rates at the 1 %, NPV drops the less for the higher leverage level. This correlates with the conclusion made above and in the previous section, that with the increase of the leverage level a negative impact of the growth of the tax on profit rates declines in a few times, allowing the regulator to introduce differentiated tax on profits rate (as it can be seen from Fig.19 and 20, the findings are true up to values of tax on profits rates 60 %). At higher rates (that, however, is a purely theoretical interest) the situation will be different.
4. Conclusions
Within investment models, developed by Brusov, Filatova, Orekhova earlier the influence of tax on profit rate on effectiveness of long–term investment projects at different debt levels is investigated. The ability to obtain of quantitative estimates of such impact on the projects with various costs of equity and debt capital, at an arbitrary structure of invested capital has been demonstrated. It is shown, that increase of tax on profit rate from one side leads to decrease of project NPV, but from other side it leads to decrease of sensitivity of NPV with respect to leverage level. At high leverage level L the influence of tax on profit rate increase on effectiveness of investment projects becomes significantly less. We come to conclusion, that taxing could be differentiated depending on debt level of investment projects of the company: for projects with high debt level L it is possible to apply a higher tax on profit rate.
These recommendations, in particular, may be addressed to the Regulator. Effects of taxation on the effectiveness of investment projects depends on the level of leverage, of the project duration, of the equity cost, as well as of the level of returns on investment (NOI) and of methods of forming of invested capital. Study of all these problems, as the results of this paper show, may be successfully carried out within investment models developed by Brusov, Filatova, Orekhova, using discount rates, derived from the Brusov-Filatova-Orekhova (BFO) theory.
References
- Brusov P, Filatova T, Orehova N, Eskindarov M (2015), Modern corporate finance, investments and taxation, Springer International Publishing, Switzerland, 373 p.
- Brusov, P. N., & Filatova, T. V. (2011). From Modigliani–Miller to general theory of capital cost and capital structure of the company. Finance and Credit, 435, 2–8.
- Brusov, P., Filatova, T., Eskindarov, M., Orehova, N., Brusov, P., & Brusova, A. (2011). Influence of debt financing on the effectiveness of the finite duration investment project. Applied Financial Economics, 22, 1043–1052.
- Brusov, P., Filatova, T., Orehova, N., & Brusova, N. (2011). Weighted average cost of capital in the theory of Modigliani–Miller, modified for a finite life-time company. Applied Financial Economics, 21, 815–824.
- http://dx.doi.org/10.1080/09603107.2010.537635
- Brusov, P., Filatova, T., Orehova, N., Brusov, P. P., & Brusova, N. (2011a). Influence of debt financing on the effectiveness of the investment project within Modigliani–Miller theory. Research Journal of Economics, Business and ICT, 2, 11–15.
- Brusov, P., Filatova, T., Orehova, N., Brusov, P. P., & Brusova, N. (2011b). From Modigliani–Miller to general theory of capital cost and capital structure of the company. Research Journal of Economics, Business and ICT, 2, 16–21.
- Brusov, P. N., Filatova, T. V., & Orekhova, N. P. (2013a). Absence of an optimal capital structure in the famous tradeoff theory! Journal of Reviews on Global Economics, 2, 94–116.
- Brusov, P. N., Filatova, T. B., & Orekhova, N. P. (2013b). Modern corporate finance and investment (517 pp.). Moscow: Knorus.
- Filatova, T. V., Orehova, N. P., & Brusova, A. P. (2008). Weighted average cost of capital in the theory of Modigliani–Miller, modified for a finite life-time company. Bulletin of the FU, 48, 68–77.
- Modigliani, F., & Miller, M. (1958). The cost of capital, corporate finance and the theory of investment. American Economic Review, 48, 261–297.
- Modigliani, F., & Miller, M. (1963). Corporate income taxes and the cost of capital: A correction. American Economic Review, 53, 147–175.
- Modigliani, F., & Miller, M. (1966). Some estimates of the cost of capital to the electric utility industry 1954–1957. American Economic Review, 56, 333–391.


