
American Journal of Economics, Finance and Management, Vol. 1, No. 3, June 2015 Publish Date: May 14, 2015 Pages: 184-189
The Validity of Capital Asset Pricing Model (CAPM) and Arbitrage Pricing Theory (APT) in Predicting the Return of Stocks in Indonesia Stock Exchange 2008-2010
Zainul Kisman1, Shintabelle Restiyanita M.2, *
1Department of Finance, School of Business and Manaagement, Universitas Trilogi (STEKPI), Jakarta, Indonesia
2Graduate School of Business and Management, Universitas Trilogi (STEKPI), Jakarta, Indonesia
Abstract
Financial experts have developed two approaches to measure the required return of stock, those are the Capital Asset Pricing Model (CAPM) and Arbitrage Pricing. Theory (APT). CAPM explains that stock return is the sum of the risk free rate plus beta times the excess return. While APT explain that return can be predicted by using a number of macro factors (such as GDP, inflation, and others).The purpose of this study was to determine whether there is an effect of the market excess return on LQ45 companies stock returns (using CAPM) and also whether there is an effect of the variable / factor Arbitrage Pricing Model(APT) as Gross Domestic Product and Interest rate on stock returns in period 2008-2010. By using multiple regression, the results show that CAPM and APT, with the t-test and F-test results are very significant. Based on coefficient of determination, APT is better than CAPM in predicting stock returns. The limitation of the model which is used in this study is depend on the capital market wheter efficient or not. This study differs from other studies due to be implemented in emerging capital markets and decisively APT better to determine the return.
Keywords
Return, CAPM, APT, Validity, Predicting
Received: April 5, 2015 / Accepted: April 17, 2015 / Published online: May 11, 2015
@ 2015 The Authors. Published by American Institute of Science. This Open Access article is under the CC BY-NC license. http://creativecommons.org/licenses/by-nc/4.0/
1. Introduction
Financial experts have developed two approaches to predict the return of an investment based on its risk or use a variable as well as certain factors of the macro economic. Those approaches are the Capital Asset Pricing Model (CAPM) and Arbitrage Pricing Theory (APT).
Capital Asset Pricing Model (CAPM) introduced by William Sharpe (1964) and Litner (1965) describes that in the condition of equilibrium, asset return is the sum of the risk free rate plus beta times the excess return. Risk is measured only by the sensitivity of individual securities return to the market index return (beta). One of the assumptions in the CAPM is that all investors have the same mindset or way of looking at the investment, especially in estimating the expected return of a stock. In the real world this assumption clearly has a weakness, because no one proxy is sufficient to describe why return of a stock changes. The changes of return of one stock can not be explained by one factor (market index) only.
Therefore, in 1976, Stephen A. Ross formulate a theory called the Arbitrage Pricing Theory (APT) is described by Sjahrial Benefactor (2007). Although this model as a whole can not solve the deficiencies contained in the CAPM model, but this is the first model was developed to try to eliminate the deficiencies that occur in the CAPM model.So that making the Arbitrage Pricing Theory to be a potential substitute for investment decision makers is that the attempt to explain the relationship of risk and expected return by using multiple factors instead of the single market index. Ross stated that the expected return variation caused by changes in GDP, inflation, term structure and other economic variables.
From several previous studies on the relationship between the CAPM and the APT with stock returns, research has been done there is a difference of selected variables and produce different conclusions. Among previous studies that give different conclusions among others:
1) Delly, period 2001 to 2006, the results of studies using the standard deviation is known that the CAPM model is more accurate than the APT model in predicting stock returns.
2) Gancar Premananto Candra and Muhammad Madyan doing research in 1991-2001.There are significant differences between the accuracy of the CAPM model with APT model in predicting stock returns of manufacturing industries during the economic crisis, in which the CAPM model is more accurate than the APT model.
3) H. Jamal Zubairi and Shazia Farooq conducted the study in 2004-2009. In conclusion, this study explains that both the CAPM and the APT model does not indicate a valid results in the recovery of prices in the oil, gas and fertilizer.
With the two theories is the Capital Asset Pricing Model (CAPM) and Arbitrage Pricing Theory (APT), as well as the weaknesses that are owned by each model in predicting stock returns. Then based on the background described above, the authors are interested to make this as a topic role in the study with the title:
" THE VALIDITY OF CAPITAL ASSET PRICING MODEL (CAPM) AND ARBITRAGE PRICING THEORY (APT) IN PREDICTING THE RETURN OF STOCKS IN INDONESIA STOCK EXCHANGE 2008-2010".
In order to understand how to predict return (required rate of return) of one stock or investment in the emerging markets, this paper is therefore devoted to investigate required return of a stock of LQ45 companies listed in Indonesian Stock Exchange (IDX) using CAPM or APT, one of the most prospective market in Asia. Special attention will be given to study which one is better (testing the validity), CAPM or APT.
2. Method
2.1. Framework of the Study
Based on theoretical study and previous research, an analytical and framework of study was made to show the flow this research (see Figure-1).
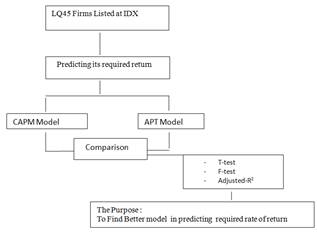
Figure 1. Flow of this Research
In the first, we take LQ45 firms in IDX.
To investigate the influence of excess return market to return of stock, this research using CAPM Model : ![]()
![]() Where :
Where :
![]() = Expected return on security i
= Expected return on security i
![]() = Risk free rate of return
= Risk free rate of return
![]() = Market return
= Market return
![]() = Sensitivity
= Sensitivity
and to investigate the influence of GDP and Interest rate using APT model :
![]()
Where :
![]() = Expected return on stock i, period t
= Expected return on stock i, period t
![]() = Constant.
= Constant.
![]() = Sensitivity of each factor.
= Sensitivity of each factor.
![]() = Economic growth rate in period t
= Economic growth rate in period t
![]() = Interest rate in period t
= Interest rate in period t
![]() = Random error
= Random error
2.2. Data and Analysis
Research was undertaken on LQ45 firms listed at IDX in 2008-2010. The criteria for the selection of firms to be made sample are:
The firms have been always/continuously listed in LQ45 index at IDX during that period 2008-2010.
Firms that issue quarterly financial statements during the period 2008-2010.
Data were collected from various sources, such as www.idx.co.id, Indonesia Capital Market Directory (ICMD) and Annual Report (audited). All variables used are ratio measurement scales. Those variables are: ![]() =Expected return on security i,
=Expected return on security i,![]() = Risk free rate of return,
= Risk free rate of return, ![]() = Market return ;
= Market return ; ![]() = Expected return on stock i, period t,
= Expected return on stock i, period t, ![]() = Economic growth rate in period t,
= Economic growth rate in period t, ![]() = Interest rate in period t.
= Interest rate in period t.
The hypotheses in this research are:
From CAPM
H1: Expected return on security is affected by Excess return market ( Rm-Rf).
From APT
H2: Expected return on security is affected by GDP and Interest rate.
3. Result
3.1. The Result of CAPM
To determine the effect of excess return on stock return, regression equation is used:
Return = -0482 + 0278 Excess Return + e
The results of this regression model indicates variable. excess return has a positive influence on stock returns.
3.1.1. Partial Test (T-Test)
Test to determine the effect of the partial effect of each independent variable on the dependent variable, this test using the t-test (Gujarati, 2008; Hill et al, 2001). Based on calculations in the table above (table 3.1), a partial test for each independent variable are as follows: The significant value of excess return on stock returns are for 0, 0000. This result is smaller than the value α = 0.05 (excess return significant value = 0.000 <α value = 0.05). It means that the excess return has a significant positive influence on stock returns.
Table 3.1. The results of calculation of regression coefficients, T-test and Significance-value
| Coefficientsa | ||||||
| Model | Unstandardized Coefficients | Standardized Coefficients | ||||
| B | Std. Error | Beta | t | Sig. | ||
| 1 | (Constant) | -0.482 | 0.026 | -18.764 | 0 | |
| Excess_Return | 0.278 | 0.041 | 0.467 | 6.797 | 0 | |
| a. Dependent Variable: Return | ||||||
Source : Data Processed with SPSS 17.
Table 3.2. The results of calculation of coefficient of determination
| Model Summaryb | ||||
| Model | R | R Square | Adjusted R Square | Std. Error of the Estimate |
| 1 | .467a | .218 | .213 | .182991 |
| a. Predictors: (Constant), Excess_Return | ||||
| b. Dependent Variable: Return | ||||
Source : Data Processed with SPSS 17.
Table 3.3. The results of calculation of regression coefficients, T-test and Significance-value
| Coefficientsa | ||||||
| Model | Unstandardized Coefficients | Standardized Coefficients | ||||
| B | Std. Error | Beta | t | Sig. | ||
| 1 | (Constant) | .089 | .009 | 10.021 | .000 | |
| GDP | .038 | .008 | .386 | 4.488 | .000 | |
| Interest | -.128 | .015 | -.724 | -8.411 | .000 | |
Source : Data Processed with SPSS 17.
3.1.2. Coefficient of Determination
From table 3.2above, R2 (R square) of 0,218 or 21.8%. This suggests that 21.8% stock return variation can be explained by the variation of independent variable (excess return) while the rest 78.2% is influenced another factors that are not revealed in this study.
3.2. The Result of APT
In analysis of APT, this research using multiple regression analysis to determine whether there is an effect of the two variables as independent variables (GDP and Interest rate) to the dependent variable ( return on LQ45-stock).
To determine the effect of GDP and Interest rate on required return of stock, regression equation is used:
Return = 0089 + 0038 GDP - 0128 Interest + e
The results of this regression model indicates the direction of the effect of each independent variable consisting of GDP and Interest rate on the dependent variable (stock returns). GDP has a positive influence on stock returns, while Interest rate has a negative effect on stock returns.
3.2.1. Partial Test (T-Test)
Test to determine the effect of the partial effect of each independent variable on the dependent variable, this test using the t-test (Gujarati, 2008; Hill et al, 2001). Based on calculations in the table 3.3 above, a partial test for each independent variable are as follows:
1) Gross Domestic Product (GDP).
Significant value of GDP on return is 0, 000. This result is smaller than the value α = 0.05 (significant value of GDP = 0000 < the value of α = 0.05). It means that the GDP has a significant positive influence on stock returns.
2) Interest.
Significant value of interest rate on return is equal to 0,000. This result is smaller than the value α = 0.05 (Interest significant value = 0.000 < α value = 0.05). It means that the interest rate has a significant negative influence on stock returns.
3.2.2. Simultaneous Test (F-Test)
To determine whether there is simultaneously influence of independent variables (GDP and Interest rate) on the dependent variable (stock return), this study used F-test (Gujarati, 2008; Hill et al, 2001).
Table 3.4. Result of the F-test Value
| Anovab | ||||||
| Model | Sum of Squares | df | Mean Square | F | Sig. | |
| 1 | Regression | .091 | 2 | .045 | 37.676 | .000a |
| Residual | .087 | 72 | .001 | |||
| Total | .177 | 74 | ||||
| a. Predictors: (Constant), Interest, GDP | ||||||
| b. Dependent Variable: Return | ||||||
Source : Data Processed with SPSS 17.
Table 3.5. The Result of Calculation of Coefficient of Determination
| Model Summaryb | ||||
| Model | R | R Square | Adjusted R Square | Std. Error of the Estimate |
| 1 | .715a | .511 | .498 | .034667 |
| a. Predictors: (Constant), Interest, GDP | ||||
| b. Dependent Variable: Return | ||||
Source : Data Processed with SPSS 17.
From table 3.4 above, significant F values obtained is 0, 000. This result is smaller than the value α = 0.05 (significant value of F = 0.000 < α value = 0.05). It means that theGross Domestic Product (GDP) and Interest rate together (simultaneous) have effect on stock returns.
3.2.3. Coefficient of Determination
From the table 3.5 above: R2 is 0,511 or 51.1%. This suggests that the 51.1% stock return variation can be explained by the independent variable (Gross Domestic Product --GDP and interest) while the remaining 48.9% influenced by other factors that are not revealed in this study.
4. Discussion
From table 3.1the results of this regression model indicates excess return variable has a positive influence and significant on stock returns. It means that the higher the excess return market the higher the stock return and the market more confidence on the prospects of the company.It will be an attractive for investors to buy it. And demand for these shares will go up, then push the stock price rises. It can be concluded that the higher the excess return will contribute to the higher return of the stock, or vice versa. These findings support the results of studies of Candra Gancar Premananto and Muhammad Madyan doing research in 2004 showed that the excess return is positive and significant effect on the stock return. Based on the results of this study excess market returns can be used as predictors in predicting stock returns. Of course besides that, the investors in predicting return also pay attention to the performance of the company (issuer, including its risk) and macro-economic condition.
This research found only 21, 8% stock return variation which can be explained by variations in the independent variable (excess return market), and 78.2% while the rest is influenced another factors that are not revealed in this study. In addition, investors should also consider other factors beyond the company's policies such as economic, social, political, national security, natural disasters happening everywhere and bombings in various places as a cause of lack of confidence of foreign investors to invest on companies in Indonesia
From Table 3.3, the results of this regression model indicates the direction of the effect of each independent variable consisting of GDP and Interest rate on the dependent variable (stock returns). GDP has a positive effect on stock returns, while interest rate has a negative effect on stock returns.It means the higher the value of GDP indicates the share price increases. If the stock price increases, so the stock return is also increase. So the higher the GDP, the higher stock return and it will be an attractive for investors to buy it.And the demand for these shares will go up, then push the stock price rises. It can be concluded that the higher GDP will contribute to the return value is higher or vice versa if the lower GDP will contribute to the value of the lower stock returns.These findings support the results of research by Delly to determine the comparative accuracy between the CAPM and APT models in predict stock returns in the period 2001-2006. This research shows that the Gross Domestic Product (GDP) has positive and significant impact on return. Based on the results of this study, GDP can be used as a predictor in predicting stock returns.
From table 3.3 we found that interest rate has negative effect on stock returns.It means that the lower the interest rate the stock price is increasing. If the stock price increases, indicating that the stock is increasingly in demand by investors. So that the lower the interest, the higher the level of confidence on the prospects of the company, it will be an attraction for investors to buy it.And the demand for these shares will go up, then push the stock price rises. It can be concluded that the lower the interest will contribute to the return value is higher than before or vice versa.
These findings support the results of research by Delly to determine the comparative accuracy between the CAPM and APT models in predicting stock returns in the period 2001-2006. This research shows that interest rate has a significant negative effect on the return. Based on the results of this study, Interest rate can be used as predictors in predicting stock returns.
5. Concluding Remarks
Based on the results of research and discussion in the previous section, it can be concluded as follows:
a) Statistically, both in CAPM and APT model, stock return is significantly influenced (partially or simustaneously) by its independent variable (in CAPM: market excess return; in APT is GDP and Interest rate).
b) Viewed from the adjusted coefficient of determination (adjuster R2), the accuracy of the results of model calculations with the Arbitrage Pricing Theory (APT) is better than the results of model calculations with Capital Asset Model (CAPM) in predicting stock returns.Because the market excess return is able to explain the variation in stock return only 21.8% (in theCAPM model). While the variable Gross Domestic Product (GDP) and Interest rate on Arbitrage Pricing Theory Model (APT) is able to explain the variation in stock returns 51.1%. In this study, APT model is better and more accurate model than the CAPM model in predicting stock returns.
The suggestions for further research are as follows:
Both models can be used to predict stock returns. However, from the accuracy and validity , it should be better advised to use the APT rather than CAPM model as if seen from the adjusted coefficient of determination ( R2), APT models are better able to explain the variation in stock returns is higher than the CAPM model. The limitation of the model which is used in this study is depend on the capital market wheter efficient or not (Brealey et al, 2014; Foster et al, 2005; Megginson, 1997).
References
- Berk, JonathanandPeter Demarzo. Corporate Finance. Jakarta: Pearson, 2007.
- Brealey,Richard A., Stewart C. Myers, Franklin Allen.2014. Principles of Corporate Finance: Global Edition, 11/e.McGraw-Hill.
- Delly." Perbandingan Keakuratan Capital Asset Pricing Model CAPM) dan Arbitrage Pricing Theory (APT) dalam Memprediksi Return Saham yang Aktif di PT. Bursa Efek Indonesia (BEI) dan di Singapore Stock Exchange, 2001-2006". Surabaya. Universitas Kristen Petra.
- Foerster,Stephen R, and Stephen G Sapp.2005. Valuation of financial versus non-financial firms: a global perspective.Journal of International Markets,Institution and Money.Volume 15,January 2005.
- Gitman, Laurence, J. Priciple of Managerial Finance. Jakarta: PrenticeHall,2000.
- Gujarati,Damodar N and Dawn Porter.2008.Basic Econometrics. McGraw- Hill/Irwin; 5 edition.
- Hill, R.C., W.E. Griffiths and G.G. Judge, 2001. Econometrics (2nd edition).John Wiley and Sons,New York, NY, USA.
- Jogiyanto, Hartono. Teori Portofolio dan Analisis Investasi. Yogyakarta: LibertyJogyakarta,2000.
- Megginson, William L.1997. Corporate Finance Theory.Addison Wesley. United States.
- Premanto, Gandar Candra dan Muhammad Madyan. ." Perbandingan Keakuratan Capital Asset Pricing Model (CAPM) dan Arbitrage Pricing Theory (APT) dalam Memprediksi Tingkat Pendapatan Saham Industri Manufaktur Sebelun dan Semasa Krisis Ekonomi,1991-2001". Universitas Airlangga.
- Ross, Stephen A.1976.The Arbitrage Theory of Capital Asset Pricing.Journal of Economic Theory 13,1976.
- Sharpe,William F.1964."Capital Asset Prices: A Theory of Market Equilibrium under Conditions of Risk".The Journal of Finance, Vol. 19, No. 3 (Sep., 1964).
- Zubairi, Jamal dan Shazia Farooq. " Testing The Validity Of Capital Asset Pricing Model (CAPM) and Arbitrage Pricing Theory (APT) In The Oil, Gas, and Fertilizer Companies Listed The Karachi Stock Exchange,2004-2009". Karachi. Department Of Finance and Accounting College of Business &Management.


