
American Journal of Economics, Finance and Management, Vol. 1, No. 2, April 2015 Publish Date: Mar. 28, 2015 Pages: 85-91
Measuring Innovation in Increasing Product Competitiveness (Study on Craft Industry of Banyumulek Pottery)
Nenet Natasudian Jaya*
Management Department, Faculty of Economic, Mahasaraswati University of Mataram, Mataram, West Nusa Tenggara, Indonesia
Abstract
The pottery craft industry in Banyumulek, sub-district of Kediri, West Lombok District, West Nusa Tenggara Province has contributed to the economy of the community. It plays a strategic role in improving the dynamics of the local and national economy. It is known that innovation is the foundation for the craft industry to competitiveness. Therefore, the issues to be addressed in this study is how influence the innovation to the competitiveness. This study aims to produce a measurement model of innovation in improving the competitiveness of the Banyumulek pottery industry. The population in this study is all pottery business owners in Banyumulek, Kediri, West Lombok, West Nusa Tenggara. Primary data collection is through a questionnaire survey, and then analyzed using Structural Equation Modeling (SEM). Result of the research is: innovation culture has positive effect on innovation; innovation capacity has not positive effect on innovation; technical innovation has positive effect on innovation capacity; administrative innovation has positive effect on innovation capacity; and, innovation has positive effect on competitiveness.
Keywords
Innovation, Product Competitiveness, Banyumulek Pottery
Received: March 14, 2015
Accepted: March 26, 2015
Published online: March 27, 2015
@ 2015 The Authors. Published by American Institute of Science. This Open Access article is under the CC BY-NC license. http://creativecommons.org/licenses/by-nc/4.0/
Contents
1. Introduction 2. Literature Review 2.1. Craft Industry of Banyumulek Pottery 2.2. Innovation Measurement 2.3. Competitiveness Measurement 2.4. Hypothesis 3. Research Methods 3.1. Population and Respondent Sample 3.2. Data Collection 3.3. Data Analysis 4. Result and Discussion 4.1. Validity Test 4.2. Reliability Test 4.3. SEM Data Processing 4.4. Hypothesis Test Results 5. Conclusion Acknowledgements
1. Introduction
Pottery is a cultural product (craftsmanship), its existence is always associated with social usefulness with regard to supporting community activities. This is evident in the production that are still inspired by the works of supporting daily life in the ceremony as well as household activities. Through the skills of artisans in developing and creating new forms such as flower vases, ashtrays, candle holders, water jars, barrel and the form of garden lighting by combining traditional elements as characteristic of the region will determine the growth of pottery in this area. Similarly, the role of designers in an effort to develop and create regional characteristics will determine, through the skills they are the embodiment of pottery with a touch of modern values will become more attractive and identity.
A thriving pottery industry in Banyumulek, sub-district of Kediri, West Lombok, West Nusa Tenggara has contributed to the economy of the community. Despite the relatively low contribution to GDP and productivity of workers are lagging behind, pottery industry plays a strategic role in improving the dynamics of the local economy primarily in siphoning the labor overflow. It certainly deserves to get the attention of the various parties concerned to the existence of small and medium industries those enough role in supporting the national economy.
Business coaching by the government so far has given a big share primarily in providing training assistance, free license acquisition of raw materials, market accessibility fairly regularly from domestic and foreign tourists that easily come to the Banyumulek Village. The government has also been spurred to grow the business cooperatives, but less work because they cannot provide services contribute quite flexible and adequate to the actual issues of the craftsmen. While the funds development of various state-owned companies often cannot be distributed because hampered by craftsmen organization that have not been institutionalized. Although the product has reached the international market, but the management is done in a simple effort of even very weak from the institutional aspects. Therefore, the local community needs support from academicians as partners to improve the technical and management capabilities to strengthen competitiveness in the global market dynamics.
Based on the above, it is known that innovation is the foundation for the craft industry to achieve competitiveness. Therefore, the issues to be addressed in this study are how much influence the innovation to the competitiveness of the Banyumulek pottery industry. In the measurement of innovation, the elements that affect are innovation culture and innovation capacity, while the measurement of competitiveness, the indicators is divided into competitiveness of products and competitiveness of the organization.
This research aims to ggenerate a measurement model of innovation in improving the competitiveness of the Banyumulek pottery industry. And theoretical uses, this research is as the deepening of knowledge about innovation and organizational competitiveness, particularly in relation to the pottery industry. And for practical uses, it contributes ideas for the community, especially the West Lombok regency government, to take measures within the framework of the promotion and development of creative industries.
2. Literature Review
2.1. Craft Industry of Banyumulek Pottery
Department of Industry and Trade of West Nusa Tenggara Province recorded that Lombok pottery able to penetrate markets in 14 countries across Asia, Europe and Africa. Total export value of Lombok pottery craft in 2013 reached 108.773 US dollars. Opportunities in overseas markets for a variety of craft products are still open, but these opportunities can not be worked optimally by craft entrepreneurs in West Nusa Tenggara. It did not escape from the various constraints such as quality and design that does not meet the tastes of the market, the lack of knowledge about the craft entrepreneurs foreign trade and the limited ability of human resources, in particular mastery of technology, management, business insight related to education crafters. Seeing this, the government tried to facilitate through a colloquium with the employers and manufacturers in order to improve the quality of pottery products. The government also aims to increase the knowledge of employers regarding foreign trade information and motivates all parties to help businesses improve the quality of the product and may follow international scale exhibitions. [1]
2.2. Innovation Measurement
Elements that affect innovation are innovation culture and innovation capacity. For the measurement of competitiveness, the model to be used is the model belongs to [12]. Innovation culture describes openness to innovation, which is determined by whether the members of the company accept or reject the existing innovation. Four dimensions that make up the innovation culture are the participation of decision-making, power sharing, support and cooperation, and learning and development. Hurley and Hult (1998) in [14] states that innovation culture has a significant positive effect on innovation.
[14] suggested that the innovation capacity is measured by standard duration of adoption, owner’s opinion / assessment, as well as many innovations adopted by the company from a number of innovation options existed. Company with a greater capacity to innovate are able to make a competitive advantage and achieve greater levels of performance.
Innovation capacity has two elements that influence, namely technical innovation and administrative innovation. Technical innovations relating to products, services, and technologies of production processes, technical innovation or it can be said with regard to the basic work activities and may involve a product or process. Hartman, Tower, and Sebora (1994) in [14] argued that the key of companies to survive and grow is to continually develop new products and processes. He argued that technical innovation is measured by the number of new products that are successfully implemented and new production processes technologies that are successfully applied.
Administrative innovation relates to organizational structure innovation and administrative processes of an organization. In marketing management, the term innovation conventionally refers to breakthrough that related to new products. As a result, the focus of innovation in the marketing literature is much talk about the product. Although administrative innovation does not look like technical innovation, but the strong influence on the performance of the company administrative innovation is the same. Adoption of the balance between technical and administrative innovation will ensure the balance between technical systems and administrative structures. [14] argued that the administrative innovation measured by the yardstick of new organizational structures that successfully implemented and new administration processes that successfully applied.
2.3. Competitiveness Measurement
According to [13], the competitiveness of SMEs is reflected in the competitiveness of products and the competitiveness of the organization. Key indicators of competitiveness of products is among other export share, market share of foreign and domestic, the value / price of the products, and customer satisfaction, while the main indicators of competitiveness of the organization is profit, human resources (HR), R & D spending, and the type of technology used. [8] believed that without a process and product innovation, the majority of SMEs will not be able to accommodate the structural changes that occur in their economic environment. Wrong strategy for SMEs development in Indonesia so far that ultimately makes the performance of SMEs in Indonesia lags behind compared with SMEs of other countries, which is the SMEs in Indonesia is considered important primarily because it employs many workers, not because it could potentially be a source of innovation as well as SMEs in developed countries.
Measurement of the competitiveness of SMEs in this study uses the model belongs to [13]. SMEs competitiveness indicators consist of two types, namely product competitiveness and organization competitiveness indicators. Product competitiveness’ is closely related (or can be said reflected) to the level of competitiveness of SMEs that produce products. Indicators of product competitiveness are export share, foreign market share, domestic market share, value / price of the product, and customer satisfaction.
According to [10], a company achieve competitive advantage through innovation actions, including the creation of new technologies and means of production, marketing, or a new way of competing. Innovation can also be realized in the design of new products and a new way to conduct training or education in an effort to improve the human resources within the company. [10] argued that innovation is realized as a fundamental factor in determining the competitiveness of the industry which in turn will become a national competitiveness. As a key of national sustainable competitiveness, innovation capacity of enterprises, in this case SMEs in Indonesia, should be developed systematically.
Based on the description above, it can be made the study concept frame as follows:
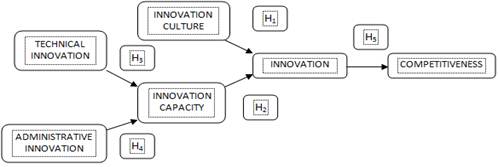
Figure 1. Conceptual Framework
2.4. Hypothesis
Based on the background, problem formulation, and above theoretical framework, the research hypotheses proposed in this study are as follows:
H1: Innovation Culture has positive effect on Innovation.
H2: Innovation Capacity has positive effect on Innovation.
H3: Technical Innovation has positive effect on Innovation Capacity.
H4: Administrative Innovation has positive effect on Innovation Capacity.
H5: Innovation has positive effect on Competitiveness.
3. Research Methods
3.1. Population and Respondent Sample
The research is conducted in the center of pottery craft industry, Banyumulek village, district of Kediri, West Lombok, West Nusa Tenggara. The population is all pottery craft enterprise owners that the number of SMEs are expected to be around 125 units. The number of samples is determined by the Yamane in [11] approach, as follows:
![]()
Note: n: number of samples
N: number of population
d: degree of error
According to the formula, the number of respondent samples in this rsearch is 95 pottery craft enterprise owners, with the degree of error is 5%.
3.2. Data Collection
Data collection is conducted by probability sampling, that taking the samples rondomly, in which the chosen opportunity of the population as the sample is the same. Using simple random sampling, which is taking a sample of the population members randomly, regardless of the strata, because the population is considered to be homogeneous [11].
The collection of primary data (directly from respondents) using survey techniques through questionnaires distributed as many as 125 pieces, each containing 25 questions about innovation and competitiveness in SMEs. This questionnaire using Likert scale with a range of answers from 1 to 5, where 1 represents strongly disagree answer, 2 represents disagree answer, 3 represents neutral answer, 4 represents agree answer, and 5 represents strongly agree answer. In addition, the data are also taken from reference books, journals, newspapers, etc (secondary data).
3.3. Data Analysis
Processing of the data in this study is divided into three stages. The first stage is validity test using test method of Kaiser-Meyer-Olkin Measure of Sampling Adequacy (KMO-MSA), Bartlett's Test of Sphericity, and communalities analysis by SPSS software. The second stage is reliability test using test method of Cronbach's Alpha (α) by SPSS software. The latter is hypotheses test and assumptions Structural Equation Modeling using AMOS software 18 (Analysis of Moment Structure).
4. Result and Discussion
4.1. Validity Test
According [11], a valid instrument showed measuring instrument used to obtain data is valid or can be used to measure what should be measured. [7] provided criteria to facilitate the interpretation of the relationship strength between two indicators, as follows:
• : no correlation between the two variables
• 0-0.25 : weak correlation
• 0.25-0.5 : fairly strong correlation
• 0.5-0.75 : strong correlation
• 0.75-0.99 : very strong correlation
• : perfect correlation
To express a strong relationship KMO-MSA numbers must be above 0.5.
In Bartlett's Test of Sphericity, three measured parameters namely Chi-Square, df (degrees of freedom), and the significance or probability. For Chi-Square, the smaller value, the better because it states there is no difference between the results of the data processed theoretically with those by observation. The degree of freedom (df) value declared parts of free information that is contained in the data set, which is used to calculate a measure of the statistical basis. Significance value represents the probability indicator of a variable where the significant value is <0.050. In this study, the significance value for the six variables is 0.000, or in other words, the relationship among indicators are significant.
Table 1. Recapitulation of KMO and Bartlett’s Test Validity Test
| No. | Variables | KMO-SMA | Bartlett’s Test of Sphericity | ||
| Approx. Chi-Square | df | Sig. | |||
| 1. | Innovation culture | 0,668 | 350,579 | 6 | 0,000 |
| 2. | Technical innovation | 0,500 | 63,210 | 1 | 0,000 |
| 3. | Administrative innovation | 0,500 | 47,279 | 1 | 0,000 |
| 4. | Innovation capacity | 0,649 | 183,791 | 3 | 0,000 |
| 5. | Innovation | 0,839 | 322,449 | 10 | 0,000 |
| 6. | Competitiveness | 0,769 | 302,196 | 36 | 0,000 |
Communalities analysis determines the amount of variance in the percentage of an initial variable that can be explained by factors that exist. Magnitude values is between 0.00 and 1.00, where the greater the value, the close relationship with the formed factor. Communalities value must be greater than 0.5. In this study, all communalities values greater than 0.500 so that it can be concluded that the indicators associated with the variables and can be a measure of the variable.
Table 2. Recapitulation of Communalities Matrix
| No | Variables | Indicators | Initial | Extraction | |
| 1. | Innovation culture | x1.1 | Decision making | 1,000 | 0,727 |
| x1.2 | Power sharing | 1,000 | 0,610 | ||
| x1.3 | Support and collaboration | 1,000 | 0,790 | ||
| x1.4 | Learning and improvement | 1,000 | 0,735 | ||
| 2. | Technical innovation | x2.1 | Number of new product applied | 1,000 | 0,817 |
| x2.2 | Succeeded new production tecnology process applied | 1,000 | 0,817 | ||
| 3. | Administrative innovation | x3.1 | Succeeded new organization structure applied | 1,000 | 0,783 |
| x3.2 | Succeeded new administration applied | 1,000 | 0,783 | ||
| 4. | Innovation capacity | y1.1 | Adoption length of time | 1,000 | 0,801 |
| y1.2 | Owner’s evaluation | 1,000 | 0,865 | ||
| y1.3 | Number of innovation adopted | 1,000 | 0,613 | ||
| 5. | Innovation | y2.1 | Relative profit | 1,000 | 0,740 |
| y2.2 | Compatibilities | 1,000 | 0,740 | ||
| y2.3 | Complexity | 1,000 | 0,777 | ||
| y2.4 | Trialability | 1,000 | 0,588 | ||
| y2.5 | Observability | 1,000 | 0,505 | ||
| 6. | Competitiveness | y3.1 | Export share | 1,000 | 0,656 |
| y3.2 | Overseas market share | 1,000 | 0,650 | ||
| y3.3 | Domestic market share | 1,000 | 0,607 | ||
| y3.4 | Product value/price | 1,000 | 0,840 | ||
| y3.5 | Consumer satisfaction | 1,000 | 0,546 | ||
| y3.6 | Profit | 1,000 | 0,600 | ||
| y3.7 | Human resources | 1,000 | 0,592 | ||
| y3.8 | R&D Expense | 1,000 | 0,606 | ||
| y3.9 | Kind of technology | 1,000 | 0,747 | ||
4.2. Reliability Test
According [10], a reliable questionnaire is questionnaire when tested repeatedly to the same group will generate the same data. [6] suggested that the reliability test that will be measured by a statistical test of Cronbach's Alpha (α) has a provision that the studied variables declared reliable if the value of Cronbach's Alpha (α) greater than 0.600. N in Table 3 states the number of measurement indicators on each of the variables that have been described previously.
Table 3. Recapitulation of Reliability Test
| No | Variables | Cronbach’s Alpha (α) | N |
| 1. | Innovation culture | 0,867 | 4 |
| 2. | Technical innovation | 0,773 | 2 |
| 3. | Administrative innovation | 0,723 | 2 |
| 4. | Innovation capacity | 0,841 | 3 |
| 5. | Innovation | 0,848 | 5 |
| 6. | Competitiveness | 0,755 | 9 |
4.3. SEM Data Processing
Normality test is useful to determine whether the data processed are normally distributed, because one of the assumptions that must be met in order to process the data using AMOS software is that data should be normally distributed. Said to be normally distributed data, if the value of its critical ratio (cr) skewness is ± 2.58. In this research the entire value of the critical ratio is ± 2.58, therefore it can be concluded that the survey data are normally distributed.
Table 4 showed the values of the loading factor between the indicator and its variable and among variables. The value of this factor loading is unstandardized value (not reduced by error). If the loading factor value not greater than 0.5, or the value of the probability of not less than 0.05, then the indicator should be discarded. From the table of indicators that are not eligible are: y2.1, y2.3, y3.5, y3.7, and y3.8 so they must be discarded. The P is the probability that the value will be used to test the hypothesis. The mark *** means significant at 0.001.
Table 4. Loading Factor and Probability
| Relation | Loading Factor | P | ||
| Innovation capacity | ← | Technical innovation | 0,258 | 0,045 |
| Innovation capacity | ← | Administrative innovation | 0,596 | 0,005 |
| Innovation | ← | Innovation capacity | -0,070 | 0,537 |
| Innovation | ← | Innovation culture | 0,391 | 0,002 |
| Competitiveness | ← | Innovation | 0,197 | 0,035 |
| x1.1 | ← | Innovation culture | 0,739 | |
| x1.2 | ← | Innovation culture | 0,614 | *** |
| x1.3 | ← | Innovation culture | 0,517 | *** |
| x1.4 | ← | Innovation culture | 0,503 | *** |
| x2.2 | ← | Technical innovation | 0,503 | |
| x3.2 | ← | Administrative innovation | 0,994 | |
| x3.1 | ← | Administrative innovation | 0,670 | *** |
| y2.4 | ← | Innovation | 0,695 | *** |
| y2.5 | ← | Innovation | 0,574 | |
| y2.2 | ← | Innovation | 0,850 | *** |
| y2.1 | ← | Innovation | 0,838 | *** |
| y3.1 | ← | Competitiveness | 0,651 | |
| y3.2 | ← | Competitiveness | 0,907 | *** |
| y3.3 | ← | Competitiveness | 0,907 | *** |
| y3.4 | ← | Competitiveness | 0,576 | *** |
| y3.6 | ← | Competitiveness | 0,571 | *** |
| y3.9 | ← | Competitiveness | 0,504 | *** |
| y1.3 | ← | Innovation capacity | 0,509 | |
| y1.2 | ← | Innovation capacity | 0,620 | *** |
| y1.1 | ← | Innovation capacity | 0,743 | *** |
4.4. Hypothesis Test Results
The hypothesis test in this study using a probability of 0.05 as a standard to determine the relationship among constructs. The significant value of this parameter is expected to provide useful information about the constructs relationship. The limit to reject or accept a relationship is: if p <0.05, H0 is rejected; if p > 0.05, H0 is accepted.
1. H1: Innovation Culture has positive effect on Innovation.
The results of data processing showed that p = 0.002. This indicates that the probability is in the rejection region. Therefore, it can be stated that H0 is rejected and H1 is accepted. Thus, the innovation culture has positive effect on innovation.
2. H2: Innovation Capacity has positive effect on Innovation.
The results of data processing showed that p = .537. This indicates that the probability is in the reception area.Therefore, it can be stated that H0 is accepted and H1 rejected. Thus, the innovation capacity has not positive effect on innovation.
3. H3: Technical Innovation has positive effect on Innovation Capacity.
The results of data processing showed that p = 0.045. This indicates that the probability is in the rejection region.Therefore, it can be stated that H0 is rejected and H1 is accepted. Thus, technical innovation has positive effect on innovation capacity.
4. H4: Administrative Innovation has positive effect on Innovation Capacity.
The results of data processing showed that p = 0.005. This indicates that the probability is in the rejection region. Therefore, it can be stated that H0 is rejected and H1 is accepted. Thus, administrative innovation has positive effect on innovation capacity.
5. H5: Innovation has positive effect on Competitiveness.
The results of data processing showed that p = 0.035. This indicates that the probability is in the rejection region. Therefore, it can be stated that H0 is rejected and H1 is accepted. Thus, innovation has positive effect on competitiveness.
5. Conclusion
Based on the research of the pottery craft SMEs in Banyumulek village, Kediri sub-district, West Lombok regency, West Nusa Tenggara province, Indonesia, it could be concluded as follows:
Innovation culture has positive effect on innovation. From the data processing is known that the first hypothesis in this study is acceptable, or in other words, there is a significant positive effect between innovation cultures towards innovation. This shows that the willingness of the pottery craft companies to implement innovation cultures will impact on the ability of the companies’ innovations.
Innovation capacity has not positive effect on innovation. From the data processing is known that the second hypothesis proposed is not acceptable. In other words, there is no positive and significant effect between innovation capacities towards innovation. This shows that the willingness of the companies to develop innovation capacities do not have effect on improving the companies’ ability to compete.
Technical innovation has positive effect on innovation capacity. From the data processing is known that the third hypothesis is acceptable. In other words, there is a positive and significant effect of technical innovation towards innovation capacity. This suggests that the ability of the companies to technical innovation has increased the companies’ innovation capacity.
Administrative innovation has positive effect on innovation capacity. From the data processing is known that fourth hypothesis proposed in this study is acceptable. In other words, there is a positive and significant effect between administrative innovations on innovation capacity. This shows that the willingness of companies to perform administrative innovation have impact on improving the innovation capacity of the companies.
Innovation has positive effect on competitiveness. From the data processing is known that the fifth hypothesis in this study received or in other words there is a significant positive effect of innovation on competitiveness. This shows that the willingness of companies to implement innovation strategies will impact the company's ability to compete with other companies.
Strategy of innovation has positive effect on the level of product competitiveness. The decisions taken by the owner or manager of the pottery craft SMEs to undertake innovation strategy and improve the quality of both product, process and use sources of innovation that is certainly going to make expenditures greater costs to support the above. Because in this case there would be a cost of investment in the use of more advanced technology and increased employees’ better knowledge will sue the company issued another investment costs and the impact will be increase the level of companie’s investment.
Acknowledgements
I would like to express my thanks and appreciation to the Dean and all staffs of Economic Faculty of Mahasaraswati University of Mataram which have supported me preparing this paper. Without their cooperation, this paper would not possibly have been written.
References
- Beritasore.com. (2010).IndustriKerajinan Indonesia Salah Satu Terbaik Dunia. Retrieved from http://beritasore.com /2010/11/24/industri-kerajinanindonesia-salah-satu-terbaik-dunia/
- Antaramataram.com. (2012). Ekspor Gerabah Ke Tujuh Negara. Retrieved from: http://www.antaramataram.com/berita/?rubrik=3&id=22788
- Makassarpreneur.com. (2011).Peran Penting Wirausaha. January 3). Retrieved from: http://www.makassarpreneur.com/index.php?option=com_content&view=article&id=125:peran-pentingwirausaha&catid=30:entrepreneurship&Itemid=66
- Daliman, A. (2000). Peranan Industri Kerajinan Perak di Daerah Istimewa Yogyakarta Sebagai Pendukung Pariwisata Budaya (Humaniovora Volume XII No 2/2000). Yogyakarta.
- Harinta, Y. (2010). Faktor-Faktor yang Mempengaruhi Kecepatan Adopsi Inovasi Pertanian di Kalangan Petani di Kecamatan Gatak Kabupaten Sukoharjo. Surakarta.
- Nazir, M. (1998). Metode Penelitian. Jakarta: Ghalia Indonesia.
- Sarwono, J.(2006).Metode Penelitian Kuantitatif dan Kualitatif. Yogyakarta: Graha Ilmu.
- Setyari, N.(2008). Dinamika Pengembangan UMKM di Indonesia. Bali.
- Simamora, M.(2006). Sistem Inovasi dan Daya Saing Industri: Tinjauan Konseptual dan Studi Kasus pada Industri Makanan. Jakarta: LIPI Press.
- Sugiyono.(2012). Quantitative, Qualitative,andR&DResearch Methods.Bandung: Alfabeta.
- Tambunan, T.(2008). Ukuran Daya Saing Koperasi dan UKM. Bogor.
- Tambunan, T.(2009).SMEs diIndonesia.Ghalia Publisher: Bogor.
- Wahyono.(2002).MarketOrientation and Innovation:The Impact on Marketing Performance.Indonesia Marketing Scientific Journal, 1(1).


