
American Journal of Renewable and Sustainable Energy, Vol. 1, No. 3, September 2015 Publish Date: Aug. 17, 2015 Pages: 140-155
Moisture Sorption Isotherms and Isosteric Heats of Sorption of Tomato Slices
Sana Ben Mariem1, 2, *, Salah Ben Mabrouk2
1Higher Institute of Agronomic Sciences of Chott-Mariem, University of Sousse, Sousse, Tunisia
2Labratory of Thermal Process, Research and Technology Centre of Energy, Borj Cédria, Tunisia
Abstract
The adsorption and desorption isotherms of tomato were determined by static gravimetric method at different temperatures, in the range from 30°C to 60°C and relative humidities of 5%–85%. The curves obtained can be considered as type II according to the Brunauer–Emmett–Teller classification. Equilibrium moisture content data were correlated by different mathematical models usually applied to foodstuffs (GAB, Peleg, Smith, Caurie, Oswin…). A non-linear least square regression analysis was used to evaluate the models constants. The best fit of the experimental data was obtained with GAB and Peleg models. The Chung-Pfost model was the least adequate. Hysteresis was also observed at all temperatures investigated. The isosteric heat of sorption was determined using the Claussius–Clapeyron equation, and it decreases with increasing moisture content at the average temperatures investigated.
Keywords
Equilibrium Moisture Content, Isosteric Heat, Sorption Isotherm, Tomato, Water Activity
Received: July 10, 2015
Accepted: July 29, 2015
Published online: August 17, 2015
@ 2015 The Authors. Published by American Institute of Science. This Open Access article is under the CC BY-NC license. http://creativecommons.org/licenses/by-nc/4.0/
1. Introduction
The sorption isotherms reflect the macroscopic equilibrium between a product and its atmosphere. They provide information about the distribution and forms of water present in the product, and intensity of water connections and their functional availability into a material.
On the other hand, sorption isotherm is necessary to evaluate the stability area of a product after drying. (Kouhila 2001).
Knowledge of moisture sorption isotherm is highly important in the food industry. They are used for predicting the behavior of a product in a technological treatment mainly in drying processing, storage, and food preservation.
Indeed isotherms permit to know the equilibrium moisture content of the product, making the limit to which is going to give the moisture content. This parameter is essential for the modeling of a drying process.
Graphically the isotherm curve represents for a given temperature, the moisture content of a product according to the water activity aw or relative humidity RH.
This isotherm curve can be obtained in two ways:
• An absorption isotherm is determined experimentally on the basis of a dry material into various atmospheres, it sets the steam to equilibrium with the surrounding air.
• A desorption isotherms is obtained experimentally, starting from a water saturated material, placed into a dry atmosphere, it yields vapor to equilibrium.
The adsorption and desorption processes are not completely reversible, A distinction can be observed between the adsorption and desorption isotherms. Some attribute the phenomenon "hysteresis" due to structural changes and irreversible porosity during drying of the product.
2. Materials and Methods
2.1. Determination of Sorption Isotherms
2.1.1. Principe
Several methods are available to determine experimentally the sorption isotherm. Among these methods the static gravimetric method with saline solutions or sulfuric acid solutions, based on the measurement of the weight of the sample over time under fixed environmental conditions.
This method give the exact weigh of the sample, minimize the temperature fluctuations between the sample and water vapor, record the sample weight change in equilibrium with the water vapor pressure and perform a hygroscopic and thermal equilibrium between the sample and the source of water vapor (Al-Muhtaseb and al., 2002). However, the problem of the measurements is that the time required to reach equilibrium is very long; the diffusion rate of the water vapor is a limiting factor.
The principle of obtaining an isotherm point is based on the measurement of the weight of the sample over time under fixed environmental conditions. Thus, the sample is placed in fixed relative pressure conditions and measured weight over time until it reaches a level which changes in weight between two successive measurements is negligible.
The sample is then in equilibrium with air at (T, HR). Knowing his humid weight, it should simply determine the dry weight to deduce its moisture content Xeq, the couple (RH, Xeq) provided a point of the sorption isotherm. Generally 6 to 10 experimental points are sufficient to plot properly sorption isotherm curve.
In this study, desorption isotherm focused on fresh tomatoes, to commercial maturity (red color and firm) and collected from the local producer. Tomato samples were washed with distilled water and cut into pieces of uniform size.
However, to obtain the adsorption isotherm, the procedure is in the reverse desorption, samples previously dried will absorb moisture from the air.
2.1.2. Sample Preparation and Sorption Conditions
The experimental system consists of a series of seven jars with a tight opening filled with 300 ml of sulfuric acid solution to obtain inside a relative humidity between 5% and 85% at four temperatures between 30°C and 60°C.
These jars have a sample holder which is placed on two samples of fresh tomato about 1g to 1.5 g subsequently placed in an oven adjusted to a selected temperature (figure 1).
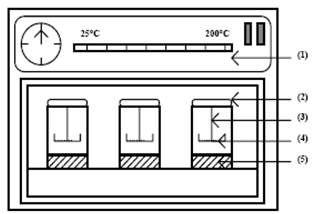
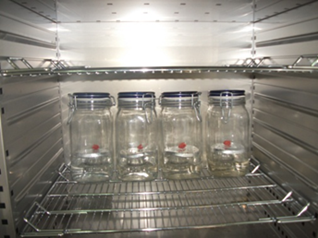
Fig. 1. Experimental set for determining the sorption isotherms.
1 - Thermostatic basin, 2 - Jar, 3 - sample holder, 4 - Product, 5 - Sulfuric acid solution
The mass fraction of sulfuric acid XH2SO4 fixed the specified relative humidity inside the jar that also depends on the temperature.
The correspondence between the relative humidity RH in equilibrium with aqueous solutions of H2SO4 function of temperature provided by the literature is shown in table 1.
Table 1. Relative humidity of the air in the bottles according to the concentration of the sulfuric acid solution.
| XH2SO4 | HR (%) | ||||
| 30°C | 40°C | 50°C | 60°C | ||
| 0.7054 | 5 | 6 | 6 | 7 | |
| 0.5803 | 21 | 21 | 22 | 24 | |
| 0.4812 | 41 | 41 | 42 | 43 | |
| 0.3823 | 49 | 51 | 51 | 53 | |
| 0.299 | 61 | 61 | 64 | 63 | |
| 0.229 | 76 | 76 | 75 | 76 | |
| 0.116 | 85 | 85 | 84 | 85 | |
The weighing of samples is carried every two days with a balance "Kern 770" to a precision of 10-3 g until weight stabilization. When the equilibrium is reached, samples are introduced in an oven at 105°C to determine their dry weight (Ms).
The equilibrium moisture content is calculated using the following equation:
![]() (1)
(1)
2.2. Data Analysis
2.2.1. Sorption Isotherm Equations and Modeling
Sorption curves depend on the nature and the state of hygroscopic product, the type of the water molecules links and the solid matrix product and how the equilibrium is attained. For these reasons, the modeling of sorption isotherms is a work that is not always easy to address. (Kouhila 2001)
In the literature, several equations have been proposed for the modeling of isotherms. Some are based on a theoretical model of sorption mechanisms and others are empirical or semi-empirical. A disadvantage of all these equations is that they are not applicable to the whole range of relative humidity.
A summary of the most commonly used models are presented in table 2.
Table 2. Sorption isotherm models used for tomato.
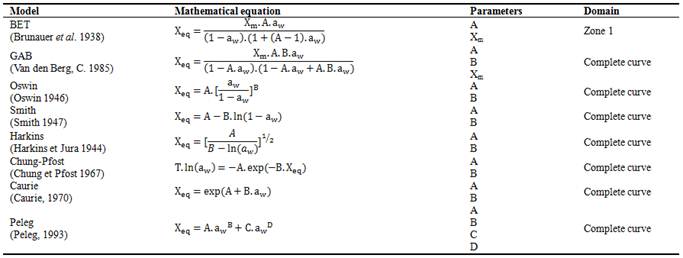
* Xm : moisture content adsorbed on the monolayer (kg water/(kg solids dry).
2.2.2. Isosteric Heat of Sorption
The principle of Vant Hoff Le Chatelier predicted that at constant moisture content, the saturation vapor pressure decreases with increasing temperature. It is therefore possible to calculate the isosteric heat Qst representing water binding energy to the substrate and thus the additional heat to the heat of vaporization of pure water necessary to dehydrate the product.
The calculation of Q may be carried from a relationship derived from the Clausius-Clapeyron equation (Iglesias and Chirife 1976, 1982). This relation is necessary to determine the isotherms at different temperatures in order to calculate the logarithmic variation of the relative humidity according to the inverse temperature for fixed equilibrium moisture content.
However, from modified equations, it is possible to obtain the analytical expression of sorption heat Qst. This approach assumes that the isosteric heat does not change with temperature.
![]() (2)
(2)
Integrating the equation (2) we obtain
![]() (3)
(3)
With: Qst = desorption isosteric heat [kJ / mol]
R = perfect gas constant [kJ / mol.K]
aw = water activity
T = air temperature [K]
Generally, Q is a positive quantity when heat is released during adsorption, and negative when heat is absorbed during desorption. The heat of adsorption is a measure of the energy released to sorption and desorption heat energy needed to break the intermolecular forces between the water vapor molecules and the surface of the adsorbent. Thus, the sorption heat is considered indicative of the intermolecular attraction forces between the sorbent and the water vapor sites.
3. Experimental Results and Modeling
3.1. Sorption Isotherms
The hygroscopic equilibrium of tomatoes need a long time. It is reached after 15 days for desorption and 10 days for adsorption.
The experimental values of equilibrium moisture Xeq of tomato obtained for four values of the temperature (30°C, 40°C, 50°C and 60°C) are shown in table 3 and table 4.
Desorption and adsorption isotherm curves at 30°C, 40°C, 50°C and 60°C are presented in figures 2 and 3 respectively.
According to figures 2 and 3, the sorption isotherms have a sigmoidal form which corresponds to type II, of the classification of Brunauer, Emits, Teller (1940) in his five general types.
Table 3. Equilibrium moisture of tomato for desorption.
| T = 30°C | T = 40°C | T = 50°C | T =60°C | ||||
| aw | Xeq | aw | Xeq | aw | Xeq | aw | Xeq |
| 0.05 | 0.10981 | 0.06 | 0.09 | 0.06 | 0.069 | 0.07 | 0.0536 |
| 0.21 | 0.165 | 0.21 | 0.13 | 0.22 | 0.1046 | 0.24 | 0.064 |
| 0.41 | 0.2194503 | 0.41 | 0.1945 | 0.42 | 0.1485 | 0.43 | 0.1135 |
| 0.49 | 0.2608870 | 0.51 | 0.2361 | 0.51 | 0.2 | 0.53 | 0.14 |
| 0.61 | 0.5137211 | 0.61 | 0.3261 | 0.64 | 0.333 | 0.63 | 0.2106 |
| 0.76 | 0.6955445 | 0.76 | 0.5795 | 0.75 | 0.45 | 0.76 | 0.3 |
| 0.85 | 0.9878 | 0.85 | 0.9780 | 0.84 | 0.75 | 0.85 | 0.65 |
Table 4. Equilibrium moisture of tomato for adsorption.
| T = 30°C | T = 40°C | T = 50°C | T =60°C | ||||
| aw | Xeq | aw | Xeq | aw | Xeq | aw | Xeq |
| 0.05 | 0.0735727 | 0.06 | 0.0783 | 0.06 | 0.0552 | 0.07 | 0.0460424 |
| 0.21 | 0.0924 | 0.21 | 0.104 | 0.22 | 0.0710234 | 0.24 | 0.048576 |
| 0.41 | 0.1316702 | 0.41 | 0.133623819 | 0.42 | 0.13365 | 0.43 | 0.078315 |
| 0.49 | 0.208709677 | 0.51 | 0.162192944 | 0.51 | 0.15358 | 0.53 | 0.11326 |
| 0.61 | 0.385290889 | 0.61 | 0.250135456 | 0.64 | 0.26307 | 0.63 | 0.1556334 |
| 0.76 | 0.521658416 | 0.76 | 0.518123762 | 0.75 | 0.3555 | 0.76 | 0.237 |
| 0.85 | 0.864325 | 0.85 | 0.78996 | 0.84 | 0.675 | 0.85 | 0.570635 |
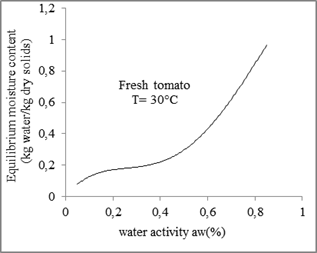
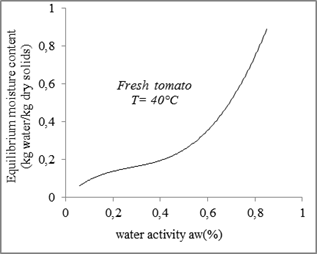
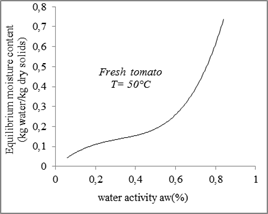
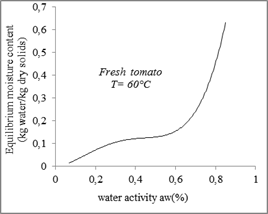
Fig. 2. Desorption isotherms for tomato.
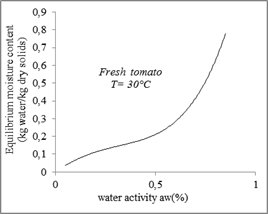
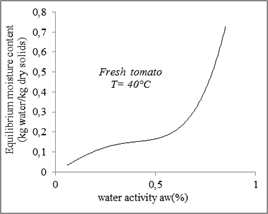
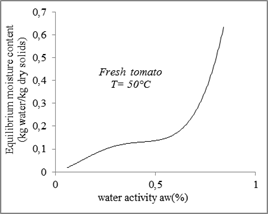
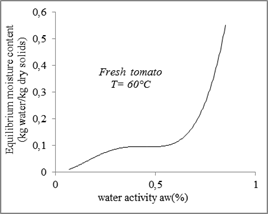
Fig. 3. Adsorption isotherms for tomato.
This result is achieved for most agro-alimentary products (Jdidi, 2007).
The experimental curves obtained show that for the same temperature, the equilibrium moisture content increases with the increase in water activity.
The increase in the moisture content is due to the trend of the food product to reduce the vapor pressure when the relative humidity of the water decreases (Moreira and al., 2008).
Three different parts appear on the sorption isotherm curve corresponding to a particular mode of attachment of water on the product:
• A first region with low water activity values (0 <aw <0.3), which correspond to the low moistures.
It is a monomolecular layer (monolayer) in which water is strongly linked by hydrogen bonds, difficult to remove due to its elevated adsorption energy and it is practically not available as a solvent or reagent, it is the water of "constitution."
• A second intermediate zone in which the quasi-linear characteristic, extends approximately between the water activity values 0.3 and 0.8.
When the all surface is saturated with water, the molecules of water are adsorbed on the monolayer which form layers of limited thickness (multilayer) partially covering the surface of the dry substrate. The water in this area is called loosely linked water.
It is moderately reactive and is available both as a solvent and reagent.
• A third area presents a water activity higher than 0.8.
In this area, the water is in the liquid state and is not held on the surface of the dry substrate by capillary forces: it is the free water fraction. This water is available as well like solvent as reactive. Only in this form, water is usable by the microorganisms and can allow enzymatic reactions, hence its name biological water (Cheftel 1977; Mafart 1991).
3.2. Effect of the Temperature
Figure 4 reports the experimental adsorption and desorption curves respectively for the four temperatures used.
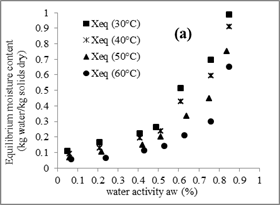
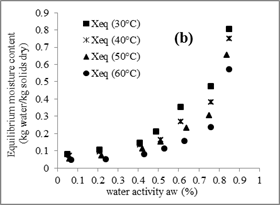
Fig. 4. Effect of the temperature on desorption (a) and adsorption (b) isotherm of tomato.
The curves have a sigmoid shape for the most examined temperatures and show the considerable influence of temperature on the sorption isotherms.
The temperature effect on the sorption isotherm has great importance given that food is exposed to a range of temperature during storage and manufacturing and water activity varies with temperature for the same moisture content.
Temperature affects the mobility of water molecules and the dynamic equilibrium between the vapor and adsorbed phases. (Muhtasab, 2002)
The experimental data indicate that the equilibrium moisture content decreases with the increase of the temperature, in a water activity constant.
Indeed, for the desorption, the increase of temperature of 10°C causes an average decrease of the moisture content at equilibrium of 0.1kg / kg.
These are in agreement with the results of Kiranoudis and al. (1993) Lewicki (1998) and Viswanathan and al (2003) for the tomato and the onion. Similar results were reported for the tapioca (Sanni and al., 1997) and potatoes (McLaughlin and Magee, 1998).
This trend can be attributed to a reduction in total number of active sites for linking water following physical and / or chemical changes caused by temperature (Goula and al., 2008).
According Al-Muhtaseb, at higher temperatures, the molecules of water are activated at energy levels that allow them to be detached from their sorption sites, thus reducing the equilibrium moisture content.
Several investigators have reported that the presence of a large quantity of crystalline sugars such as glucose in dried foods can cause an effect of temperature at high values of aw.
Indeed Myhara and Sablani (2001) reported that the equilibrium moisture content of the raisins or dates rich in glucose decreases until a water activity aw of 0.55 when the temperature increases, while at higher levels of water activity, it increases sharply with increasing in the temperature.
However, in the sorption isotherms shown in figure 4, it is found that the effect of the temperature is independent of the value of the water activity. This can be explained by the poor of tomato in crystalline sugars (2.8 g of carbohydrates / 100 g fresh tomatoes).
For adsorption isotherms, the effect of temperature is less significant. This could be attributed to the pre-drying in which the tomatoes samples have been submitted. These differences in the effect of the temperature between desorption and adsorption isotherms are also raised by other authors (Moreira and al., 2008).
The absorption curve is not superposed with the desorption curve, demonstrating a hysteresis phenomenon. The isotherm of humidification (adsorption) is less than that of the dehydration (desorption). For a constant relative moisture, the moisture content of desorption is higher than that of the adsorption.
The hysteresis phenomenon is observed for the four temperatures and it is more and more remarkable that the temperature decreases. This is illustrated in figure 5.
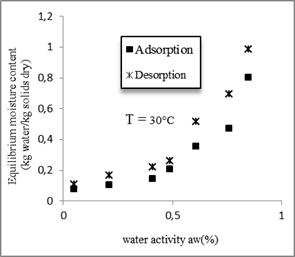
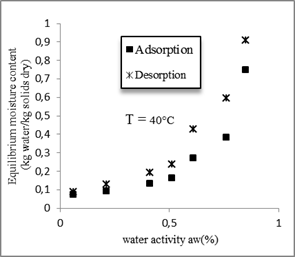
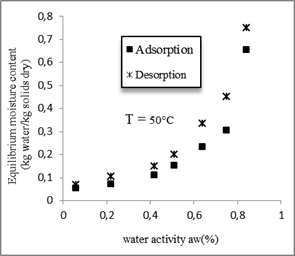
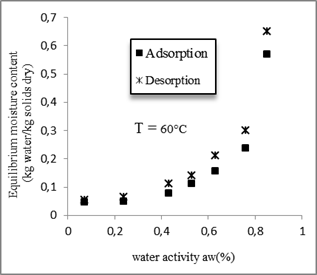
Fig. 5. Hysteresis phenomenon for the four temperatures.
3.3. Isosteric Heats of Sorption
The total desorption heat is the heat which it is necessary to evaporate dependent water
Generally, the vaporization of a water molecule requires a heat equal to the sum of the latent heat (Lvap) and the isosteric heat of sorption (Qst). This quantity is important in designing of equipment for dehydration processes (dimensioning of a dryer).
It was graphically determined from the sorption isosteres, i.e. the curves representing the relationship between the temperature and water activity for constant moisture content according to the equation (3).
In a logarithmic diagram the lines are obtained by carrying -ln (aw) in ordinates and 1 / T on the abscissa.
The slope isosteres (Qst / R) for each moisture content X, gives the corresponding isosteric heat. This presentation is repeated for different values of the moisture content to determine the Qst dependence on the water content.
Isosteric heats of the tomato is calculated from desorption and adsorption isosteres, presented in figure 6 and figure 7.
The slope of isosteres is more important for low equilibrium moisture content and it decreases progressively until stabilize at high equilibrium moisture content.
Compared with desorption isosteres, the slopes of tomatoes adsorption isosteres are more low.
The net isosteric heat of adsorption and desorption for different moisture contents is represented on the same graph (figure 8).
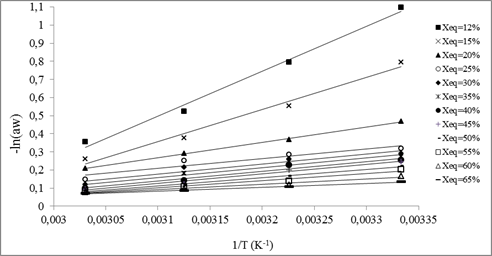
Fig. 6. Desorption isostere of tomatoes.
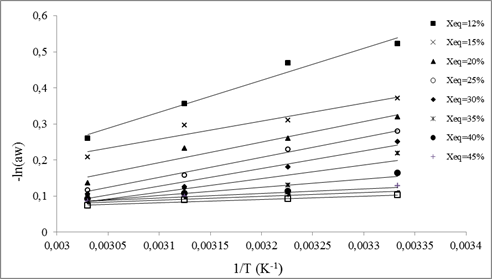
Fig. 7. Adsorption isostere of tomatoes.
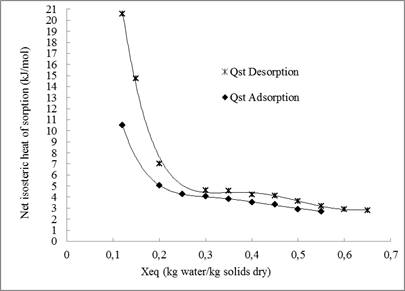
Fig. 8. The net isosteric heat of sorption for tomatoes at various moisture contents.
The obtained curves show that the sorption heat increases when the water content decreases. In effect when the moisture content increases, the sorption sites available decrease thus resulting a reduction in the sorption heat (Pezzuti and Crapiste, 1997).
Tsami (1991) explained that the high value of the sorption heat, in low moisture content, is due to the existence of the highly active polar sites on the surface of the product that are covered with water molecules forming a monolayer.
Chirife and Iglesias (1995) showed that sorption occurs firstly on available sites which are most active causing high interaction energy. Then it occurs on less actives sites provoking a reduction in the isosteric heat saw that the active sites become busy with the increase of the equilibrium moisture content.
Other authors (Boki K. and al. 1990, Salgado MC and al., 1994) explained this phenomenon by the fact that in a very restricted field of moisture, when the moisture content increases, some products swell and favor the opening of new adsorption sites of strong connections, which increases the isosteric heat.
In comparison with the numerical values of the net heat of desorption isosteric, the adsorption heat of the tomatoes are lower. Indeed, for an equilibrium water content of 12% the desorption heat is 20.5 KJ / mol against 10.5 KJ / mol for the adsorption heat. This could be attributed to the requisition of energy in the desorption process higher than that needed in the adsorption process.
The experimental values of the net isosteric heat of adsorption and desorption of the tomatoes were adjusted with the equilibrium moisture content by the following equations:
![]()
![]()
![]()
![]()
3.4. Modelling of Desorption Isotherms
During the study of the tomatoes drying mechanisms, we are interested at desorption equilibrium.
For modeling sorption isotherms, many empirical or semi-empirical correlations describing the relation between moisture equilibrium, water activity (aw) and temperature exists in the literature (Boquet and al., 1978).
According to Van den Berg (1985) five considerations are necessary to assure modeling:
• The experimental curve should be described mathematically;
• The equation must have a simple form and must have a parameters number of description information, the most reduced;
• The parameters must have a physical meaning;
• Temperatures which depend parameters must be included in their analysis;
• The hysteresis effect must be considered.
In general these relations do not allow describing all the zones of the isotherm.
Indeed, the choice of the models depends on the good description of all sorption isotherms for a large range of the temperature and relative humidity of the environment surrounding the product.
Thus the models listed in table 1 were applied in this study to experimental isotherms at the temperature 30°C, 40°C, 50°C and 60°C in order to determine the most appropriate model to predict the sorption isotherm of tomatoes.
The desorption isotherms of tomatoes measured and calculated for different models and for different temperatures are presented in figures 9, 10, 11 and 12.
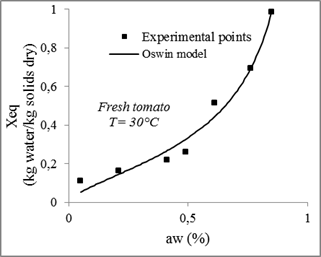
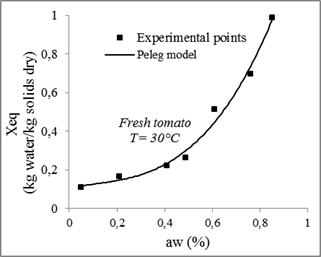
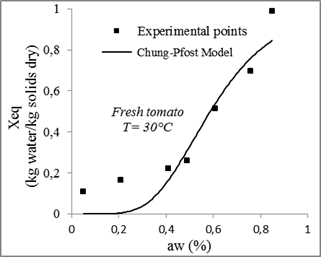
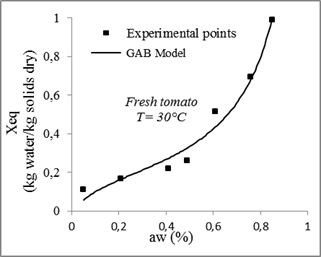
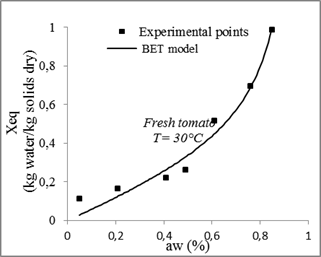
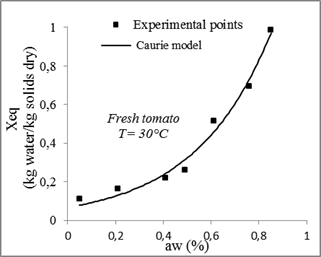
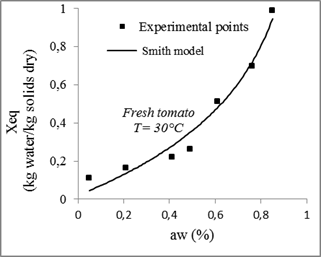
Fig. 9. Sorption isotherms of tomato with the fitted models at 30 °C.
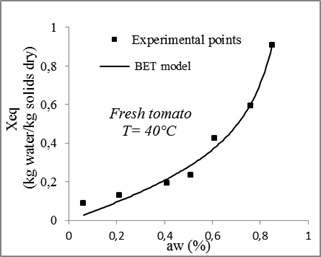
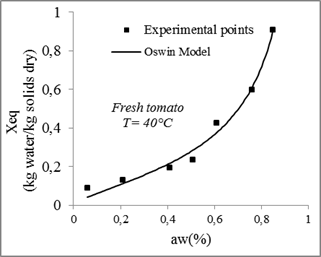
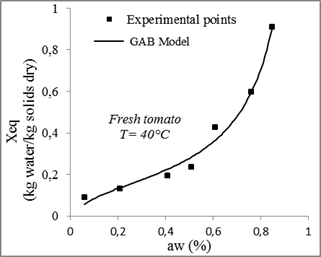
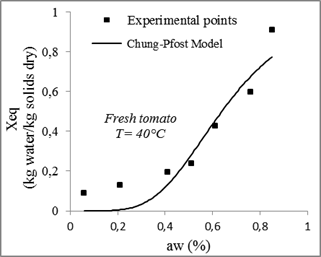
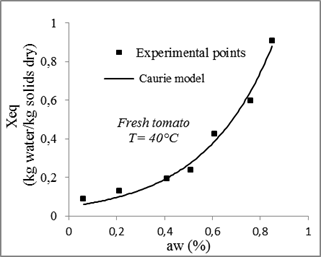
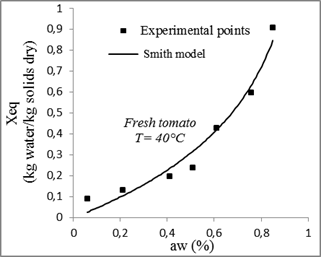
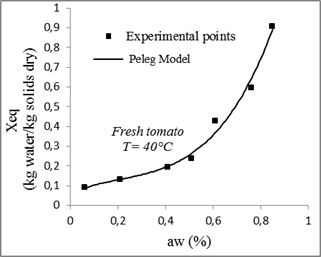
Fig. 10. Sorption isotherms of tomato with the fitted models at 40 °C.
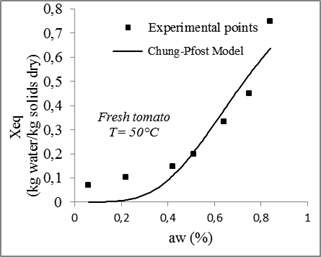
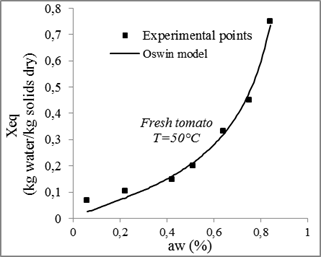
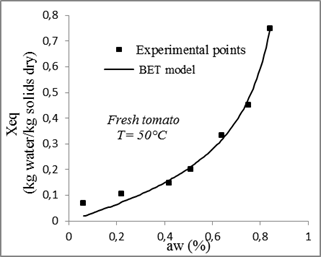
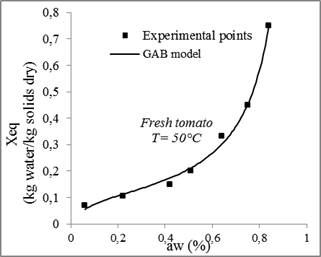
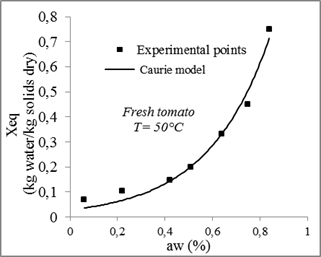
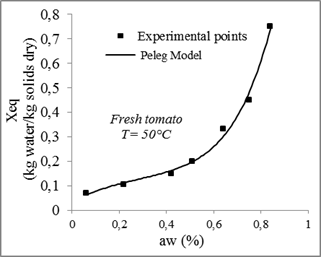
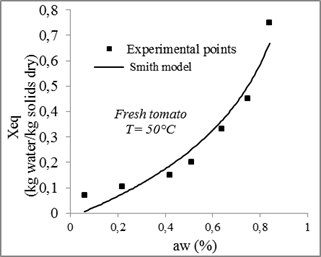
Fig. 11. Sorption isotherms of tomato with the fitted models at 50°C.
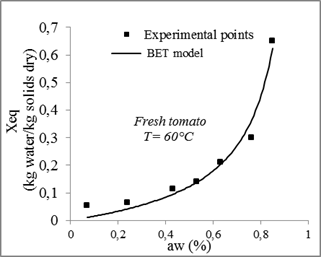
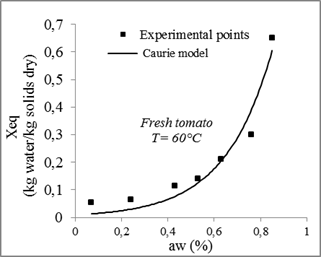
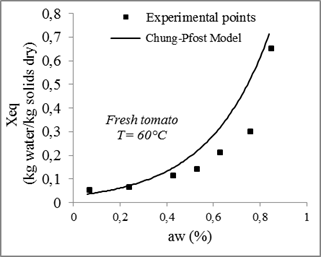
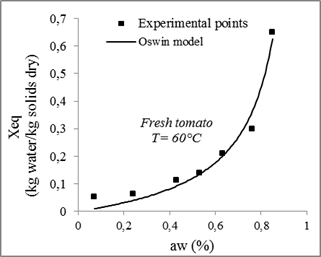
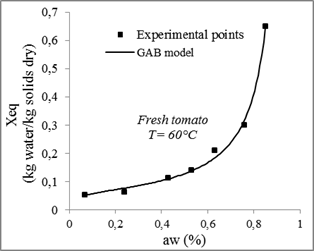
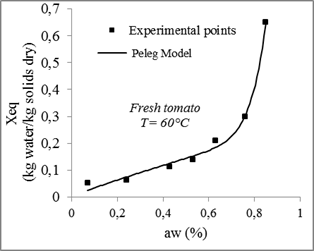
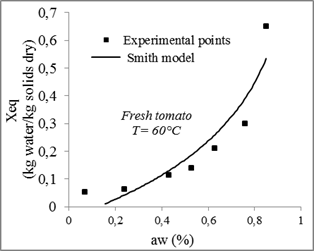
Fig. 12. Sorption isotherms of tomato with the fitted models at 60°C.
Fitting results of experimental data of tomato desorption isotherms for the various models are shown in table 5.
The models used for the adjustment of desorption isotherms were compared according to Chi-square (χ2) and the coefficient of determination R2for all studied temperatures. The values of these parameters are determined using the "OriginPro8" software.
As shown in table 5, the values of R2 and χ2 extend respectively from 0.77782 to 0.997 and from 0.00032 to 0.01711 for desorption isotherms.
Compared to other models, the GAB model with three parameters gives the highest coefficient of determination R2and the lowest χ2. Therefore, it is considered the best for the adjustment of experimental data of tomatoes desorption isotherms at 30°C, 40°C, 50°C and 60°C with a minimum relative error between the theoretical and experimental values of from 0.0003 and 0.002 and a determination coefficient ranges between 0.99 and 0.96.
This observation is similar to that obtained by other researchers, who have studied the sorption isotherms of various fruits and vegetables.
Kiranoudis and al. (1993) determined the equilibrium moisture content of the potato, carrot, tomato, green pepper and onion in the range of 10% to 90% relative humidity and at three different temperatures (30°C, 45°C and 60°C) and found that the GAB is the best model for predicting the obtained experimental data.
Mc Laughlin and Magee (1998) determined the sorption isotherms of potatoes at temperatures from 30°C, 45°C and 60°C, and among the models tested, the GAB model gave the best adjustment with the experimental data. According to Noumi and al. (2004), the GAB model adequately represents the sorption isotherms of Canarium schweinfurthii fruits, while Akanbi and al. (2006) concluded that the equilibrium moisture content of tomato slices follows closely of GAB the equation.
According Mbarek (2008), the GAB model adequately represents the desorption isotherms of tomato pulp and the adsorption isotherms of tomato powders. Goula and al. (2008) studied the adsorption isotherms of tomato powder for a temperature range of 20°C to 70°C, the GAB model describes well the sorption of water according to the water activity.
The model of Peleg also adjusts appropriately the experimental results. Muhtaseb and al. (2004) also noted that the Peleg model provides a good description of potato starch isotherms, the peas and the dried beef. Lewicki (1998) determined the sorption isotherms of 31 food products and found that the model of Peleg shows the best adjustment.
Concerning the least adequate model, Chung-Pfost model gave less precise prediction for tomatoes sorption isotherms.
Table 5. Parameters of the isotherm models for tomato under different temperatures.
| Models | Temperature (°C) | model Coefficients | Statistic parameters | ||||||
| A | B | C | D | T | X_m | Adj. R-Square | Reduced Chi-Sqr | ||
| BET | 30 | 0.18724 | - | 0.96389 | 0.00381 | ||||
| 40 | 0.24368 | - | 0.97683 | 0.00204 | |||||
| 50 | 0.37094 | 0.80602 | 0.9838 | 0.0009459 | |||||
| 60 | 0.73785 | 0.19211 | 0.96794 | 0.0014 | |||||
| GAB | 30 | 0.24 | 0.064 | 0.20159 | 0.96147 | 0.00407 | |||
| 40 | 0.43 | 0.1135 | 0.16036 | 0.977 | 0.00202 | ||||
| 50 | 0.53 | 0.14 | 0.1085 | 0.99132 | 0.000506886 | ||||
| 60 | 0.63 | 0.2106 | 0.06115 | 0.99252 | 0.000325383 | ||||
| Smith | 30 | 0.02086 | 0.48771 | 0.96304 | 0.0039 | ||||
| 40 | -0.00169 | 0.44658 | 0.95809 | 0.00369 | |||||
| 50 | -0.01636 | 0.37349 | 0.93473 | 0.00381 | |||||
| 60 | -0.04076 | 0.30371 | 0.85022 | 0.00652 | |||||
| Oswin | 30 | 0.33511 | 0.62693 | 0.97129 | 0.00303 | ||||
| 40 | 0.27804 | 0.67925 | 0.98159 | 0.00162 | |||||
| 50 | 0.20552 | 0.76898 | 0.98579 | 0.0008296 | |||||
| 60 | 0.12019 | 0.95116 | 0.9668 | 0.00145 | |||||
| Chung-Pfost | 30 | 439.67462 | 5.39241 | 26.72958 | 0.83805 | 0.01711 | |||
| 40 | 487.88034 | 4.69734 | 35.07344 | 0.84435 | 0.0137 | ||||
| 50 | 478.04932 | 3.78847 | 43.85614 | 0.84105 | 0.00928 | ||||
| 60 | 839.82033 | 3.81586 | 52.86815 | 0.77782 | 0.00967 | ||||
| Caurie | 30 | -2.69622 | 3.13714 | 0.98037 | 0.00207 | ||||
| 40 | -3.0253 | 3.40799 | 0.98094 | 0.00168 | |||||
| 50 | -3.54518 | 3.82115 | 0.97606 | 0.0014 | |||||
| 60 | -4.6951 | 4.93368 | 0.93443 | 0.00285 | |||||
| Peleg | 30 | 0.16219 | 0.11706 | 1.34212 | 3.06557 | 0.97416 | 0.00273 | ||
| 40 | 0.15572 | 0.40125 | 0.17555 | 1.30883 | 0.97626 | 0.00209 | |||
| 50 | 0.08187 | 0.25485 | 0.23589 | 1.29693 | 0.98636 | 0.000796568 | |||
| 60 | 0.07015 | 0.32221 | 1.914 | 3.8009 | 0.98524 | 0.000642429 | |||
4. Conclusion
Sorption isotherms of tomato were experimentally performed at 30°C, 40°C, 50°C and 60°C, in a wide range of water activity and moisture contents.
Temperature has an effect on the sorption behaviour, the equilibrium moisture content values decreased with increase in temperature at constant relative humidity, whereas it followed reverse trend with relative humidity. Hysteresis is evident as the equilibrium moisture content is higher for desorption than adsorption across the aw range investigated.
Several equations were used for describing sorption isotherms of tomato
The GAB model was found the best correlations for the experimental sorption data for tomato throughout the range of water activity studied (0.5–0.85).
References
- Akanbi C.T., Adeyemi R.S., Ojo A., 2006. Drying characteristics and sorption isotherms of tomato slices. Journal of Food Engineering, 73, 157-163.
- Al-muhtasab, .A.H, McMinn, W.A.M., & Magee.T.R.A. 2002. Moisture sorption isotherm characteristics of food products: a review .Trans IChemE, Vol 80, Part C.
- Al-Muhtaseb, A.H., McMinn, W.A.M., Magee, T.R.A., 2004.Water sorption isotherms of starch powders. Part 2: thermodynamic characteristics. Journal of Food Engineering 62, 135–142.
- Boquet R., Chirifie J. & Iglesias H.A. (1978).Equations for fitting water sorption isotherms of foods. II. Evaluation of various two-parameter models, Journal of Food Engineering, vol. 13, pp. 319-327.
- Brunauer. S., Deming. L.S., Deming, W.E., & Teller.E. 1940.On a theory of the Van der Waals adsorption of gases. Journal of the American Chemical Society, 62, 1723–1732.
- Cheftel J.C., Cheftel H., 1977.Introduction à la biochimie et à la technologie des aliments (volume 1), Techniques et Documentation-Lavoisier, Paris : 371 p.
- Caurie, M., 1970. A new model equation for predicting safe storage moisture levels for optimum stability of dehydrated foods. Journal of Food Technology, 5: 301–307.
- Chung D.H. et Pfost H.B. (1967).Adsorption and desorption of water vapor by cereal grains and their products, Trans. ASAE, vol. 10, pp. 549-550.
- Goula A.M., Karapantsios T.D., Dimitris S.A., Adamopoulos, 2008.Water sorption isotherms and glass transition temperature of spray dried tomato pulp. Journal of Food Engineering, 85: 73-83.
- Harkirns, W.D. and Jura, G.J., The Decrease of Free Surface Energy as a Basis for the Development of Equations for Adsorption Isotherms; and the Existence of Two Condensed Phases in Films on Solids, Journal of Chem. Phys. 12, 112-113, 1944.
- Iglesias H. A., & Chirife J., 1976, Isosteric heats of water vapour sorption on dehydrated foods. Part II: hysteresis and heat of sorption comparison with BET theory, Lebensmittel-Wissenchaft und Technologie, vol. 9, pp. 123-127.
- Iglesias H. A., & Chirife J., 1982, Water sorption parameters for food and food components, Handbook of food isotherms, Academic Press, New York.
- Kiranoudis C. T. & al., 1993, Equilibrium moisture content and heat of desorption of some vegetables, Journal of Food Engineering, vol. 20, pp. 55-74.
- Kouhila M., 2001. Étude expérimentale et théorique des cinétiques de séchage convectif partiellement solaire des plantes médicinales et aromatiques (menthe, verveine, sauge et eucalyptus) de la région de Marrakech.Thèse de Doctorat Univesité Cadi Ayyad, Marrakech, pp 284.
- Lewicki P P (1998). A three parameter equation for food moisture isotherms. Journal of Food Process Engineering, 21(2), 127–144
- Mafart P., 1991. Les procédés physiques de conservation.In : Génie industriel alimentaire (Tome 1).Technique et Documentation Lavoisier, Paris. pp. 246-251.
- McLaughlin C P; Magee T R A (1998). The determination of sorption isotherms and the isosteric heats of sorption for potatoes. Journal of Food Engineering, 35(3), 267–280 (Moreira et al., 2008).
- Myhara R.M., Sablani S., 2001.Unification of fruit water sorption isotherms using artifiial neural networks. Drying Technology, 19(8): 1543-1554.
- Noumi G.B., S. Laurent, E. Ngameni, C. Kapseu, Y. Jannot et M. Parmentier, 2004. Modélisation de la déshydratation de la pulpe des fruits du Canarium schweinfurthii Engl.Tropicultura, 22, 2, 70-76
- Oswin G.R. (1946). The kinetics of package life, Indian Chemical Industry, vol. 65, pp. 419-442.
- Peleg M., 1993. Assessment of a semi-empirical four parameter general model for sigmoid moisture sorption isotherms. Journal of Food Process Engineering, 16: 21–37.
- Pezzutti A; Crapiste G H (1997).Sorption equilibrium and drying characteristics of garlic. Journal of Food Engineering, 31(1), 113–125
- Salgado M.A., Lebert A., Garcia H.S., Muchnik J. & Bimbenet J.J. (1994).Development of the characteristic drying curve for casava chips in monolayer, Drying Technology, vol. 12, n° 3, pp. 685-696.
- Smith S.E. (1947). The sorption of water vapor by high polymers, Journal of American Chemical Society, vol. 69, pp. 646.
- Sanni L O; Atere C; Kuye A (1997).Moisture sorption isotherms of Fufu and tapioca at different temperatures. Journal of Food Engineering, 34(2), 203–212
- Tsami E., 1991, Net isosteric heat of sorption in dried fruits, Journal of Food Engineering, vol. 14, pp. 327-335.
- Van den Berg, C. (1985). Development of B.E.T. like models for sorption of water of foods; theory and relevance. In D. Simatos & J. L. Multon (Eds.), Properties of water in foods (pp. 119–135). Dordrecht: Martinus Nijhoft Publishers.
- Viswanathan R., D.S. Jayas, R.B. Hulasare (2003). Sorption Isotherms of Tomato Slices and Onion Shreds. Biosystems Engineering 86 (4), 465–472.


