American Journal of Renewable and Sustainable Energy, Vol. 1, No. 3, September 2015 Publish Date: Aug. 5, 2015 Pages: 133-139
Simulation and Optimization of a Wind/PV/Battery Hybrid Power System for a Commercial Building
Abtin Ataei1, 2, *, Jun-Ki Choi2, Reza Rashidi1, Mojtaba Nedaei1, Elnaz Kurdestani1
1Department of Energy Engineering, Graduate School of the Environment and Energy, Science and Research Branch, Islamic Azad University, Tehran, Iran
2Department of Mechanical and Aerospace Engineering, Renewable and Clean Energy, University of Dayton, Dayton OH, USA
Abstract
This study dealt with a time domain performance analysis for a standalone wind and solar hybrid system in a commercial building. Wind and solar sources combined with an energy storage would provide a better system reliability and make it suitable for stand-alone applications. In this study, the National Renewable Energy Laboratory’s (NREL) Hybrid Optimization Model for Electric Renewable (HOMER), was used to carry out the optimal design and techno-economic viability of the energy system. The simulation results demonstrated that the optimum structure for the hybrid energy system consists of 1.8 kW PV modules, a 1kW wind turbine, 2.5 kW inverter, and twelve 200 Ah batteries. The cost of energy (COE) is calculated to be 2.693 $/kWh, whereas the initial capital required, and net present cost (NPC) are, $31400 and $70358, respectively.
Keywords
Renewable Energy, Hybrid System, PV Array, Wind Turbine, HOMER
Received: July 9, 2015
Accepted: July 27, 2015
Published online: August 5, 2015
@ 2015 The Authors. Published by American Institute of Science. This Open Access article is under the CC BY-NC license. http://creativecommons.org/licenses/by-nc/4.0/
Contents
1. Introduction 2. Data Collection 2.1. The Studied Commercial Building 2.2. Solar Radiation 2.3. Wind Speed 2.4. Electrical Load Demand 2.5. PV Array 2.6. Wind Turbine 2.7. Batteries 2.8. Inverter 3. Results and Discussions 3.1. Simulation of the Energy System with HOMER Tool 3.2. PV-Wind Hybrid System Optimization Results 4. Conclusions
1. Introduction
Residential and commercial buildings are responsible for 40% of the energy consumption in the world. In addition, 33% of the total worldwide greenhouse-gas emission is generated from buildings (US Department of Energy, 2011). Many studies have been conducted to address energy consumption measurement and management in buildings.
Ke et. al. (2013) examined the impact of energy consumption parameter changes on the total energy consumption of an office building by applying International Performance Measurement and Verification Protocol (IPMVP) and eQuest model. Zhu (2006) examined different methods of energy savings on a commercial building and evaluate the building energy consumption. A commercial building in Tianjin, China, was investigated by Xing et al. (2015). Martinez et al. (2012) modeled the energy consumption performance of a 1970s office building by applying two energy simulation software tools and calibrating data using original utility, electricity, and gas bills, and the regional weather data, Using passive strategies to the building façade, a few options were recommended after the calibration of the models. Yu et al. (2008) studied the effect of numerous parameters for improving the building energy efficiency. Xing et al. (2015) simulated a hotel building to investigate the predictive accuracy for the major factors in energy consumption. Neto and Fiorelli (2008) applied an artificial neural network for the prediction of energy usage in an office building. Irshad et al. (2014) applied TRNSYS software to integrate the combined impacts of climate conditions, building construction details, material thermal properties, photovoltaic and Trombe wall details, and building orientation.
Renewable energy resources, such as wind and solar, are considered highly promising in the face of growing concerns for the environment, energy conservation, and sustainable development. Daily as well as seasonal variability are inherent to both wind and solar resources. Traditionally, the uncertainty of a standalone solar panel or wind turbine installation is managed using a storage system. However, this results in an increased overall cost of the output energy, and therefore limits the benefits of using renewable energy.
Researches for renewable energies have been initiated first for wind power and then for solar power. Efficiency of solar power conversion systems is 18%, whilst for wind power is 55%. These efficiencies could be increased to 50% by beam tracking, beam focusing and wind direction adaptive motion methods (Tina et al. 2006).
Since the oil crisis in the early 1970s, utilization of the solar and wind power has increased significantly. In recent years, hybrid PV/wind systems have become viable alternatives to meet environmental protection requirement and electricity demands.
A hybrid solar-wind energy system uses two renewable energy sources. Hence efficiency and power reliability of the system increases. However, aggregating inherently stochastic power sources such as wind and solar to achieve reliable electricity supply is a non-trivial problem.
To use solar and wind energy resources more efficiently and economically, the optimal sizing of hybrid PV/wind system with batteries is important in this respect (Fesli et al. 2006).
One of the efforts done in application of PV array and wind turbine is constructing hybrid energy system PV/wind/Battery in commercial buildings.
In this study, The National Renewable Energy Laboratory’s (NREL) Hybrid Optimization Model for Electric Renewables (HOMER) software was used to carry out the optimal design and techno-economic viability of hybrid energy system in a sample office building. HOMER is software that facilitates design of hybrid power systems. Analysis with HOMER requires information on resources, economic constraints, and control methods. It also requires inputs on component types, their costs, efficiency etc. Sensitivity analysis could be done with variables having a range of values instead of a specific number. HOMER estimates a system’s technical feasibility and then performs the economic analysis and ranks the systems according to total net present cost (Ngan and Tan 2012).
2. Data Collection
2.1. The Studied Commercial Building
The commercial building which is considered in this study has four floors with 100 employees and in this study, we install all equipment in the roof of this building. The hybrid system is assumed to work for 7 days a week. The general schematic of hybrid energy system at the roof of this building is shown in Fig. 1.

Fig. 1. Schematic of the HOMER model for a hybrid PV-Wind energy. system.
2.2. Solar Radiation
Fig. 2. The annual solar radiation and the clearness index for the under investigated area.
Solar power is the energy from the Sun. It is renewable, inexhaustible and it doesn’t pollute the environment. Solar radiation is a reliable source of energy that is received in the form of relatively diffuse energy. Its daily cycle varies and may be influenced greatly by meteorological conditions such as cloud, haze and fog. Being radiant energy, solar energy cannot be stored directly. Global solar radiation data are readily available and reliable for all locations (Khan and Iqbal 2005). The solar resource was used for the hybrid energy system is located in the under investigated area with geographical coordinates defined as: latitude N 35o, 59', longitude E 51o, 59' and average altitude 1800 m above sea level. The solar radiation data for this region was obtained from the NASA Surface Meteorology and Solar Energy (2014) (see Fig. 2). The annual average of solar irradiation is estimated 4.9 kWh/m2/day.
2.3. Wind Speed
Since the energy from the PV array is not sufficient to provide the average daily energy demand, the wind turbine can be used to provide the remaining power needed.
Wind Power is energy extracted from the wind, passing through a machine known as the windmill. The windmill in this case is usually called a wind turbine. This turbine transforms the wind energy to mechanical energy, which in a generator is converted to electrical power. An integration of wind generator, wind turbine, aero generators is known as a wind energy conversion system (WECS) (Ahmed 2010). Based on the wind speed data obtained from an anemometer tower (that was installed at the roof the building), the average monthly wind speed variations measured at 10, 20, and 40 meters above the surface of the earth. The data measured at 20 meters above the surface of the earth are depicted in Fig. 3; this Fig. shows that the wind speed is ranged from 3.2 m/s to 4.9 m/s.
Fig. 3. The monthly wind speed data for the under investigated location.
2.4. Electrical Load Demand
Table 1. Stand-alone electric load worksheet in a sample day in summer.
| Hour | Power(watt) | Hour | Power(watt) |
| 0 | 0 | 12 | 500 |
| 1 | 0 | 13 | 500 |
| 2 | 0 | 14 | 500 |
| 3 | 0 | 15 | 500 |
| 4 | 0 | 16 | 500 |
| 5 | 0 | 17 | 500 |
| 6 | 100 | 18 | 100 |
| 7 | 100 | 19 | 100 |
| 8 | 500 | 20 | 100 |
| 9 | 500 | 21 | 100 |
| 10 | 500 | 22 | 0 |
| 11 | 500 | 23 | 0 |
| Total | 5600 | ||
In this study, the WC rooms of building were selected to test the feasibility of the designed hybrid renewable energy system. A typical sample of the daily load profile of the building is shown in the Table 1. From the load profile, it can be seen that, the maximum demand occurs during daytime from 8 am to 6 pm. The scaled annual average energy demand of the studied building is simulated by HOMER software.
The lighting equipment and other electrical devices used in this building are the following: indoor lamps, outdoor lamp and ceiling fan.
The system is assumed to work for 7 days a week. The load profile analysis calculation is shown in Table 1.
2.5. PV Array
In this study, to fulfill the basic load demand of the studied building, the nominal power rating for the PV modules was set at 1.8 kWp, which would be enough to provide the peak demand. The PV modules consist of solar panels and MA45 modules comprise of independent sub arrays. Each sub array consists of 16 modules. The PV module is a polycrystalline silicon type with maximum output of 45 W. The area of each module is 0.45 m2 (46.2 cm ×97.7 cm). The panels were modeled as fixed and tilted at 45 degree and mounted such that the module is facing south direction (Zhou et al. 2010). The nominal operating temperature of the PV module is at 45oC in which the efficiency under standard test condition is 11.5 %. The specifications of the modules in the standard condition (at 1000 W/m2 radiation and 25°C temperature), are listed in Table 2.
2.6. Wind Turbine
Wind turbines are used to convert the wind power into electric power. Wind turbine systems are available ranging from 1kW to 9-10 MW. The energy production by wind turbines depends on the wind velocity acting on the turbine. Wind power is used to feed both energy production and consumption demand, and transmission lines in the rural areas.
Wind turbines can be classified with respect to the physical features (dimensions, axes, number of blade), generated power and so on.
The fundamental equation governing the mechanical power capture of wind turbine rotor blades which drives the electric generator is given by (Ahmed 2011):
![]() (1)
(1)
Where r, is the air density (kg/m3), A, is the rotor sweep area, V, is the wind velocity (m/s), Cp represent the power coefficient of the wind turbine. Thus if the air density, swept area and wind speed are assumed constant the output power of the wind turbine will be a function of the power coefficient. The wind turbine is normally characterized by its Cp–TSR characteristic, where the TSR is the tip speed ratio and is given by:
![]() (2)
(2)
In Eq. (2), R and w are the turbine radius and the mechanical angular speed, respectively and V is the wind speed. The power coefficient has its maximum value at the optimal value of the tip speed ratio (TSRopt) which result in optimum efficiency of the wind turbine and capturing the maximum available wind power by the turbine (Ahmed 2011).
In this simulation, the model Generic 1kw (DC) type wind turbine was chosen (HOMER 2013). Table 2 shows the technical characteristics of the wind turbine. For economic assessment, the operating and maintenance cost is assumed to be 4 %. The Fig. 4 shows the power-speed characteristic of the wind turbine generated using HOMER.
Fig. 4. The power-speed characteristic curve of Generic 1kw wind turbine.
2.7. Batteries
The major components include P.V modules, battery and inverter. The most efficient way to determine the capacities of these components is to estimate the load to be supplied. The size of the battery bank required will depend on the storage required, the maximum discharge rate, and the minimum temperature at which the batteries will be used.
The batteries in use for solar systems are the storage batteries, otherwise deep cycle motive type. The battery to be used (Rehman and Al-Hadhrami, 2010):
(a). should be able to withstand several charge and discharge cycles
(b). should be in low self-discharge rate
(c). should be able to operate with the specified limits.
Batteries are rated in Ampere-hour (Ah) and their sizing depends on the required energy consumption. The battery capacity is determined by the Eq. (3) (Zoulias and Lymberopoulos 2007):
BC = 2*f*W/Vbatt (3)
Where BC is Battery Capacity
F is Factor for reserve
W is Daily energy
Vbatt is the System DC voltage
The Banner Batteries (GB) Ltd. Company (rated at a nominal voltage of 12 V, with a capacity of 200 Ah) storage batteries (Banner Batteries 2013) were chosen in this simulation. In order to produce higher energy capacity, batteries are connected in series, which form battery string that consists of two lead acid batteries in each string. Each string of battery can produce 4.8 kWh of electricity. Number of battery strings is varied from 1 to 4 strings to assess the performance of energy. The estimated price of each battery is 398 with a replacement cost of 398 This battery is characterized by its versatility of application and zero-maintenance design. The life expectancy of battery is 10 years [25]. Different numbers of batteries (0, 1, 2, 3, and 4) were considered in this analysis. The 24 V battery bank originally consisted of 4.8 kWh of storage in (2×2) sealed, valve-regulated, deep-cycle batteries.
2.8. Inverter
An inverter is required for a system in which DC components serve as an AC load or vice versa. It can operate as a rectifier which converts AC to DC, an inverter which converts DC to AC, or both. The inverter used in this project is a Sunny Boy model 2500U. It is based on a power unit that operates with a high efficiency and optimal reliability. Power conditioning capital cost is around 600-800 kW. The estimated capital cost of an inverter is 1368 US$ and replacement cost of 1368 US$ is considered. A lifetime of 20 years was assumed in which the both inverter and rectifier efficiencies were assumed to be 94 %, for all sizes considered (Sunny Boy 2500U 2013). Various sizes of inverters (0 and 2.5 kW) were considered in the analysis. HOMER was used to simulate each system with power switched between the inverter and the generator. For more detailed specifications, readers are referred to the Table 2.
3. Results and Discussions
3.1. Simulation of the Energy System with HOMER Tool
The simulation is done with a project lifetime of 20 years. Also an annual interest rate of 12 % is used in the economic calculations. The schematic diagram of the stand-alone hybrid energy system as designed in HOMER simulation software is shown in Fig. 1.
Table 2. Technical and economic specification for the components of proposed hybrid energy system.
| Description | Specification |
| 1. PV modules (MA 36/45) | |
| Material | Polycrystalline silicon |
| Nominal power | 45 W |
| Nominal load voltage | 20.5 V |
| Voltage in maximum power point | 16.7 V |
| Short circuit current | 2.96 A |
| Current at maximum power point | 2.74 A |
| Nominal efficiency | 11.5 % |
| Capital cost | 342 US$ |
| Replacement cost | 300 US$ |
| Operating and maintenance cost | 10 US$/year |
| Lifetime | 25 years |
| 2. Wind Generator | |
| Rotor diameter | 3 m |
| Blades | 3-carbon fiber composite |
| Start-up wind speed | 3m/s |
| Rated power | 1000 W DC at (12.5 m/s) |
| Voltage | 48 VDC |
| Over speed protection | Electronic torque control |
| Capital cost | 980 US$ |
| Replacement cost | 300 US$ |
| Operating and maintenance cost | 30 US$ |
| Lifetime | 20 years |
| 3. Battery bank (Type Banner SBV 12-200) | |
| Nominal voltage | 12 V |
| Nominal capacity | 200 Ah |
| Round trip efficiency | 70 % |
| Minimum state of charge-state of charge (SOC) | 30 % |
| Nominal energy capacity of each battery (V´Ah/1000) | 2.4 kWh |
| Capital cost | 398 EUR |
| Replacement cost | 398 EUR |
| life expectancy | 10 years |
| 4. Inverter (Sunny Boy model 2500) | |
| Pnominal | 2200 WP |
| Max input voltage (VDC, max) | 600 V |
| PV-Voltage MPPT (Vpv) | 250-600 V |
| Max input current | 11.2 A |
| Pmax | 2500 W |
| Peak inverter efficiency | 93-94.4% |
| AC Input frequency | 49.8-50.2 Hz |
| VAC | 198-251 V |
| Capital cost | 1368 US$ |
| Replacement cost | 1368 US$ |
| Lifetime | 20 years |
3.2. PV-Wind Hybrid System Optimization Results
Load profile and meteorological data from the operation of the hybrid PV-wind system in the office building is used in this study. Hourly solar radiation and wind speed measurements for a period of one year were imported into HOMER tools to calculate monthly average values of clearness index and daily radiation. The annual average global radiation is 4.441 kWh/m2/day with an annual average clearness index of 0.556 and the annual average wind is 3.993 m/s. The results are displayed in overall form in which the top-ranked system configurations are listed according to their net present cost (NPC) for possible system type. Fig. 5 shows a list of the possible combinations of system components in the overall form.

Fig. 5. Final result of the simulation and optimization process.
Table 3. Electrical production and demand for the PV-Wind energy system.
| Annual electric energy production | |
| PV array | 2845 kWh/yr (73 %) |
| Wind turbine | 1068 kWh/yr (27 %) |
| Total | 3913 kWh/yr |
| Annual electric energy consumption | |
| AC primary load | 2044 kWh/yr (100 %) |
| Total | 2044 kWh/yr |
The system was simulated to evaluate its operational characteristics, annual electrical energy production; annual electrical loads served, excess electricity, RE fraction, capacity shortage, unmet load etc. A load-following control strategy was followed in the simulation. Under this strategy, whenever a power generator in needed it produces only enough power to meet the demand.
Table 3 shows the electrical production and demand for the PV-Wind energy system. The results of the simulation shows that this system has a total annual electrical energy production of 3913 kWh/yr, in which the total energy produced from a PV array is higher than the energy generated from wind turbine.
In addition the share of the PV array and the wind turbine for electrical production in each month of the year is demonstrated in the Fig. 6. As can be seen the amount of electricity production is ranged from 0.3 kW in Dec to almost 0.6 kW in July. The figure clearly states that the amount of energy produced by solar panels is much bigger than the energy production by the wind turbine.
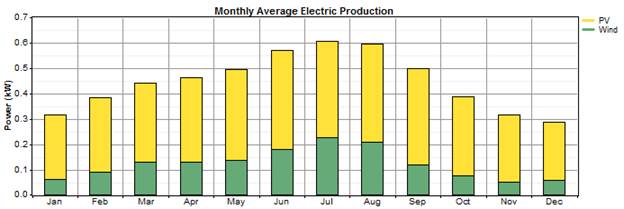
Fig. 6. Contribution of the power units for 100 % utilization of renewable energy.
According to the results of the optimization process (see Fig. 5) the optimum energy system comprises of 1.8 kW PV modules, a wind turbines (1 kW), 2.5 kW converter and 12 batteries. The cost of energy (COE) of the studied systems is 2.693 US$/kWh, whereas the initial capital required and net present cost (NPC) are 31400 US$ and 70358 US$, respectively. This could be a good choice for implementation as the contribution made by renewable resources is quite significant.
4. Conclusions
Resource optimization is a major factor in the assessment of the effectiveness of renewable energy systems. Various methods are being utilized by different researchers in planning and sizing of the grid-connected or off-grid hybrid PV/Wind systems. In this study, by using the HOMER software computer model, we determined the most efficient and economical hybrid energy system which uses wind and solar sources in the proposed building.
Based on the results of the optimization process, the optimal energy system includes 1.8 kW PV modules, a wind turbine (1 kW), 2.5 kW converter and number of 12 batteries. The cost of energy (COE) of the studied systems is 2.693 US$/kWh, whereas the initial capital required and net present cost (NPC) are 31400 US$ and 70358 US$, respectively. The results of the simulation shows that this system has a total annual electrical energy production of 3,913 kWh/yr, in which the total energy produced from a PV array is higher than the energy generated from wind turbine. The proposed designed hybrid system could be a good alternative for implementation, as the contribution made by renewable resources is quite significant.
References
- Ahmed, A. S. (2010). "Wind energy as a potential generation source at Ras Benas, Egypt", Renewable and Sustainable Energy Reviews, 14(8), 2167-2173.
- Ahmed, S. (2011), Wind Energy: Theory and Practice, PHI Learning Pvt, New Delhi, India.
- Ataei, A., Biglari, M., Nedaei, M., Assareh, E., Choi, J. K., Yoo, C., and Adaramola, M. S. (2015). "Techno‐economic feasibility study of autonomous hybrid wind and solar power systems for rural areas in Iran, A case study in Moheydar village", Environmental Progress & Sustainable Energy.Published online, available at doi: 10.1002/ep.12121.
- Banner Batteries available athttp://www.bannerbatterien.com[Accessed date 20.8.2013]
- Buildings energy data book, US Department of Energy; 2011. Available from:http://buildingsdatabook.eere.energy.gov/.[Accessed date 7.6.2014]
- Fesli, U., Bayir, R., and Özer, M. (2009), "Design and implementation of a domestic solar-wind hybrid energy system", Proceedings of the International conference on Electrical and Electronics Engineering, 2009. Turkey, Novamber.
- HOMER available at http://homerenergy.com[Accessed date 20.8.2013]
- Irshada, K., Habiba, K., Thirumal, N. (2014). Energy and cost analysis of Photo Voltaic Trombe wall system in Tropical climate, P. Industries, Editor. 2014.
- Ke, M.T., Yeh, C.H. and Jian, J.T. (2013). Analysis of building energy consumption parameters and energy savings measurement and verification by applying eQUEST software, Energy and Buildings, 61, 100–107.
- Khan, M. J., and Iqbal, M. T. (2005). "Pre-feasibility study of stand-alone hybrid energy systems for applications in Newfoundland", Renewable energy, 30(6), 835-854.
- Martinez, A., D. Noble, S. SCHILER, M, and M. Paterson. (2012). Facade Retrofit, Strategies for energy reduction in an office building in a mild climate.
- NASA Surface Meteorologyand Solar Energy. Available from:https://eosweb.larc.nasa.gov/sse/.[Accessed date 7.6.2014]
- Neto, A.H., Fiorelli, F.A.S. (2008).Comparison between detailed model simulation and artificial neural network for forecasting building energy consumption. Energy and Buildings, 40(12),2169-2176.
- Ngan, M. S., and Tan, C. W. (2012). "Assessment of economic viability for PV/wind/diesel hybrid energy system in southern Peninsular Malaysia", Renewable and Sustainable Energy Reviews, 16(1), 634-647.
- Rehman, S., and Al-Hadhrami, L. M. (2010). "Study of a solar PV–diesel–battery hybrid power system for a remotely located population near Rafha, Saudi Arabia", Energy, 35(12), 4986-4995.
- Sunny Boy 2500U available athttp://www.hws.edu[Accessed date 20.9.2013]
- Tina, G., Gagliano, S. and Raiti, S. (2006), "Hybrid solar/wind power system probabilistic modeling for long-term performance assessment", Solar Energy, 80(5), 578–588.
- Xing, J., Ren, P., Ling, J. (2015). Analysis of energy efficiency retrofit scheme for hotel buildings using eQUEST software: A case study from Tianjin, China, Energy and Buildings, 87,14–24.
- Yang, H., Lu, L., and Zhou, W. (2007). "A novel optimization sizing model for hybrid solar-wind power generation system", Solar energy, 81(1), 76-84.
- Yu, J., Yang, C., Tian, L. (2008). Low-energy envelope design of residential building in hot summer and cold winter zone in China. Energy and Buildings, 40(8),1536-1546.
- Zhou, W., Lou, C., Li, Z., Lu, L., and Yang, H. (2010). "Current status of research on optimum sizing of stand-alone hybrid solar–wind power generation systems", Applied Energy, 87(2), 380-389.
- Zhu, Y., (2006). Applying computer-based simulation to energy auditing: A case study, Energy and Buildings, 38 ,421-428.
- Zoulias, E. I., and Lymberopoulos, N. (2007). Techno-economic analysis of the integration of hydrogen energy technologies in renewable energy-based stand-alone power systems. Renewable Energy, 32(4), 680-696.


