
American Journal of Renewable and Sustainable Energy, Vol. 1, No. 3, September 2015 Publish Date: Jul. 29, 2015 Pages: 106-114
Integration of a Photovoltaic System and a Combined Heat and Power Generator in an Educational Building Using eQUEST and HOMER Models
Abtin Ataei1, 2, *, Jun-Ki Choi2, Neda Ziabakhsh3, Mehdi Namdari1, Majid Zare1
1Department of Mechanical and Aerospace Engineering, University of Dayton, Dayton, Ohio, USA
2Department of Energy Engineering, Graduate School of the Environment and Energy, Science and Research Branch, Islamic Azad University, Tehran, Iran
3Faculty of Architecture, Islamic Azad University of Roudehen, Roudehen, Iran
Abstract
To improve the energy efficiency of a building, a variety of energy retrofitting measures (ERMs) could be applied. By using simulation models such as eQUEST, the effect of each ERM can be estimated separately or as a whole. In this paper, an integration of a photovoltaic (PV) system and a combined heat and power (CHP) generator in an educational building located in Dayton OH was designed to conserve the energy consumption and reduce carbon dioxide emission, using eQuest and Homer models. Furthermore, some ERMs including, enthalpy wheel, natural ventilation, daylighting and overhang were adopted to the model to explore the optimum energy saving solution. The results showed that the PV-CHP integrated system with the all ERMs, might lead to a 32.5% reduction in the total energy consumption and annual carbon dioxide emissions. Besides, the total annual bill toward the retrofitting options was reduced up to 54%. The Homer model showed that 46% of the heating load of that building should be supplied by the CHP system and a standalone boiler may cover the rest. The investment required for applying the ERMs and the PV-CHP integrated system was $225,500 and the payback was 5.8 years.
Keywords
Energy Modelling, eQUEST, HOMER, Photovoltaic, CHP, Enthalpy Wheel, Day Lighting Control System
Received: June 26, 2015
Accepted: July 15, 2015
Published online: July 28, 2015
@ 2015 The Authors. Published by American Institute of Science. This Open Access article is under the CC BY-NC license. http://creativecommons.org/licenses/by-nc/4.0/
Contents
1. Introduction
Nowadays, the global energy demand and CO2 emissions are growing increasingly. Fossil fuels, as the major source of energy, are depleting. Therefore, increasing of the energy consumption and decreasing of the energy resources have made a critical situation for future of the energy supply [1]. It shows the vital role of energy saving and energy efficiency improvement on reduction of the energy demand and CO2 emissions.
Residential and commercial buildings are responsible for 41% of the energy consumption in the United States. In addition, 33% of the total worldwide greenhouse-gas emission is generated from buildings [2]. Therefore, adopting energy efficiency measures has become more important in aspect of designing a building [2]. Recent global trends emphasize implementing energy policies to improve the energy efficiency and to decrease the total energy consumption to achieve low carbon buildings. The U.S. Department of Energy's (DOE) Building Technologies Program has adopted the goal of making zero-energy commercial buildings (ZEBs) marketable by 2025 [1,2].
Various level of numerical simulation tools are considered to improve the building energy efficiency and assess the feasibility of application of photovoltaic (PV) systems and combined heat and power (CHP) generation in buildings. Diverse array of building energy simulation tools such as EnergyPlus [3], eQuest [4], DesignBuilder [5], DOE2 [6], ECOTECT [7] and OpenStudio [8] have been developed and used for improving the energy efficiency of buildings.
Greenberg et. al. [9] presented the model of Sustain as a novel interactive graphical interface to simulate and analyze the energy consumption in buildings. Drury et. al. [10] compared the features of many building energy simulation programs. Tsun Ke et. al. [11] examined the impact of energy consumption parameter changes on the total energy consumption of an office building by applying International Performance Measurement and Verification Protocol (IPMVP) and eQuest model. They concluded that the lighting power density has a significant impact on the energy consumption. Zhu [12] used eQUEST to examine different methods of energy savings on a sample building and evaluate the building energy consumption. An existing hotel in Tianjin, China, was investigated by Xing et al. [13]. The results showed that internal loads have the greatest impact on the accuracy of the model followed by the occupancy rate and Coefficient of Performance (COP) of the cooling systems. Li et. al. [14] used DOE 2.1 model to show a possibility of 9.3% energy conservation by optimizing the daylighting in an office building. Chidiac et. al. [15], by using EnergyPlus, investigated multiple Energy Retrofitting Measures (ERMs) such as heating efficiency, infiltration, lighting load for three different buildings. They concluded that in most cases, combination of multiple ERMs would not result same to the sum of the individual ERMs.
Heat and electricity are the major energy needed in commercial buildings. In most cases, the heat and electricity are supplied by utility companies. However, on-site heat and electricity production might not only provide the energy demand in buildings in an economical way, but also it could make a possibility to export the excess energy.
Recent studies suggested PV systems and CHP generators for on-site production of heat and electricity in buildings [16-28]. Lee et. al. [16] considered a Building Integrated PV (BIPV) system for a zero energy building with the capacity of 105 MWh which could supply not only the total energy consumption but also it can produce an extra electricity. Angrisania et. al. [17] accomplished an experimental analysis on a heating, ventilation and air conditioning (HVAC) system in conjunction with a natural gas-fired micro-CHP. Giffin [18] concluded that the CHP system is much more efficient and cost-effective than the conventional power supply, if it uses the natural gas as the main fuel. Entchev et. al. [19] analyzed a ground source heat pump (GSHP) CHP system for a commercial building.
In this study, eQUEST as a well-known building energy model, is used to estimate the energy consumption of a 4-story educational building in Dayton, Ohio, as the baseline model. Then, some retrofitting measures were applied to the baseline model to examine the low cost ERMs to reduce the total energy demand. An integration of a PV system and a CHP generator (PV-CHP) was suggested to supply the energy demand. To explore the optimal configuration for the on-site heat and power generation system, the model of Homer [29] was employed. Homer analyzed all scenarios through its optimization and sensitivity analysis algorithms and suggested the best economical scenario for configuration of the on-site heat and power generation system.
The present paper differs from the similar studies in that it was attempted to make a connection between eQUEST and HOMER models to explore the optimum scenario for the PV-CHP integrated system with consideration of ERMs' effects on the building's energy demand at the same time. Because Homer model cannot simulate the energy performance of the building and effects of the other retrofitting measures, the building was simulated by eQUEST at the same time to investigate the new energy consumption. Finally, the total energy consumption and CO2 emission of the baseline model were compared to those of the final situation.
2. Baseline Model Development
A 4-story educational building with area of 25,000 ft2in Dayton Ohio was modelled in eQUEST. In Dayton OH, the weather condition is of mixed dry type the latitude and longitude are 39.7594°N, 84.1917°W, respectively. The building dimensions are 85ft x 73ft and the roof to ceiling height is almost 13ft. The schedule is 8am to 5pm from Monday to Friday. Hence, HVAC system starts at 7am and stops at 5pm only in working days. Case assumptions are given in Table 1.
Table 1. Assumptions for the baseline model.
| Working hours in the educational building | A 10-hour shift |
| The building shape | Square |
| The HVAC system type | Variable air volume |
| The humidity control type | Active |
| Insulation of the roof and floor | R-25 |
| Insulation of the external walls | R-16 |
All equipment is controlled by a central system which is installed on the building roof and is responsible to support air conditioning, heating and cooling of the whole area. The type of the system is variable air volume (VAV) including an air handling unit (AHU), three chillers and a cooling tower. The building has some integrated digital controllers which currently manage the space temperature of the building. The façades are of ordinary one which is common in Dayton. It means the window wall ratio is 35%.
Firstly, the baseline model in eQUEST was developed (Fig. 1). In this step, there is no ERMs and it was assumed that only the default system has been installed exactly according to the case assumptions. It means only the existing envelope and HVAC system were simulated. Then, the heating and cooling loads were calculated. After performing the simulation, electric and gas consumptions were computed by the model. The results are shown in Fig.2.
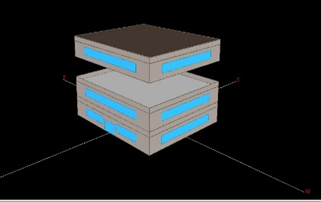
Fig. 1. The baseline model of the educational building.
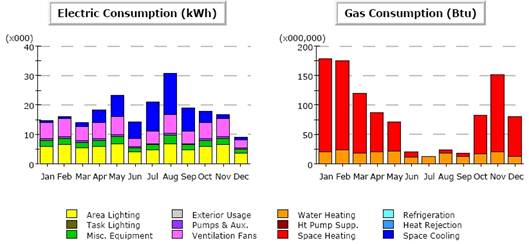
Fig. 2. Annual electric and gas consumptions before applying ERMs.
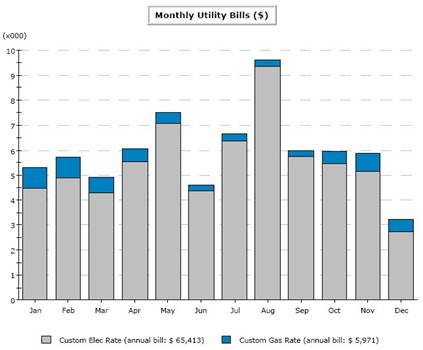
Fig. 3. Baseline monthly utility bills, in USD.
Gas consumption estimated in eQUEST was in terms of BTU which was converted to MWh. Therefore, total electric and gas consumptions were 214.04 and 299.05 MWh, respectively (Table 2). It should be noted that Ataei et al. [20] concluded that for a sample commercial building, the difference between eQUEST results and real electricity and gas consumption bills are less than 3%. Hence, eQUEST results could be trusted with an acceptable accuracy.
Table 2. The baseline annual energy demand.
| Annual energy consumption (MWh) | |
| Electric consumption | 214.04 |
| Gas consumption | 299.05 |
| Total energy consumption | 513.09 |
Since the climate condition is different in each month, different monthly utility bills will be received. The minimum and maximum rates belonged to August and December, respectively. Fig. 3 shows the total annual utility bill across all rates which equals to $71,384.
To simplify the model, it was assumed that the demand for electricity is supplied only by the utility company's natural gas fired power plant. Therefore, natural gas could be considered as the sole source of the CO2 emissions for the entire of the energy system. Based on the data given by the US Energy Information Administration website [30], the CO2 emission factor for natural gas is 1.21 pounds of CO2 per kWh. Hence, for 513.09 MWh of total annual energy consumption, 281.61 tons of CO2 emission would be generated per year.
3. Applying ERMs to the Baseline Model
Before designing an on-site heat and power generator (based on PV and CHP) to supply the energy demand in that educational building, the following ERMs were adopted to the building to reduce the total energy consumption. The following ERMs were analyzed using eQUEST model. Then, those were evaluated to achieve the impact of applying all ERMs to the baseline model.
- Enthalpy wheel
The enthalpy wheel is a device that can recover the heat loss through an air-to-air heat exchanger. The main idea of the facility is to get both heat and moisture from the exhaust air and use it for the fresh air entering the HVAC system. Therefore, it can reduce the total energy consumption since less energy is needed to make the inlet air meet the designed criteria [31].
- Natural Ventilation
Natural ventilation is a passive method to supply and exhaust the air through the space only by natural facilities. It means no air moving equipment such as fans, electrical dampers is required for ventilation. The pressure differences between the building structure and the surrounding cause the natural air flow which may result in indoor space cooling and ventilation. Therefore, natural ventilation may reduce the total energy cost since less energy is required to supply outdoor air to the space [32].
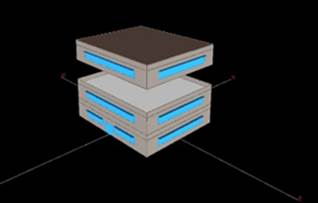
Fig. 4. The building model after applying the ERMs.
- Daylighting
Another suggested ERM is to optimize the daylighting to reduce the electrical energy consumption used for lighting. Daylighting is a free approach but it is limited. If the building is designed correctly, energy can be saved not only by reduction in the electrical lighting loads but also through decreasing the cooling load and lowering its internal heat gains. It means by applying daylighting measures in the building, the operation efficiency of the building and its occupants will be improved [33].
- Overhang
Overhangs and fins on the building's façade prevent direct sunlight from shining into the building in the summer, thus reducing the cooling load and preventing glare. The projection of each overhang on the glazing is about 1 to 3 ft. Ataei et. al. [20] showed that the best energy saving will be on the depth of 3 ft for commercial buildings in Dayton OH. Also, according to their model, only the southern fenestrations need to be equipped with fins and overhangs.
- Sky Lift Roof
To make more air circulations and a better natural light, sky lift roof is another passive measure. It is attached to the wall framing and standard roof jacks [34].
- Results of the ERMs
The following ERMs were adopted to the eQuest baseline model and their effectiveness was estimated. Fig.4 shows the building model with the improved façade .
• Applying the enthalpy wheel and heat recovery.
• Applying a natural ventilation for all zones.
• Improvement of daylighting.
• The overhangs were installed on the south facing windows.
• Installing a sky lift roof.
Table 3. Annual energy demand after applying the ERMs.
| Annual energy consumption (MWh) | |
| Electric consumption | 199.35 |
| Gas consumption | 175.79 |
| Total energy consumption | 375.14 |
The results of the eQuest model after applying those ERMs are given in Fig. 5 and Tables 3 and 4. As seen, the ERMs affected the electric and gas consumptions significantly. The new total electric and gas consumptions are 199.35 and 175.79 MWh, respectively. The new results indicated a 6.8% saving in electric consumption, while 41.2% saving is achieved in gas consumption which is a significant reduction in fuel consumption (Table 3). The detail comparisons are given in Table 4. Table 4 clarifies a 26.9% improvement in total energy consumption of the educational building.
Table 4. Comparison between before and after applying the ERMs.
| Annual energy consumption | Baseline (MWh) | After applying the ERMs (MWh) | Saving |
| Electric consumption | 214.04 | 199.35 | 6.8% |
| Gas consumption | 299.05 | 175.79 | 41.2% |
| Total energy consumption | 513.09 | 375.14 | 26.9% |
Fig. 6 demonstrates the total annual utility bill across all rates after applying the ERMs. That is $65,504 which shows a 8.2% saving. In addition, in this step, for 375.14 MWh of total energy consumption, 205.89 tons of CO2 emission would be generated which is about 27% reduction.
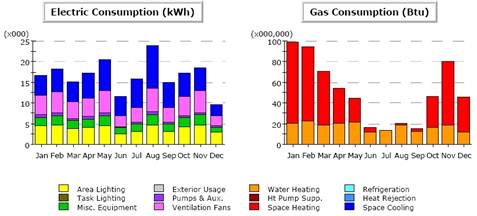
Fig. 5. Electric and gas consumptions after applying the ERMs.
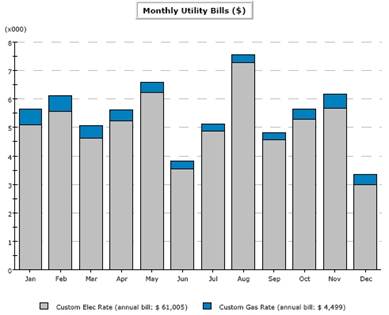
Fig. 6. The monthly utility bill in USD after applying the ERMs.
4. Designing an On-Site Energy Generator
- CHP
Generators are devices which produce electricity and release heat as a by-product due to their structures and inefficiencies. CHP systems can recover the waste heat to supply useful heat in terms of hot water, hot air, hot oil or steam. It would be environment friendly because of the much higher energy efficiency [35].
- PV
A PV system is a facility which converts sunlight to electricity. The PV system includes some PV arrays, generator, inverters, wirings, etc. It can be connected to the electricity network in case of being on-grid or equipped with batteries and working independently in the mode of off-grid.
- PV-CHP integrated system
The new heat and electricity demand of the educational building after applying the aforementioned ERMs can be supplied by an integration of a PV and a CHP system which is called PV-CHP integrated system. The optimum scenario for the PV-CHP integrated system can be achieved by using Homer model and the performance of that optimal scenario can be estimated in detail by using eQuest model.
Following data was used as the input to Homer model to find the optimal scenario for the PV-CHP integrated system:
• Latitude information of the Dayton OH and the updated data through the Internet.
• The monthly energy consumption and heating and cooling loads for 24 hours of day in detail from the eQuest model after applying the ERMs to the baseline model.
The all acceptable capacities for the PV, converter, batteries and power generator were calculated by Homer model and the optimal scenario for the PV-CHP integrated system was determined. The optimal scenario is given in Table 5.
Table 5. The optimal scenario for the PV-CHP integrated system according to Homer results.
| PV Array | 10 kW |
| Generator 1 | 15 kW |
| Battery | 48 Batteries, 125Ah each |
| Inverter | 10kW |
| Rectifier | 10 kW |
| Dispatch strategy: cycle charging | |
Based on HOMER results, and to estimate the performance of the PV-CHP integrated system, the building which was equipped with the ERMs, including enthalpy wheel and heat recovery, natural ventilation, daylighting, overhang and sky lift roof and the optimal PV-CHP integrated system, which is called the final situation, was modeled by eQUEST. The results are given in Fig. 7.
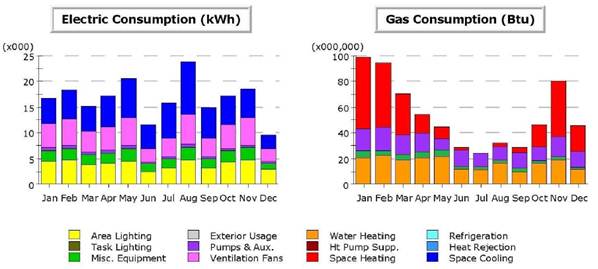
Fig. 7. The electric and gas consumptions after applying ERMs and the PV-CHP integrated system.
Table 6. Comparison of the annual energy demand between the baseline and final situation.
| Annual energy consumption | Baseline (MWh) | Final situation (MWh) | Comparison | |
| Value | Percent | |||
| Electric consumption | 214.04 | 193.14 | 20.9 | 9.7% |
| Gas consumption | 299.05 | 152.81 | 146.24 | 48.9% |
| Total energy consumption | 513.09 | 345.95 | 167.14 | 32.5% |
The annual energy demand of the educational building before and after applying the ERMs and the PV-CHP integrated system (the final situation) was compared in Table 6. As seen, the building electric consumption in the baseline and final situation are 214.04 and 193.14 MWh, respectively. It means the electricity consumption has been decreased by 9.7% compared to the baseline model. Also, the gas consumption in the baseline and final situation are 299.05 and 152.81 MWh, respectively. In this case, a noticeable reduction in gas consumption was achieved which was about 48.9%. Finally, comparing the total energy consumption of the baseline and final situation (513.09 and 345.95 MWh) shows a 32.5% reduction.
Fig. 8 shows the total annual utility bill across all rates for the final situation. The total annual bill across all rates of the final situation is $32,924, compared to the baseline which was $71,384, shows approximately a 54% decrease.
For 345.95 MWh of total energy consumption, 189.87 tons of CO2 emission is generated which shows approximately 32.6% reduction compared to the baseline. The CO2 emissions of the baseline and final situation are shown in Table 7
Table 7. Comparison of the annual CO2 emission between the baseline and final situation.
| CO2 emissions | Baseline (ton) | Final situation (ton) | CO2 emission decrease | |
| Value | Percent | |||
| CO2 emissions because of the electric consumption | 117.48 | 106.00 | 11.48 | 9.8% |
| CO2 emissions because of the gas consumption | 164.13 | 83.87 | 80.26 | 48.9% |
| Total CO2 emissions | 281.61 | 189.87 | 91.74 | 32.5% |
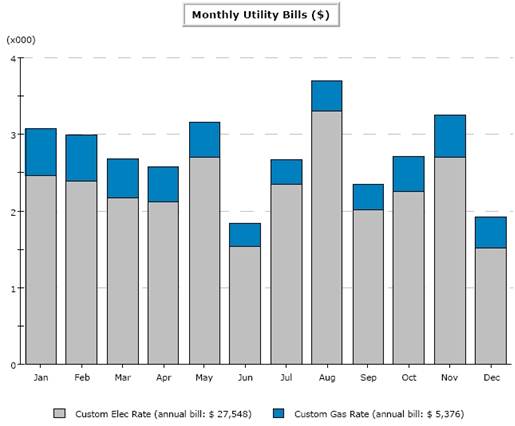
Fig. 8. The monthly utility bill in USD for the final situation.
According to the results of Homer model, the total heating load of the building should not be supplied by the PV-CHP integrated system. Table 8 shows the fractions of thermal loads supplied by the PV-CHP integrated system and the existing stand alone boiler.
Table 8. Share of each thermal energy suppliers.
| Thermal energy suppliers in the building | Supply fraction |
| New CHP system | 46% |
| Existing stand alone boiler | 54% |
| Total | 100% |
According to the price of the components required for the aforementioned ERMs and the optimal scenario for the PV-CHP integrated system predicted by Homer and eQuest models, the final situation needs investment of $225,500. Therefore, the simple payback time is about 5.8 years thanks to $38,460 annual energy saving.
5. Conclusions
Although many studies were conducted on designing and optimization of PV and CHP systems' components in buildings, no attention has been paid to integration of those systems with consideration of ERMs' effects on the building's total energy demand. Applying ERMs in the building will affect not only the building's heating and cooling loads but also the power load because of changing the lighting and solar heat gain ratio. That may change the optimum structure of the PV-CHP integrated system which is supposed to supply those loads in the building.
This study combined Homer and eQuest models to develop a systematic approach to optimal design of the PV-CHP integrated system to supply the power, heating and cooling loads of the building which are directly affected by applying the ERMs.
There are some kinds of ERMs which could be applied to a building to save energy. The energy simulation models such as eQUEST are appropriate tools to analyze the energy performance of the building, before and after applying the ERMs. In this study, some ERMs including enthalpy wheel, heat recovery, natural ventilation, daylighting, overhang and sky lift roof were applied to an educational building located in Dayton OH.
After adopting the low cost ERMs to the baseline model, an integration of a PV and a CHP system was suggested to supply the energy demand. To find the optimal configuration for the on-site heat and power generation system, the model of Homer was employed. The Homer model examined all acceptable capacities for the PV, converter, batteries and power generator and the optimal scenario for the PV-CHP integrated system was determined.
The results of the study showed the followings;
• Applying the enthalpy wheel, heat recovery, natural ventilation, daylighting, overhang and sky lift roof might lead to 29.4% energy saving.
• Adopting the optimal PV-CHP integrated system to the building after applying the ERMs would result in 32.5% decrease in the total energy consumption.
• The total annual utility bill associated with the final situation was $32,924. It showed about 54% decrease in comparison with the baseline model ($71,384).
• The comparison of the annual CO2 emissions between the baseline and final situation showed a 32.5% reduction.
• Applying the EMRs and the optimal PV-CHP integrated system required investment of $225,500. The payback time was less than 6 years thanks to $38,460 annual energy saving.
The Homer model showed that in the optimal configuration of the PV-CHP integrated system, 46% of the heat demand is supplied by the CHP system and the rest should be provided by the existing standalone boiler.
References
- Asia/World Energy Outlook 2013, The Institute of Energy Economics (IEEJ), Japan, pp. 15-17 and 77-86.
- Buildings energy data book, US Department of Energy; 2011. http://buildingsdatabook.eere.energy.gov/.
- EnergyPlus, Version 7.2., Lawrence Berkeley National Laboratory, Berkeley, CA, 2012.
- eQUEST, Lawrence Berkeley National Laboratory, Berkeley, CA, 2010.
- DesignBuilder, DesignBuilder Software Ltd., 2012.
- DOE-2, Lawrence Berkeley National Laboratory, Berkeley, CA, 2008.
- Ecotect Analysis 2011, Autodesk, 2011.
- OpenStudio, Version 0.9.0, National Renewable Energy Laboratory, Golden, CO, 2012.
- D. Greenberg, K. Pratt, B. Hencey, N. Jones, L. Schumann, J. Dobbs, Z. Dong, D. Bosworth, B Walter, Sustain: An experimental test bed for building energy simulation, Energy and Buildings 58 (2013) 44–57.
- Drury B. Crawley, Jon W. Hand, Michael Kummert, Brent T. Griffith, Contrasting the capabilities of building energy performance simulation programs, Journal of Building and Environment 43 (2008) 661–673.
- Ming Tsun Ke, Chia hung Yeh and Jhong Ting Jian, Analysis of building energy consumption parameters and energy savings measurement and verification by applying eQUEST software, Energy and Buildings 61 (2013) 100–107.
- Y. Zhu, Applying computer-based simulation to energy auditing: A case study, Energy and Buildings 38 (2006) 421-428.
- Jincheng Xing, Peng Ren and Jihong Ling, Analysis of energy efficiency retrofit scheme for hotel buildings using eQUEST software: A case study from Tianjin, China, Energy and Buildings 87 (2015) 14–24.
- D.H.W. Li, J.C. Lam, S.L. Wong, Daylighting and its effects on peak load determination, Energy 30 (2005) 1817–1831.
- S.E.Chidiac, E.J.C. Catania, E. Morofsky, S. Foo, Effectiveness of single and multiple energy retrofit measures on the energy consumption of office buildings, Energy 36 (2011) 5037-5052.
- J. B. Lee, J. W. Park, J. H. Yoon, N. C. Baek, D. K. Kim, U. C. Shin, An empirical study of performance characteristics of BIPV (Building Integrated Photovoltaic) system for the realization of zero energy Building, Energy 66 (2014) 25-34.
- G. Angrisania, F. Minichiellob, C. Roselli, M. Sassoa, Desiccant HVAC system driven by a micro-CHP: Experimental analysis, Energy and Buildings 42 (2010) 2028–2035.
- Paxton K. Giffin, Performance and cost results from a DOE Micro-CHP demonstration facility at Mississippi State University, Energy Conversion and Management 65 (2013) 364–371.
- E. Entchev, L. Yang, M. Ghorab, E.J. Lee, Simulation of hybrid renewable microgeneration systems in load sharing applications, Energy 50 (2013) 252-261.
- A. Ataei, J. Ki Choi, M. J. Dehghani1, Ch.Yoo, Assessment of Applying Solar Systems; Photovoltaic, Daylighting and Trombe Wall in an Office Building, using eQUEST Model, "University of Dayton Technical Report", 2015.
- M. Canelli, E. Entchev, M. Sasso, L. Yang, M. Ghorab, Dynamic simulations of hybrid energy systems in load sharing application, Applied Thermal Engineering (2015), doi: 10.1016/j.applthermaleng.2014.12.061.
- J. Porteiro, J.L. Miguez, S. Murillo, L.M. Lopez, Feasibility of a new domestic CHP trigeneration with heat pump: II. Availability analysis, Applied Thermal Engineering 24 (2004) 1421-1429.
- C. Ulloa, P. Eguía, J. L. Miguez, J. Porteiro, J. M. Pousada-Carballo , A. Cacabelos, Feasibility of using a Stirling engine-based micro-CHP to provide heat and electricity to a recreational sailing boat in different European ports, Applied Thermal Engineering 59 (2013) 414-424.
- K. Irshada, Kh. Habiba, N. Thirumalaiswamya, Energy and cost analysis of Photo Voltaic Trombe wall system in Tropical climate, Energy Procedia 50 (2014) 71–78.
- E. M. Saber, S. E. Lee, S. Manthapuri a, W. Yi a, C. Deb, PV (photovoltaic) performance evaluation and simulation-based energy yield prediction for tropical buildings, Energy xxx (2014) 1-8.
- Peter G. Loutzenhisera, Gregory M. Maxwellb, Heinrich Manz, An empirical validation of the daylighting algorithms and associated interactions in building energy simulation programs using various shading devices and windows,Energy 32 (2007) 1855-1870.
- H. Kim, A. Stumpf and w. Kim, Analysis of an energy efficient building design through data mining approach, 2010, Automation in Construction 20 (2011) 37-43.
- V. N. Drosou, P. D. Tsekouras, T. I. Oikonomou, P. I. Kosmopoulos, C. S. Karytsas, The HIGH-COMBI project: High solar fraction heating and cooling Systems with combination of innovative components and methods, Renewable and Sustainable Energy Reviews 29 (2014) 463–472.
- HOMER v2.68 (January 2011), www.homerenergy.com.
- US Energy Information Administration, http://www.eia.gov/tools/faqs/faq.cfm?id=74&t=11
- M. Radov, M. Mohammad, Jessica Vasquez, Alan Li, Brandon Lin, The Enthalpy Wheel, San Jose State University, December 8, 2008.
- http://gbtech.emsd.gov.hk/english/utilize/natural.html
- US Department of Energy, SunShot Vision Study, Feb. 2012.http://www1.eere.energy.gov/solar/pdfs/47927.pdf
- Scot Gibson, Roof Lift, Professional Deck Builder, September-October 2013(http://www.deckmagazine.com/roofing/roof-lift.aspx).
- New York City Department of Buildings, December, 2010,http://www.nyc.gov/html/dob/downloads/-pdf/combined_heat_and_power_systems.pdf


