
American Journal of Renewable and Sustainable Energy, Vol. 1, No. 2, July 2015 Publish Date: Jul. 16, 2015 Pages: 58-65
Evaluating the Potential of Wind Power in Order to Electrify a Remote Village in South East of Iran
Abtin Ataei1, 2, *, Jun-Ki Choi2, Mojtaba Nedaei1
1Department of Energy Engineering, Graduate School of the Environment and Energy, Science and Research Branch, Islamic Azad University, Tehran, Iran
2Department of Mechanical & Aerospace Engineering, University of Dayton, Dayton, OH, USA
Abstract
In this study, an evaluation of the wind resource for over 18 months was done to assess the potential of wind power as a power source in village of Dehak in south east of Iran. The Weibull distribution was used to model the wind data at three heights of 10m, 30m and 40m. Different wind characteristics such as monthly and diurnal wind speed profiles at different heights, wind direction and turbulence intensity were estimated and analyzed. As a result, the Weibull distribution indicated a good agreement with the data obtained from the actual measurements. Although the results revealed that the understudied site doesn't have a sufficient wind energy potential to develop a wind power plant, small and micro-wind turbines still could be used to electrify that remote village. Therefore, an extensive economic feasibility study of installing small wind turbines for sustainable development of the village can be considered in next studies.
Keywords
Dehak Village, Iran, Wind Energy, Weibull Distribution, Micro-Wind Turbine
Received:June 15, 2015
Accepted: June 29, 2015
Published online: July 15, 2015
@ 2015 The Authors. Published by American Institute of Science. This Open Access article is under the CC BY-NC license. http://creativecommons.org/licenses/by-nc/4.0/
1. Introduction
The increasing demand of energy, the growing environmental concerns and rapidly depleting reserves of fossil fuels have made researchers and planners to find cleaner fuel resources to replace fossil fuels. Wind power as an affordable alternative to fossil fuels, is plentiful, renewable, widely distributed, clean, produces no greenhouse gas emissions during operation, and uses little land. Because of its cleanness, wind power is sought wherever possible for conversion to electricity with the hope that air pollution will be reduced as a result of less fossil fuel burning.
The energy of wind has been exploited for thousands of years. The oldest applications of wind energy include extracting water from wells, making flour out of grain and other agricultural applications. In recent years, the use of wind energy has primarily evolved to electricity generation. The field of wind energy blossomed in 1970s after the oil crisis, with a large infusion of research money in the United States, Denmark, and Germany to find alternative sources of energy. By the early 1980s, most incentives for alternative sources of energy vanished in the United States and, therefore, the wind energy utilization shrank significantly. The investments have continued in Europe and made Europe leading in terms of wind technology and wind power capacity installations [1].
In 2011, among 98 countries which use wind energy, Iran was ranked 43th. Iran’s position in 2012 was increased to 47th [2]. This means that although Iran has a favorable wind resource, the use of wind energy in this country is too limited. Although there are several companies attempting to establish wind power plants in different districts in Iran, it cannot be said that the work in this field is satisfactory. Much more is needed to be done to increase interest in this subject.
Wind resource quality is the most obvious factor to concentrate on when choosing a wind turbine location. The wind characterization in terms of speed, direction and wind power is the first step to obtain the initial feasibility of generating electricity from wind power through a wind farm, in a given region [3-7]. In Iran, some relevant works have been developed in this aim. Nedaei [1] presented a study of wind resource assessment in two locations in Hormozgan province in Iran; Jask city and Kish island. The results showed that both two sites are not appropriate place for construction of large-scale wind power plants but it was found that Kish island seems to be suitable for employment of off-grid electrical and mechanical wind driven systems. Nedaei [3] studied the potential of wind power in Abadan airport in south-west of Iran. It was revealed that Abadan region has a good potential of wind power for development of large wind turbines at heights of more than 80 m. Alamdari et. al. [8] analyzed wind speed data for 68 sites during one year at different heights in Iran. GIS themes of wind potential were also used in this study. Mostafaeipour et. al. [9] carried out a study about wind energy potential assessment in the city of Shahrbabak in Iran. The mean wind speed data of three-hour interval long term period from 1997 to 2005 was adopted and analyzed. It was found that the city is not an appropriate place for construction of a large scale wind power plant but it might be suitable for employment of off-grid electrical and mechanical wind driven generators. An economic evaluation was done in order to show feasibility of installing small wind turbines. Rahimzadeh et. al. [10] carried out a research about statistical study of 3 hourly wind data in Esfehan province based on Weibull distribution function. It was suggested that wind energy might be explored in Esfehan province by employing modern wind turbines that require lower start-up wind speeds. Mostafaeipour [11] analyzed wind speed data over a period of almost 13 years between 1992 and 2005 from 11 stations in Yazd province in Iran, to assess the wind power potential at these sites. The results showed that most of the stations have annual average wind speed of less than 4.5 m/s which is considered as unacceptable for installation of the large wind turbines. Mirhosseini et. al. [12] assessed the wind energy potential at five towns in province of Semnan in Iran using Weibull model. They used the power law for extrapolation of 10 m data to determine the wind data at heights of 30 m and 40 m. Keyhani et. al. [13] analyzed three-hour period measured wind speed data of eleven years for the capital city of Iran, Tehran at height of 10 m based on the Weibull model. Their study showed that, the studied site was not suitable for installing large-scale wind turbines.
In this paper, the meteorological data of Dehak region which is located in Sistan and Baluchistan province in south east of Iran was processed to assess the regional wind power potential.
2. Materials and Methods
2.1. Weibull Distribution Function
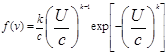
Statistical analysis can be used to determine the wind energy potential of a given site and estimate the wind energy output at the site. To describe the Statistical distribution of wind speed, various probability functions can be suitable for wind regimes. Weibull distribution function is the best one thanks to its high accuracy level [1]. This function has the advantage of making it possible to quickly determine the average of annual production of a given wind turbine. The density function of wind speed probability can be calculated as Eq.1 [1]:
 (1)
(1)
Where f (v) is the probability of observing wind speed v, c is the Weibull scale parameter and k is the dimensionless Weibull shape parameter. The Weibull parameters k and c, characterize the wind potential of the understudied region. Basically, the scale parameter, c, indicates how ‘windy’ the site is, whereas the shape parameter, k, indicates how peaked the wind distribution is (i.e. if the wind speeds tend to be very close to a certain value, the distribution will have a high k value and is very peaked) [1].
2.2. Wind Power Density
Wind power density (WPD) is a better indication of a site's wind energy potential compared to wind speed alone. Its value combines the effect of a site's wind speed distribution and its dependence on the air density and wind speed. WPD is defined as the wind power available per unit area swept by the turbine blades and is given by the Eq.2 [2]:
![]() (2)
(2)
Where n is number of records in the averaging interval, ρ is air density, vi3 is cube of the ith wind speed value [2]. Besides, calculation of wind power density based on the wind speed provided by field measurements can be developed by Weibull distribution analysis using the following form [2]:
![]() (3)
(3)
Where U is the mean wind speed and A is blade sweep area. The gamma function of (x) (standard formula) is calculated as Eq. 4 [1,14,15]:
![]() (4)
(4)
2.3. Turbulence Intensity
Wind turbulence is the rapid disturbance or irregularities in the wind speed, direction, and vertical component. It is an important characteristic of the site, because high turbulence levels may decrease the power output and cause an extreme loading on the wind turbine components. The most common indicator of turbulence for siting purposes is the standard deviation (σ) of wind speed. Normalizing the value with the mean wind speed gives the turbulence intensity (TI) and can be calculated by Eq. 5 [3]:
![]() (5)
(5)
Where σ is standard deviation of the wind speed, U is the mean wind speed [3].
3. Results and Discussion
Dehak (27.14368 N 62.67179 E) is a village located in Saravan county in Sistan and Baluchestan province in southeast of Iran [16,17]. Wind data has been extracted in the understudied site during 18 months from 2006 to 2007 with the time interval of 10 min. This data was analyzed by Windographer software [18]. The average temperature and relative humidity in the studied site are calculated as 20.4 °C and 24.1%, respectively. The meteorological masts with 40m height were installed in suitable coordinates. The data loggers used had three sensors of velocity at 10 m, 30 m and 40 m heights and also two sensors of direction at 30 m and 37.5 m. In Table 1, initial information about wind speed characteristics was given. For installation of wind turbines, it is important to consider that if the mean wind speed is less than 4 m/s, the wind potential is considered as poor, if it is 4 5.4 (m/s), wind potential is considered as marginal, if the mean wind speed is ranged between 5.4 6.7 (m/s), wind potential is considered as good to very good and for the wind speeds more than 6.7 m/s, the wind potential is considered as outstanding [6,14]. According to Table 1, it can be revealed that at the height of 10 m the wind potential is poor but at the heights of 30 m and 40 m the wind potential is considered marginal. In general, it can be concluded that the studied site doesn't have sufficient wind potential for development of commercial wind turbines. The studied site may be suitable for development of small and micro-wind turbines. Therefore, it is suggested that an extensive economic feasibility study of installing small wind turbines (for residential use) for sustainable development of the village can be considered in next studies.
Table 1. Calculated wind speed parameters in the understudied site.
| Height (m) | 10 m | 30 m | 40 m |
| Mean wind speed (m/s) | 3.05 | 4.164 | 4.40 |
| Gust wind speed (m/s) | 26 (21/6/2007 15:55) | 25.6 (21/6/2007 15:45) | 26 (21/6/2007 15:45) |
| Weibull distribution coefficients | k=0.84 c=2.84 m/s | k=1.40 c=4.57 m/s | k=1.44 c=4.85 m/s |
| Wind power density (W/m2) | 78.61 | 131.19 | 150 |
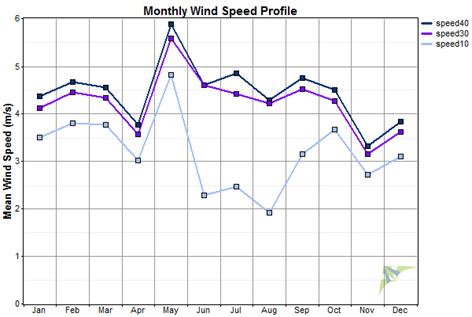
Fig. 1. Monthly wind speed profile in Dehak.
The gust wind speed values in Table 1, are the maximum wind speed occurred during 18 months of recording wind data in Dehak region. As seen in Table 1, at the height of 40 m, the gust wind speed value is 24 m/s, which is relatively low. That gust wind speed occurred at 21/6/2007 15:45. The Gust wind speed in a region should not be high because it makes that region unsuitable for development of wind turbines due to a destructive effect on the wind turbines.
The monthly mean wind speed at the heights of 10 m, 30 m and 40 m is plotted in Fig. 1. It can be seen that wind speed patterns at the heights of 30 m and 40 m are similar but at the height of 10 m, the wind pattern is a little different. As seen in Fig.1, the monthly mean wind speeds at the three heights are ranged from 1.9 m/s in August to 5.9 m/s in May. In May, at the heights of 30 m and 40 m, the mean wind speed is higher than 5.5 m/s and therefore more wind energy can be captured by wind turbines.
The diurnal mean wind speed is demonstrated in Fig. 2. This figure shows the hours of a day that have a suitable wind speed in all over the year. As seen, The best wind speeds almost occur at 12 pm to 9 pm but the poor wind speeds almost occur between 1 am and 7 am.
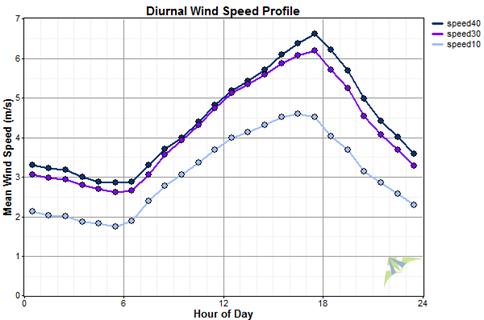
Fig. 2. The diurnal wind speed profile of Dehak village.
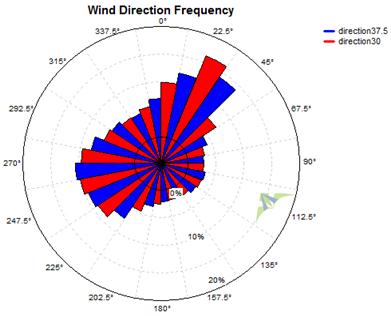
Fig. 3. The wind rose of Dehak village.
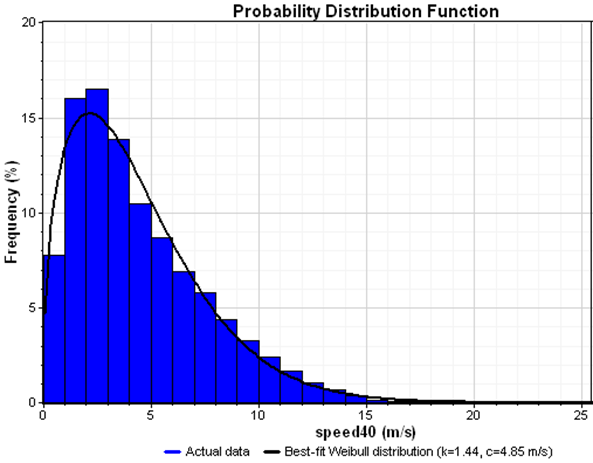
Fig. 4. The wind speed distribution at 40 m.
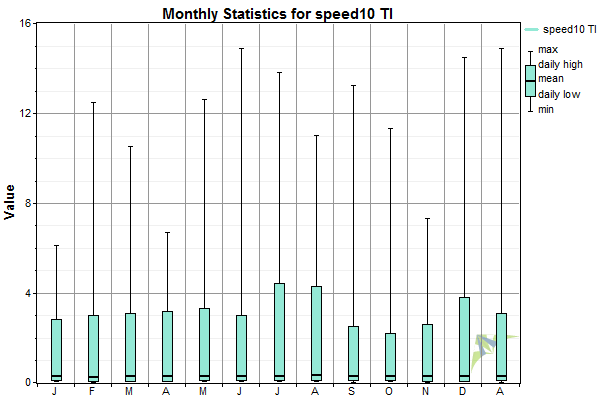
Fig. 5. The monthly mean turbulence intensity at 40 m.
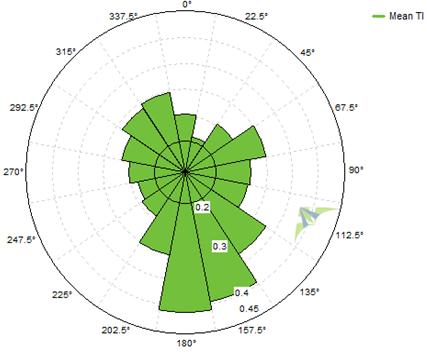
Fig. 6. Polar diagram of turbulence intensity at the height of 30 m.
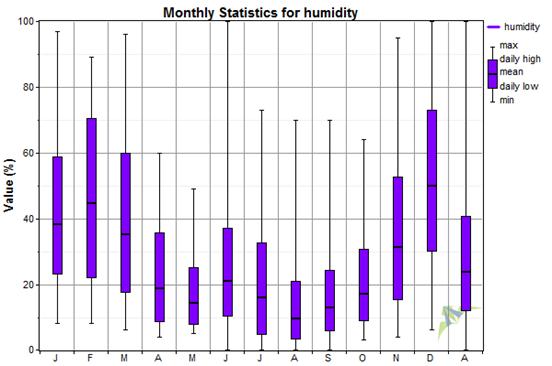
Fig. 7. The monthly average humidity.
Prediction of the wind direction is very important for the wind data analysis, especially in the time of micro-siting and planning for wind farms and wind turbines. Wind rose is a convenient tool for displaying the direction of the wind for wind data analysis [6]. Fig. 3 shows the wind rose at heights of 30 m and 37.5 m for the understudied site. The prevailing winds are mostly from west and northeast.
The wind speed frequency distributions at the heights of 10 m, 30 m and 40 m were estimated using Weibull probability function. the Weibull distribution, at the height of 40 m, fits to the actual distribution data well. The values of the shape (k) and scale (c) coefficients in the Weibull function were calculated and presented in Fig. 4.
One of the most important parameters for wind resource assessment is the turbulence intensity (TI). TI quantifies how much the wind varies typically within 10 minutes. Because the fatigue loads of some components in a wind turbine are mainly caused by turbulence, the knowledge of the site抯 turbulence is very crucial [1]. To achieve the aim, the diagram of annual TI for each month is plotted in Fig.5. As seen in Fig, 5, in the last part of the diagram which is denoted by "A", the annual values of TI are given. The maximum values of TI, which are more than 12 at the height of 40 m, occurred in Feb., Mar., Jun., July, Sep. and Dec. The maximum value of TI in all over the year was observed in Jun. with value of almost 15 which is relatively high. In general, it can be concluded that the high values of TI at the height of 40 m can be a negative factor for choosing the Dehak region as a suitable place for development of wind farms. High TI values (more than 10) can cause severe fatigue loads in the wind turbines [3].
Fig. 6 shows the polar diagram of TI at the height of 30 m. This graph is useful to determine the direction of the wind which has the highest wind TI. As seen in Fig.6, the direction sector of 180 ̊ has the maximum TI among all other directions. It can also be inferred from this figure that the prevailing wind TI is mostly from south and south east.
The diagram of the monthly average humidity is shown in Fig. 7. As seen in Fig.7, the monthly mean values of humidity in the understudied site are ranged from minimum of 10% in August to maximum of 50% in December.
The last diagram is the monthly mean values of temperature in the understudied site with the maximum and minimum values. As seen in Fig.8, the temperature varies from a minimum of 0 ̊ C to maximum of almost 43 ̊ C in July.
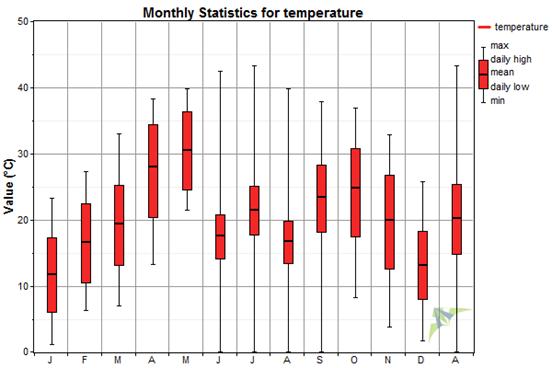
Fig. 8. The temperature variation in the understudied site.
4. Conclusion
In this study, the wind data at different heights in the time interval of 10 minutes was analyzed to determine the wind power potential in Dehak region in Iran based on Weibull probability distribution function. The most important points are as follows;
1. The Weibull distribution presented in this paper indicates a good agreement with the data obtained from actual measurements.
2. At three heights of 10 m, 30 m and 40 m, the monthly mean wind speeds are ranged from 1.9 m/s in August to 5.9 m/s in May. In the month of May, at heights of 30 m and 40 m, the mean wind speed is higher than 5.5 m/s and therefore more wind energy can be captured by the wind turbines.
3. The wind rose analysis showed that, the prevailing wind directions are from west and northeast.
4. The mean power densities were found 78.61 w/m2, 131.19 W/m2 and 150 W/m2 for heights of 10m, 30m and 40 m, respectively.
5. Eighteen month study of wind data in Dehak region has showed that at the height of 10m the wind powe potential is poor but at the heights of 30 and 40 m the wind potential is marginal. In general, it can be concluded that the understudied site doesn't have sufficient wind power potential for development of commercial wind turbines. The understudied site may be suitable for development of small and micro-wind turbines. Therefore, an extensive economic feasibility study of installing small wind turbines for sustainable development of the village should be considered in next studies.
References
- M. Nedaei, Wind Resource Assessment in Hormozgan province in Iran, International Journal of Sustainable Energy, Vol.33, No.3, 2013, pp. 650-694.
- World Wind Energy Report 2012, World Wind Energy Association, available at http://www.wwindea.org/webimages/WorldWindEnergyReport2012_final.pdf [Accessed Jan 10, 2014.]
- M. Nedaei, Wind Resource Assessment in Abadan Airport in Iran, International Journal of Renewable Energy Development, Vol.1, No.3, 2012, pp. 338-347.
- M. Nedaei, Wind Energy Potential Assessment in Chalus County in Iran, International Journal of Renewable Energy Research, Vol.2, No.2, 2012, pp. 87-97.
- M. Nedaei, E. Assareh, M. Biglari, An extensive evaluation of wind resource using new methods and strategies for development and utilizing wind power in Mah-shahr station in Iran, Energy Convers Manage., Vol.81, 2014, pp. 475-503.
- M. Biglari, E. Assareh, M. Nedaei, I. Poultangari, An initial evaluation of wind resource in the Port of Chabahar in South East of Iran. Glob J Sci Eng Technol, Vol.2, No.14, 2013, pp.142. ISSN: 2322-2441.
- M. Nedaei, Feasibility of installing wind turbines in south of Khuzestan Province in Iran in order to produce electricity. In: 17th International conference on Electrical Power Distribution Networks (EPDC), Tehran, Iran, 2 May 2012.
- P. Alamdari, M. Nematollahi, and M. Mirhosseini, Assessment of Wind Energy in Iran: A Review, Renewable and Sustainable Energy Reviews, Vol.16, No.1, 2012, pp. 836-860.
- A. Mostafaeipour, A. Sedaghat, A. A. Dehghan-Niri, and V. Kalantar, Wind energy feasibility study for city of Shahrbabak in Iran,Renewable and Sustainable Energy Reviews, Vol.15, No.6, 2011, pp. 2545-2556.
- F. Rahimzadeh, A. M. Noorian, M. Pedram, and M. C. Kruk, Wind speed variability over Iran and its impact on wind power potential: a case study for Esfehan Province, Meteorological Applications, Vol.18, No.2, 2011, pp. 198-210.
- A. Mostafaeipour, Feasibility study of harnessing wind energy for turbine installation in province of Yazd in Iran, Renewable and Sustainable Energy Reviews, Vol. 14, No.1, 2010, pp. 93-111.
- M. Mirhosseini, F. Sharifi, and A. Sedaghat, Assessing the wind energy potential locations in province of Semnan in Iran, Renewable and Sustainable Energy Reviews, Vol.15, No.1, 2011, pp. 449-459.
- A. Keyhani, M. Ghasemi-Varnamkhasti, M. Khanali, and R. Abbaszadeh, An assessment of wind energy potential as a power generation source in the capital of Iran,Tehran., Energy, Vol.35, No.1, 2010, pp. 188-201.
- M. Nedaei, A. Ataei, C. Yoo, J-K, Choi, E. Assareh, The potential of wind for energy production and water pumping in Iran, Saravan county, Distributed Generation & Alternative Energy Journal. (Accepted manuscript)
- A. Ataei, M. Biglari, M. Nedaei, E. Assareh, J-K. Choi, C. Yoo, M. S. Adaramola, Techno-economic feasibility study of autonomous hybrid wind and solar power systems for rural areas in Iran, A case study in Moheydar village. Environ. Prog. Sustainable Energy. 2015. doi: 10.1002/ep.12121
- Renewable Energy Organization of Iran, SUNA, available at www.suna.org.ir [accessed 20 July, 2013]
- Wikipedia, available at http://tinyurl.com/wikipedia-dehak (in Persian) [accessed 20 Aug, 2013]
- Wind Resource Assessment Software, Windographer, available at www.windographer.com [accessed 20 Oct, 2013]


