American Journal of Renewable and Sustainable Energy, Vol. 1, No. 2, July 2015 Publish Date: Jul. 16, 2015 Pages: 72-85
Evaluating of the Energy Consumption in Iran During 1980-2030 Using the Leap Model
Abtin Ataei1, *, Jun-Ki Choi2, Sara Shamshiri1, Hossein Torabi1, Mojtaba Nedaei1
1Department of Energy Engineering, Graduate School of the Environment and Energy, Science and Research Branch, Islamic Azad University, Tehran, Iran
2Department of Mechanical and Aerospace Engineering, University of Dayton, Dayton, Ohio, USA
Abstract
This paper evaluates the existing energy consumption of Iranian utility network in order to forecast the energy demand of the next 15 years. The primary energy and final energy demand in 2030 were simulated using the LEAP model based on the different viewpoints of economic development, energy efficiency and energy structure. This study considers three types of economic development scenarios including; baseline scenario (scenario A), rapidly changing development pattern scenario (scenario B) and risk scenario (scenario C). Moreover, two non-fossil energy capacity schemes were considered. Results indicated that the total energy consumption of Iran could be reached to 13000 Million Gigajoules in 2030. It became clear that the share of petroleum (and other petroleum products) in the consumption of energy would be decreased, while the natural gas and non-fossil energy sources would be increased. It was concluded that based on the scenario A, from 2010 to 2030, the emission of GHGs will increase from 113.4 to 176.3 Million Metric Tons CO2 Equivalent. However, through optimizing the energy consumption structure, increasing the energy saving and emission reduction efforts, the emissions in 2020 will only increase to 106.1 Million Metric Tons CO2 Equivalent.
Keywords
Energy Consumption, LEAP Model, Energy Demand, Energy Optimization
Received: June8, 2015
Accepted: June 21, 2015
Published online: July 15, 2015
@ 2015 The Authors. Published by American Institute of Science. This Open Access article is under the CC BY-NC license. http://creativecommons.org/licenses/by-nc/4.0/
1. Introduction
Nowadays energy has a key role in social-economic development of countries. World population growth beside economic development has increased the energy consumption. The energy consumption was increasing from 6630 million tons of oil equivalent (Mtoe) in 1980 to 12730.4 Mtoe in 2013 worldwide. This shows that the rate of energy consumption has been increased rapidly in recent years. It is estimated that the crude oil and natural gas reserves will be depleted in the next 41.8 and 60.3 years respectively.
Energy generation from fossil fuels is one of the important cause of greenhouse gas emissions and climate change. In order to control these effects, many methods have been suggested by scientists and researchers such as optimizing of energy consumption and using renewable energy sources. These methods are currently used by developed countries and it seems that the renewable energy will be the main energy sources for the world in the future.
The emission of carbon dioxide which is the major courses of greenhouse gas has increased significantly [1]. Fig. 1 shows the global total carbon dioxide emission from 1955 to 2015. As it is clear the concentration of atmospheric CO2 has reached to 403.226 ppm [2]. The depleting of fossil fuels reserves and the adverse effects of greenhouse gas emission on the climate are two factors that indicate the necessity of increasing the contribution of renewable and sustainable energy in energy consumption in Iran. Moreover, diversification of various energy resources is important in the power sector in Iran.
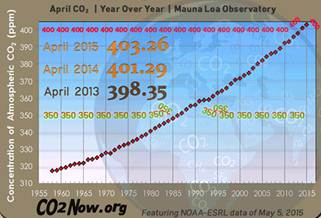
Fig. 1. Concentration of carbon dioxide from 1955 to 2015 [2].
Like many developing countries, industrialization in Iran has considerable effects on increasing energy consumption in the nation. It is estimated that the total primary energy supply reaches 1598.2 million barrels of oil equivalent in 2012. This is more than 65% increase from 2001 and it is considered high for developing countries [3].
Due to industrialization the final energy consumption has risen in the past decade in Iran. The final energy consumption has increased at an annual growth rate of 6.9% from 565.2 kg of oil equivalent in 1971 to 2,812.69 kg of oil equivalent in 2011 [3]. In the Fig. 2, the energy consumption per capita for Iran and seven other developing countries in the Middle East have been compared to each other. As can be seen the energy consumption of Iran has been increasing continuously since 1971. Additionally the total primary energy supply and final energy consumption of Iran during 2005 to 2012 is depicted in the Fig. 3 [3].
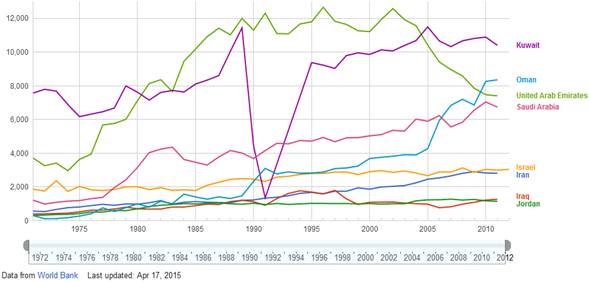
Fig. 2. Energy consumption per capita for eight developing countries in the Middle East.
Fig.4 indicates that the residential and commercial sector is the major energy consumption with 405.4 Mboe in 2012 and it is followed closely by the industry sector (303.7 Mboe). The energy consumption by residential and commercial sector has been decreased from 430.2 Mboe in 2011 to 405.4 in 2012. The main carriers of energy in this sector are natural gas by 71.5%, the petroleum products by 13.2%, electricity by 13.3%, renewable energy by 2% and coal by 0.001%, while for the industry sector, the energy carriers include natural gas by 73%, petroleum products by 13.1%, electricity by 13.9% and coal by 0.01%. The amount of energy consumption in the transportation sector has increased continuously with a record of 299.7Mboe in 2012.From the economical point of view, the transportation sector can be considered as the first place. Therefore, procedures to optimize fuel consumption is an important issue in this sector. This section contains the main energy carriers, Gasoline and other petroleum products by 85.4%, different types of gas by 14.6% and electricity by less than 0.01%.The fourth sector which contributes to the 4% of total energy consumption is the agricultural sector which includes sub-categories such as poultry, agriculture, floriculture, apiculture, mushrooms and etc. Petroleum gas is used as the main fuel in this section. The main parts of the energy consumption in this section are Petroleum products by 51%, natural gas by 10% and electricity by 39%. The remaining 11% of the total energy consumed in Iran is focused on other non-energy uses of petroleum products, other than products that are used as an energy carrier [3].
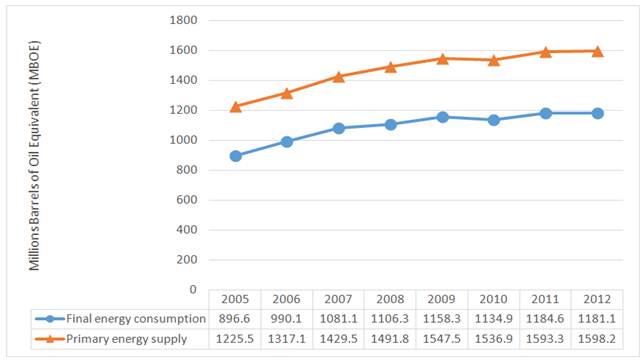
Fig. 3. Total primary energy supply and final energy consumption in Iran from 2005 – 2012.
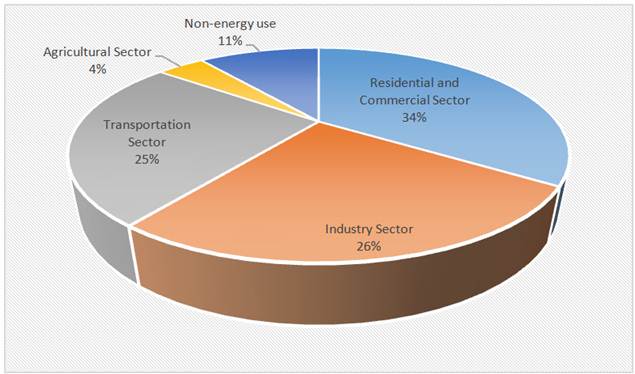
Fig. 4. The share of energy consumption in different sectors in Iran at the end of 2012.
In this study, the LEAP model was used for evaluating the energy consumption in Iran during 1980-2030. LEAP (Long-range Energy Alternative Planning) is a widely-used software tool for energy policy analysis and climate change mitigation assessment developed at the Stockholm Environment Institute (SEI). LEAP has been adopted by hundreds of organizations in more than 150 countries worldwide. Its users include government agencies, academics, non-governmental organizations, consulting companies and energy utilities. It has been used at many different scales ranging from cities and states to national, regional and global applications. The United Nations recently announced that more than 85 countries have chosen to use LEAP as part of their commitment to report to the U.N. Framework Convention on Climate Change (UNFCCC) [4].
LEAP has a considerable effect in shaping energy and environmental polices worldwide. For example in California, LEAP has been used for energy forecasting and identifying alternative fuels [5]. In Mexico it was employed to specify the feasibility of future scenarios based on moderate and high use of biofuels in the transportation and electricity generation sectors [6]. In Lebanon mitigation options were evaluated to decrease the emissions from electricity generation with emphasis on the usage of renewable energy resources [7]. The energy consumption and various types of emissions in consumption sectors in Iran were analyzed by using LEAP model [8]. Concerning the urban transportation, a research project was carried out in Kathmandu Valley, Nepal in 2005, to assess the emission of air pollutants, carbon dioxide (CO2) and energy used in the Kathmandu Valley [9]. Similarly, LEAP model has been employed to determine the total energy demand and the vehicular emissions for passenger transport in the city of Delhi [10]. In another research, Shabbir and Ahmad studied the energy demands and air pollutants resulted from transportation sector in Rawalpindi and Islamabad, Pakistan [11]. In that study, LEAP was used to predict the total energy demand and the vehicular emissions for the base year 2000 and extrapolated to 2030 for the future predictions. So far, LEAP has been successfully used in more than 150 countries throughout the world for different goals [12].
In this research, the LEAP’s model has been utilized to evaluate the energy consumption of Iran in order to forecast the energy demand of next 15 years.Fig.5shows the system frame work of the Iran LEAP model which is used in this study.
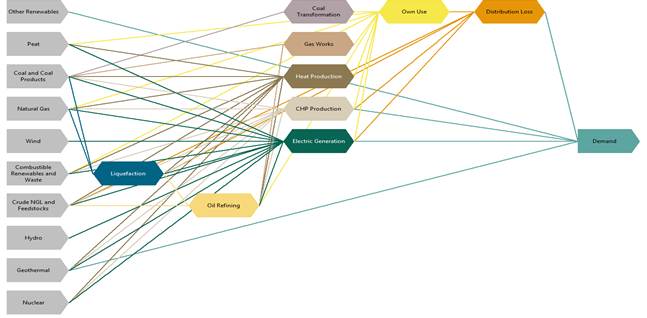
Fig. 5. Reference energy system diagram of Iran LEAP model.2.Methodology.
2. Methodology
In this paper the scenario analysis method is employed. Scenario analysis is a kind of multivariate analysis method, combined with the probability of occurrence of various possible scenarios set to study the possible impact of various factors when they work together at the same time. In the scenario analysis process, the interrelationships and interactions among various factors is importance to consider [12]. In this study, LEAP (Long-range Energy Alternatives Planning System) is used to analyse the energy demand and carbon emissions. LEAP is an econometric model developed by the Stockholm Environment Institute and Boston University. It can be used for analysis of the energy demand and the environmental impact analysis [13-34]. It’s a tool for creating models for different energy systems with specific structures. Both demand side and supply side of the energy system can be modelled in the LEAP to assess future energy demand and the need for capacity expansion. Furthermore, this model is able to handle energy, emissions and cost-benefit calculations from user-entered data. Another important feature of LEAP is its scenario-based nature. Scenarios can be created to simulate impacts of different policies on the energy system. This type of analysis makes it easier to compare different alternatives. LEAP is also an end-use model which requires an input of actual energy consumptions [35].
LEAP provides a lot of flexibility in how we structure our demand data. These can range from highly disaggregated end-use oriented structures to highly aggregate analyses. Typically a structure would consist of sectors including households, industry, transport, commerce and agriculture, each of which might be broken down into different subsectors, end-uses and fuel using devices. We can adapt the structure of the data to our purposes, based on the availability of data, the types of analyses we want to conduct, and our unit preferences. We can also create different levels of disaggregation in each sector.
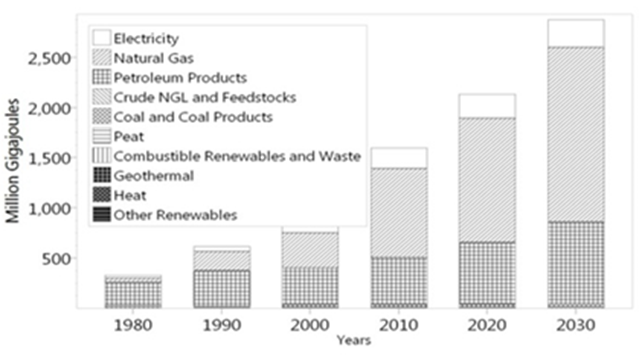
Fig. 6. Total expected energy demand for industry sector in scenario A.
When the LEAP software estimates a value for a specific variable at a particular scenario or region, the value of that variable is based on evaluating the expression defined for that branch, variable, scenario and region. LEAP employs a specified search method in order to look for these expressions. At each step in the search, LEAP looks to see if a non-blank expression has been explicitly entered. If a non-blank expression is detected, the search concludes successfully, and the expression is used to calculate a set of values for the currently active branch, variable, scenario and region. If no non-blank expression is found the search continues. The search method for the LEAP model consists of four steps:
Step 1: First LEAP looks in the current active scenario to see if an expression has been explicitly entered.
Step 2: Next, it looks in order through each of the additional scenarios. This allows scenarios to be made up of packages of other scenarios. For example, a mitigation scenario might consist of measures in the transport, industry and buildings sectors.
Step 3: Next for each of these additional scenarios, LEAP searches through any additional scenarios that these scenarios depend on. This allows the user to create "packages of packages" of scenarios. For example a transport scenario might itself consist of measures addressing cars, buses, rail, etc.
Step 4: Next if an expression still has not been detected, LEAP walks up the main scenario tree from the currently active scenario back to the Current Accounts data [12].
The current research aims to establish three kinds of economic development scenarios and two non-fossil energy installed capacity schemes: Three kinds of economic development scenarios include baseline scenario (scenario A), rapidly changing development pattern scenario (scenario B) and risk scenario (scenario C). In scenario A, Iran’s economy will continue the past trend, labor force will transfer steadily, scientific and technological progress will continue to develop, urbanization and industrialization will advance smoothly, the world economy will gradually recover, the employment rate will be relatively high, investment structure will be kept stable. In scenario B, economic growth pattern changes will make a progress, urbanization process and labour force which are moved from agriculture to non-agriculture, will accelerate, the tax burden on service industry will gradually reduce, fixed assets investment structure will be adjusted and electricity consumption efficiency will improve. In scenario C, economic and social development is affected by some harmful factors, urbanization process and labour force transfer will slow down, world economy will recover slowly, trade protection will become more serious, export growth as well as technological innovation and improvement of efficiency will be slower, and fixed asset investment structure adjustment will not be obvious.
2.1. Industrial Analysis
The industrial analysis in the scenario A illustrates the future demand of this sector. The total energy demand has started to grow since 2007 by 19.3%, while it is expected to reach to 2,871 Million Gigajoules (MG) cumulatively. It is estimated that there would be an increase of 2,542 MG in the scenario A during the fifty years, from 1980 to 2030.
Table 1. Total energy demand in industry sector (Unit: MG).
| Fuels | 1980 | 1990 | 2000 | 2010 | 2020 | 2030 |
| Electricity | 31.5 | 51.9 | 118 | 201.5 | 238.7 | 274.9 |
| Natural Gas | 39.2 | 191 | 351 | 888.8 | 1,235 | 1,736 |
| Petroleum Products | 236 | 356 | 365 | 469 | 615 | 812 |
| Coal and Coal Products | 21.7 | 13.3 | 24.7 | 25.7 | 30.4 | 35.0 |
| Combustible Renewables and Wastes | 1.3 | 4.3 | 8.3 | 9.9 | 11.8 | 13.5 |
| Total | 329 | 617 | 868 | 1,595 | 2,132 | 2,871 |
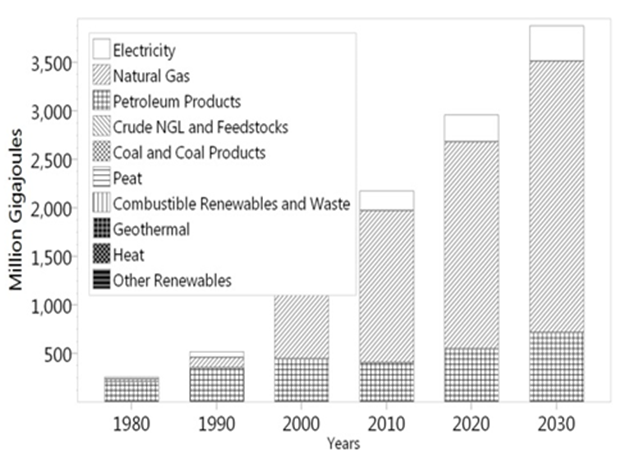
Fig. 7. Total expected energy demand for domestic and business sector in scenario A.
The results of the Scenario A is demonstrated in the Fig.6 and Table 1. The future energy demand in this scenario is expected to increase in 2030. Since the focus of the industrial sector is on natural gas with 1736 MG and by comparing the different scenarios, it can be seen that the results of scenarios B and C for natural gas seem to be better than scenario A. The results indicated 1736MG natural gas demand, 274.9 MG electricity demand in scenario (A) and the total energy demand for petroleum products sector will be 812 MG. The total energy demand of industry sector will reach to 2871 MG. It does not show a significant energy saving; however, the overall consumptions of the industry sector based on scenario (A) are drastically more than the other sectors.
2.2. Domestic and Business Analysis
A large amount of energy wasted in this section is related to the basic techniques and methods of building energy consumer devices. The serious solutions to optimize energy consumption in buildings such as the use of thermal insulation, installation of double glazed windows, doors and windows are essential facts [36,37].
Table 2. Total energy demand in domestic and business sector (Unit: MG).
| Fuels | 1980 | 1990 | 2000 | 2010 | 2020 | 2030 |
| Electricity | 19.7 | 62 | 112 | 202 | 274 | 359 |
| Natural Gas | 28.2 | 109 | 685 | 1,574 | 2,140 | 2,802 |
| Petroleum Products | 211 | 350 | 448.7 | 402 | 546.9 | 715.9 |
| Coal and Coal Products | - | - | 0.8 | 0.4 | 0.5 | 0.7 |
| Total | 259 | 522 | 1,247 | 2,178 | 2,962 | 3,878 |
Total energy demand for the domestic and business sector (as seen in Fig. 7, Table 2) is expected to reach 3878 MG in scenario A and cumulatively there would be an increase of 259 MG to 3878 MG from 1980 to 2030.The result shows that the natural gas demand in this sector will increase more than the demand of other sources of energy. Furthermore the petroleum products and electricity follow the natural gas.
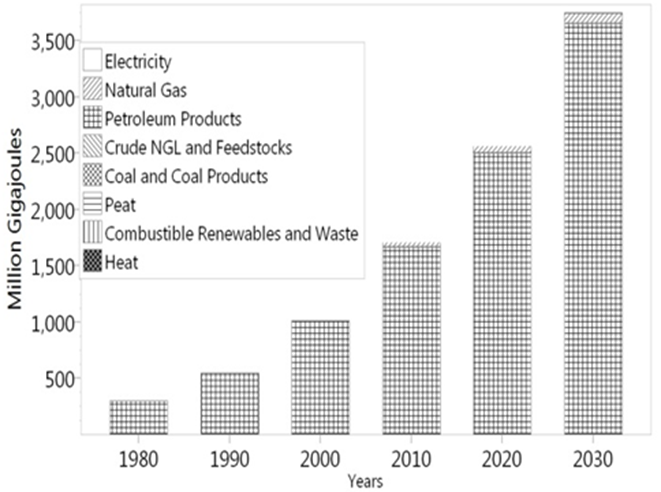
Fig. 8. Total expected energy demand for transportation sector in scenario A.
2.3. Transportation Analysis
Patterns of energy use in the transportation are more difficult to interpret in the developing and transitional regions, due to the lack of the most basic information [38]. In particular, there are few reliable data describing vehicle fuel economy and vehicle load factors in developing countries [39]. Based on scenario A, the contribution of total energy demand in this sector among all sectors would be 3%in 2030. Total energy demand of transportation sector would reach to 3746 MG in 2030. Petroleum and other products would reach to 3651 MG, as seen inFig.8, Table 3. The results of the scenario A shows that by 2030, in the transportation sector, petroleum and other petroleum products have the major share of the total energy demand and the second largest share is for natural gas. It should be noted that natural gas has been used in the transportation system of Iran in a large scale since 2006.
Table 3. Total energy demand in the transportation sector (Unit: MG).
| Fuels | 1980 | 1990 | 2000 | 2010 | 2020 | 2030 |
| Electricity | - | - | - | 0.7 | 1.0 | 1.4 |
| Natural Gas | - | - | 0.1 | 42.6 | 63.9 | 93.3 |
| Petroleum Products | 298 | 545.5 | 1,014 | 1,665 | 2,501 | 3,650 |
| Total | 298 | 545.5 | 1,014 | 1,709 | 2,566 | 3,745 |
About the road transportation, it should be note that while the road transportation has been firmly established in the industrialized countries as the mode choice, roads for fleet vehicles are growing rapidly in the developing countries.
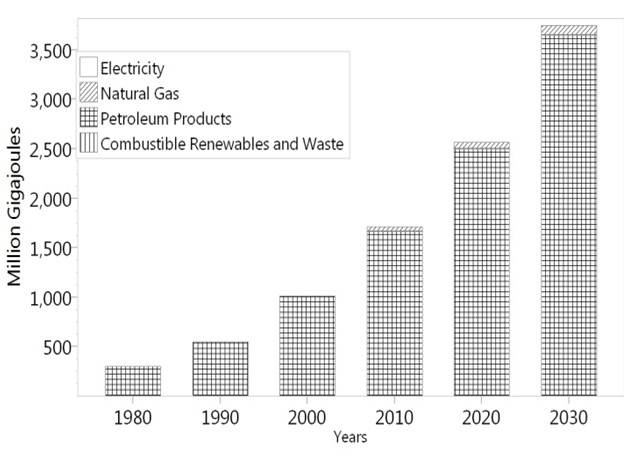
Fig. 9. Total expected energy demand for road transportation sector in scenario A.
Table 4. Total energy demand in road transportation (Unit: MG).
| Fuels | 1980 | 1990 | 2000 | 2010 | 2020 | 2030 |
| Natural Gas | - | - | 0.1 | 42.6 | 63.9 | 93.3 |
| Petroleum Products | 298 | 545 | 1,014 | 1,665 | 2,501 | 3,650 |
| Total | 298 | 545 | 1,014 | 1,708 | 2,565 | 3,744 |
According to the LEAP model, fuel consumption for road transportation is expected to reach to 3744 MG in 2030. It is important to note that in Iran the most important fuel sources for transportation are petroleum and petroleum products. It should also be mentioned that natural gas is predicted to be 93 MG by 2030. (As seen in Fig. 9 and Table 4).
Concerns over high levels of urban air pollution and the high import costs of transportation fuels have received the attention of many organizations and policy makers to develop alternative transportation fuel sources.
2.4. Agriculture Analysis
Despite the relative importance of this sector for economic viability and employment in the developing countries, the utilization of energy for agricultural sector is less than the industry and transportation sectors [22]. The energy consumption in agriculture which includes activities in farming, livestock and forestry systems, reflects the use of aggregation of fuels (especially, fossil fuels and electricity) consumed at the end-use, e.g., for field operations, irrigation, drying and so on. Relatively small amount of energy is used directly in the agricultural sector (perhaps 5 to 8 percent of the total national energy in developing countries such as Iran). With this explanation, energy used in the agricultural sector accounts for about 3% of world final energy consumption [23]. Energy demand in agricultural sector is based on electricity and natural gas petroleum products.
Table 5. Total energy demand for agricultural sector (Unit: MG).
| Fuels | 1980 | 1990 | 2000 | 2010 | 2020 | 2030 |
| Electricity | 2.5 | 13.4 | 32.9 | 76.6 | 129 | 214 |
| Natural Gas | - | - | - | 7.5 | 12.7 | 21.0 |
| Petroleum Products | 73.4 | 162 | 149 | 183 | 311 | 513 |
| Total | 75.9 | 175 | 182 | 268 | 454 | 748 |
It is estimated that the electricity consumption from 2.5 MG in 1980 will reach to 214 MG in 2030. Natural gas demand which has been consumed in the agricultural sector since 2010, is expected to increase to 21 MG by end of 2030. The demand of petroleum products is predicted to be 513.7 MG and the total energy consumption based on scenario A in this sector would reach to 748.8 MG, as seen in Fig. 10 and Table 5.
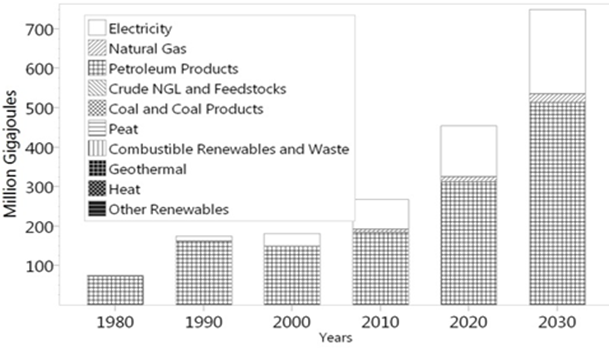
Fig. 10. Total expected energy demand for agricultural sector in scenario A.
3. Results and Discussion
In this study, the demand for energy in Iran from 1980 to 2030 was analyzed and predicted as a LEAP model based on the three studied scenarios; A, B and C. Although scenarios B and C predicted less energy demand, the scenario A predicted that the economic situation of Iran will continue the past trend. Furthermore, the labor force will transfer steadily, the science and technology will continue to develop, urbanization and industrialization will advance smoothly, the world economy will gradually recover, the employment rate will be relatively high, and investment tendency will be kept stable. Figs. 11 and 12 compare the three studied scenarios. As shown in Fig.11 and Table 6, Iran’s energy demand is estimated up to 13000 MG for various energy sources by year of 2030 in the scenario A. Based on the proposed actions described in the previous section, the energy demand could be reduced by 4.3% in the scenario B compared to that of the scenario A in 2030.
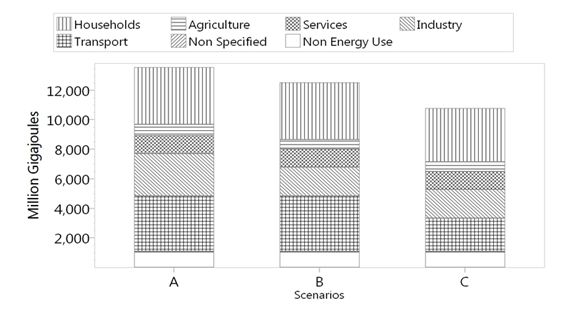
Fig. 11. Comparison of the results of the three studied scenarios (A, B andC).
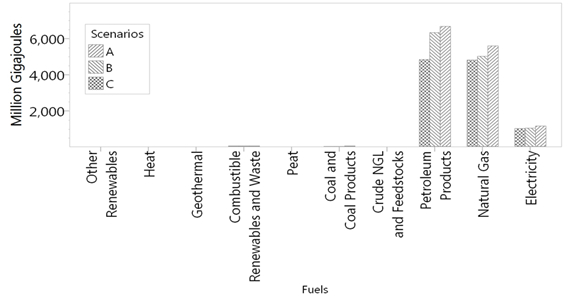
Fig. 12. Total expected energy consumption by fuel types in all scenarios.
Table 6. Comparison of energy savings between three studied scenarios (scenarios A, B and C).
| Fuels | A | B | C | Total |
| Electricity | 1,154 | 1,165 | 1,143 | 3,463 |
| Natural Gas | 5,611 | 5,056 | 4,849 | 15,518 |
| Petroleum Products | 6,693 | 6,669 | 5,166 | 18,529 |
| Coal and Coal Products | 35 | 24 | 24 | 85.0 |
| Combustible Renewables and Waste | 55.2 | 50.8 | 50.8 | 156.7 |
| Total | 13,551 | 12,967 | 11,234 | 37,753 |
Moreover, the reduction would be achieved by 17% when intensive countermeasures are implemented in the scenario C in 2030.
It can be seen that more energy savings can be obtained at the end of the planning period since all countermeasures require a long period of time to be introduced to the transportation system. Additionally more time is required to eliminate the traditional inefficient technologies.
According to Table 6, the scenario C provides 2317 MG more energy saving than the scenario A, while for the scenario B an energy saving of 584 MG compared to the scenario A is predicted. However it has been shown that the scenario A has a higher efficiency rate of growing compared to other scenarios.
3.1. Energy Consumption
On the whole, energy consumption based on each scenario will increase, but their growth rates are different. As seen in Table 7 in 2016, the energy consumption will be between 169.8-202.4 million tons, the energy consumption of the domestic, industry and transport department will respectively account for 31%, 22% and 26%. It is estimated that in 2020, the energy consumption of Iran will be about 194-232 million tons, the domestic department will be decreased by 30%, additionally the industry department will be decreased by 21%, while the transportation department will be increased up to 27%.
Table 7. Energy consumption of Iran based on the studied scenarios from 2016 to 2030.
| Years | 2030 | 2020 | 2016 | ||||||
| Scenarios | A | B | C | A | B | C | A | B | C |
| Domestic | 92.6 | 92.6 | 87.0 | 70.8 | 70.8 | 68.7 | 62.7 | 62.7 | 61.7 |
| Agriculture | 17.9 | 15.7 | 15.7 | 10.9 | 9.6 | 9.6 | 8.9 | 7.8 | 7.8 |
| Services | 28.9 | 28.9 | 28.9 | 19.5 | 19.5 | 19.5 | 16.6 | 16.6 | 16.6 |
| Industry | 68.6 | 46.3 | 46.3 | 50.9 | 34.4 | 34.4 | 45.5 | 30.7 | 30.7 |
| Transport | 89.5 | 89.5 | 53.7 | 61.3 | 61.3 | 36.8 | 52.5 | 52.5 | 31.5 |
| Non Specified | 1.6 | 1.6 | 1.6 | 1.4 | 1.4 | 1.4 | 1.3 | 1.3 | 1.3 |
| Non Energy Use | 24.6 | 24.6 | 24.6 | 17.3 | 17.3 | 17.3 | 15.0 | 15.0 | 15.0 |
| Total | 323.7 | 299.2 | 257.8 | 232 | 214.2 | 187.6 | 202 | 186.5 | 164.5 |
Units: Million Tons of Oil Equivalents
Table 8. Predicted emissions of the main air pollutants and GHGs based on the three scenarios.
| Years | 2030 | 2020 | 2016 | ||||||
| Scenarios | A | B | C | A | B | C | A | B | C |
| Domestic | 209.9 | 209.9 | 197.2 | 160.3 | 160.3 | 155.7 | 142.0 | 142.0 | 139.8 |
| Agriculture | 38.9 | 34.2 | 34.2 | 23.6 | 20.8 | 20.8 | 19.2 | 16.9 | 16.9 |
| Services | 59.6 | 59.6 | 59.6 | 40.3 | 40.3 | 40.3 | 34.3 | 34.3 | 34.3 |
| Industry | 159.9 | 107.9 | 107.9 | 117.1 | 79.0 | 79.0 | 104.0 | 70.2 | 70.2 |
| Transport | 261.0 | 261.0 | 156.6 | 178.8 | 178.8 | 107.3 | 153.1 | 153.1 | 91.9 |
| Non Specified | 0.1 | 0.1 | 0.1 | 0.1 | 0.1 | 0.1 | 0.1 | 0.1 | 0.1 |
| Total | 729.3 | 672.7 | 555.6 | 520.2 | 479.3 | 403.1 | 452.8 | 416.7 | 353.2 |
Units: Million Metric Tons CO2 Equivalent
Table 9. Twenty Years Global Warming Potential.
| Years | 2030 | 2020 | 2016 | ||||||
| Scenarios | A | B | C | A | B | C | A | B | C |
| Carbon Dioxide Biogenic | 6.0 | 5.6 | 5.6 | 5.1 | 4.7 | 4.7 | 4.8 | 4.4 | 4.4 |
| Carbon Dioxide Non Biogenic | 720.4 | 686.6 | 571.8 | 513.9 | 486.9 | 412.3 | 447.3 | 422.6 | 360.4 |
| Carbon Monoxide | 29.7 | 29.7 | 18.0 | 20.4 | 20.4 | 12.4 | 17.5 | 17.5 | 10.6 |
| Non Methane Volatile Organic Compounds | 5.5 | 5.5 | 3.3 | 3.8 | 3.8 | 2.3 | 3.2 | 3.2 | 2.0 |
| Nitrogen Oxides | 3.0 | 2.9 | 2.0 | 2.1 | 2.0 | 1.4 | 1.8 | 1.7 | 1.2 |
| Sulfur Dioxide | 0.1 | 0.1 | 0.1 | 0.1 | 0.1 | 0.1 | 0.1 | 0.1 | 0.1 |
| Total | 764.9 | 730.5 | 600.9 | 545.5 | 518.0 | 433.2 | 474.9 | 449.6 | 378.7 |
Units: Million Metric Tons CO2 Equivalent
Table 10. Predicted emissions of the chief air pollutants and GHGs for different sectors.
| Scenario | A | |||||
| Sectors | Non Specified | Transport | Industry | Services | Agriculture | Households |
| Carbon Dioxide Biogenic | 4.5612 | - | 1.4841 | - | - | - |
| Carbon Dioxide Non Biogenic | - | 255.5 | 159.0 | 59.1 | 38.4 | 208.3 |
| Carbon Monoxide | 0.1665 | 29.2433 | 0.1196 | 0.0336 | 0.0113 | 0.1558 |
| Methane | 0.0012 | 0.0777 | 0.0111 | 0.0068 | 0.0052 | 0.0214 |
| Non Methane Volatile Organic Compounds | 0.0021 | 5.4766 | 0.0141 | 0.0047 | 0.0027 | 0.0177 |
| Nitrogen Oxides | 0.0042 | 2.2465 | 0.4347 | 0.0680 | 0.0524 | 0.2118 |
| Nitrous Oxide | 0.0002 | 0.0022 | 0.0008 | 0.0003 | 0.0003 | 0.0007 |
| Sulfur Dioxide | - | 0.0651 | 0.0479 | 0.0077 | 0.0092 | 0.0134 |
| Total | 4.7354 | 292.6124 | 161.1331 | 59.2034 | 38.5205 | 208.7381 |
Units: Million Metric Tons
3.2. Air Pollutants and GHG Emission
a) GHG emissions reduction:
Energy consumption and air pollution, greenhouse gas (GHG) emissions are closely related. Motor vehicles emit GHGs. In vehicles, the principal GHG is carbon dioxide but vehicles also produce nitrous oxide and methane, which contribute to the climate change. As it is clear when clean energy is more used inthe transport and industry sector, the GHG emissions will obviously be reduced [40-44]. Based on the scenario A, from 2010 to 2030, the emissions of GHGs will increase from 113.4 to 176.3 Million Metric Tons CO2 Equivalent. However through optimizing energy consumption structure, increasing the energy saving and emission reduction efforts, the emissions in 2020 will only increase to 106.1 Million Metric Tons CO2 Equivalent (as shown in Table 8 and 9).
b) The emission reduction of other pollutants:
The emissions of SOx will be reduced through energy replacement in the industry sector [40-42]. Furthermore the emissions of NOx in the transportation sector will account for around 74.4% of the total emission of NOx in Iran. Additionally the emissions of NOx will be reduced through increasing the public transport ratio and motor vehicle emission standard, at the same time, low-energy and low-emission technologies and new energy vehicles must be adopted (as shown in Table 10).
4. Conclusion
In this research, the LEAP’s model was utilized to evaluate the Iran’s energy consumption in order to forecast the energy demand of the next 15 years. For this purpose, three types of economic development scenarios were taken into account, including; baseline scenario (scenario A), rapidly changing development pattern scenario (scenario B) and risk scenario (scenario C). Moreover, two non-fossil energy capacity schemes were utilized. Although scenarios B and C predicted less demand of energy, the scenario A predicted that the economic situation of Iran will continue the past trend.
According to results, it was concluded that the emission reduction can be obtained by optimizing the energy consumption structure in a correct way. The increase in energy consumption mostly comes from the industry sector, transport and domestic sectors. The energy demand of these three sectors will be responsible for 77% of total energy demand. The energy consumption structure of the main sectors needs to be optimized. In addition to that, the use of clean energy should be promoted. Based on the different scenarios, the emissions of pollutants and GHGs will be reduced through increasing the energy savings and optimizing the energy consumption structure. In 2020, the energy demand will be reduced by 8% and 22.5% based on the scenarios B and C, respectively. The emissions of SOx in 2015 based on scenarios B and C will be reduced to 0.081 and 0.065 million metric tons, respectively. Furthermore, emissions of NOx in 2015 based on the scenarios B and C will be reduced to 1.7 and 1.2 million metric tons. By comparing these values with the predicted values in scenario A, it would be seen that the ratio will be reduced by 90%, 70%, 86% and 69%, respectively. By improving and correcting the energy consumption structure, the emissions of GHG under scenarios "B and C" could be reduced by 56.48 and 172.23 Million Metric Tons compared to scenario A. During and after the following 15years, the emphasis should be on controlling the pollutants and tackling the climate change from regulating the energy consumption respectively.
References
- Mohammadnejad, M., Ghazvini, M., Mahlia, T. M. I., & Andriyana, A. (2011). A review on energy scenario and sustainable energy in Iran. Renewable and Sustainable Energy Reviews, 15(9), 4652-4658.
- CO2 Now available at http://CO2now.org Accessed Jun, 2015.
- Energy balance 2012. Tehran: Iran Ministry of Power; Accessed Jun, 2015.
- Khan, S. I., Islam, A., & Khan, A. H. (2011). Energy Forecasting of Bangladesh in Gas Sector Using LEAP Software. Global Journal of Researches in Engineering, 11(1).
- Ghanadan, R., & Koomey, J. G. (2005). Using energy scenarios to explore alternative energy pathways in California.Energy Policy, 33(9), 1117-1142.
- Islas, J., Manzini, F., & Masera, O. (2007). A prospective study of bioenergy use in Mexico. Energy, 32(12), 2306-2320.
- El-Fadel, M., Chedid, R., Zeinati, M., & Hmaidan, W. (2003). Mitigating energy-related GHG emissions through renewable energy. Renewable Energy, 28(8), 1257-1276.
- Avami, A., & Farahmandpour, B. (2008).Analysis of environmental emissions and greenhouse gases in Islamic Republic of Iran. International Institute for Energy Studies (IIES), 4(4).
- Dhakal, S. (2006). Urban transportation and the environment in Kathmandu Valley, Nepal: Integrating global carbon concerns into local air pollution management. Institute for Global Environmental Strategies.
- Bose, R. K. (1996). Energy demand and environmental implications in urban transport—case of Delhi. Atmospheric Environment, 30(3), 403-412.
- Shabbir, R., & Ahmad, S. S. (2010). Monitoring urban transport air pollution and energy demand in Rawalpindi and Islamabad using leap model. Energy, 35(5), 2323-2332.
- Long range energy alternatives planning system. Boston: SEI-Stockholm Environment Institute, Tellus Institute; 2008.
- Ghanadan, R., & Koomey, J. G. (2005). Using energy scenarios to explore alternative energy pathways in California. Energy Policy, 33(9), 1117-1142.
- Islas, J., Manzini, F., & Masera, O. (2007). A prospective study of bioenergy use in Mexico. Energy, 32(12), 2306-2320.
- El-Fadel, M., Chedid, R., Zeinati, M., & Hmaidan, W. (2003). Mitigating energy-related GHG emissions through renewable energy. Renewable Energy, 28(8), 1257-1276.
- Avami, A., & Farahmandpour, B. (2008).Analysis of environmental emissions and greenhouse gases in Islamic Republic of Iran. International Institute for Energy Studies (IIES), 4(4).
- Institute for Global Environmental Strategies. Urban transportation and environment in Kathmandu valley, Nepal. Integrating global carbon concerns into local air pollution management. Japan: Institute for Global Environmental Strategies; 2006.
- Wang T., Mantha D., and Reddy R. G., 2013, "Novel low melting point quaternary eutectic system for solar thermal energy storage," Applied Energy, 102, pp. 1422–1429.
- Park N.-B., Yun S.-J., and Jeon E.-C., 2013, "An analysis of long-term scenarios for the transition to renewable energy in the Korean electricity sector," Energy Policy, 52, pp. 288–296.
- Kale R. V., and Pohekar S. D., 2014, "Electricity demand and supply scenarios for Maharashtra (India) for 2030: An application of long range energy alternatives planning," Energy Policy, 72, pp. 1–13.
- Ahanchian M., Bienvenido J., and Biona M., 2013, "Energy demand, emissions forecasts and mitigation strategies modeled over a medium-range horizon : The case of the land transportation sector in Metro Manila," Energy Policy, pp. 1–15.
- Shin H.-C., Park J.-W., Kim H.-S., and Shin E.-S., 2005, "Environmental and economic assessment of landfill gas electricity generation in Korea using LEAP model," Energy Policy, 33(10), pp. 1261–1270.
- Song H.-J., Lee S., Maken S., Ahn S.-W., Park J.-W., Min B., and Koh W., 2007, "Environmental and economic assessment of the chemical absorption process in Korea using the LEAP model," Energy Policy, 35(10), pp. 5109–5116.
- Mondal M. A. H., Boie W., and Denich M., 2010, "Future demand scenarios of Bangladesh power sector," Energy Policy, 38(11), pp. 7416–7426.
- Malla S., 2013, "Household energy consumption patterns and its environmental implications: Assessment of energy access and poverty in Nepal," Energy Policy, 61, pp. 990–1002.
- Lee S., Park J.-W., Song H.-J., Maken S., and Filburn T., 2008, "Implication of CO2 capture technologies options in electricity generation in Korea," Energy Policy, 36(1), pp. 326–334.
- McPherson M., and Karney B., 2014, "Long-term scenario alternatives and their implications: LEAP model application of Panama׳s electricity sector," Energy Policy, 68, pp. 146–157.
- Bose R. K., and Srinivasachary V., 1997, "Policies to reduce energy use and environmental emissions in the transport sector," Energy Policy, 25(14-15), pp. 1137–1150.
- Wang Y., Gu A., and Zhang A., 2011, "Recent development of energy supply and demand in China, and energy sector prospects through 2030," Energy Policy, 39(11), pp. 6745–6759.
- Cai W., Wang C., Wang K., Zhang Y., and Chen J., 2007, "Scenario analysis on CO2 emissions reduction potential in China’s electricity sector," Energy Policy, 35(12), pp. 6445–6456.
- Wang K., Wang C., Lu X., and Chen J., 2007, "Scenario analysis on CO2 emissions reduction potential in China’s iron and steel industry," Energy Policy, 35(4), pp. 2320–2335.
- Rahmadi A., Aye L., and Moore G., 2013, "The feasibility and implications for conventional liquid fossil fuel of the Indonesian biofuel target in 2025," Energy Policy, 61, pp. 12–21.
- Dias M. V. X., Haddad J., Horta Nogueira L., Costa Bortoni E. Da, Passos da Cruz R. A., Akira Yamachita R., and Goncalves J. L., 2014, "The impact on electricity demand and emissions due to the introduction of electric cars in the São Paulo Power System," Energy Policy, 65, pp. 298–304.
- Pan L. J., Xie Y. B., and Li W., 2013, "An Analysis of Emission Reduction of Chief Air Pollutants and Greenhouse Gases in Beijing based on the LEAP Model," Procedia Environmental Sciences, 18, pp. 347–352.
- Kongwanarat N., and Limmeechokchai B., "Sustainable Rural Electrification in Thailand : Analyses of Energy Consumption and CO 2 Emissions," (March 2014), pp. 19–21.
- Institute for International Energy Studies, "Iran's Hydrocarbons Energy Balance 2009", Ministry of oil and gas, 2009.
- Annual Report of Iran's CNG National Project", Iranian Fuel Conservation Organization, 2009.
- Heaps, C., E. Kemp-Benedict and P. Ruskin. 1998. Conventional Worlds: Technical Description of Bending the Curve Scenarios. Pole Star Series Report no. 9.
- Lazarus, M., E. Hansen and D. Hill. 1997. Scenarios of energy and agriculture in Africa. Chapter 4 in Future Energy Requirements for Africa's Agriculture, Food and Agricultural Organization.
- Sathaye, J., and S. Meyers. 1996. Greenhouse Gas Mitigation Assessment: A Guidebook. Kluwer, Boston.
- Van Den Berg, M., A. F. Hof, J. Vliet, D. P van Vuuren. 2015. Impact of the choice of emission metric on greenhouse gas abatement and costs, Environmental Research Letters, 10 024001.
- Henderson, B. B., P. J. Gerber, T.E. Hilinski, A. Falcucci, D.S. Ojima, M. Salvatore, R. T. Conant. 2015. Greenhouse gas mitigation potential of the world’s grazing lands: Modelling soil carbon and nitrogen fluxes of mitigation practices,Agriculture, Ecosystems & Environment, 207(1): 91–100.
- Gallagher, J.,D. Styles, A. McNabola, A. P. Williams. 2015. Life cycle environmental balance and greenhouse gas mitigation potential of micro-hydropower energy recovery in the water industry, Journal of Cleaner Production, 99(15): 152–159.
- Vibart, R.,I. Vogeler, S. Dennis, W. Kaye-Blake, R. Monaghan, V. Burggraafe, J. Beautrais, A. Mackay.2015. A regional assessment of the cost and effectiveness of mitigation measures for reducing nutrient losses to water and greenhouse gas emissions to air from pastoral farms, Journal of Environmental Management, 156: 276–289.


