
International Journal of Modern Physics and Applications, Vol. 1, No. 3, July 2015 Publish Date: Jun. 24, 2015 Pages: 52-63
Harmonic Analysis of the Critical Frequency of the E and F2 Layers During Some Epochs of Solar Cycle at Ibadan
Onori E. O.*, Somoye E. O., Ogungbe A. S., Ogabi C. O., Ogwala A.
Department of Physics, Lagos State University, Ojo, Lagos, Nigeria
Abstract
Harmonic analysis of the response of the critical frequency of the E and F2 layers to solar activity during year of maximum, moderate and minimum solar activity 1958, 1973 and 1965 respectively at Ibadan (7.400N, 3.900E, 60S dip) are studied. The critical frequencies of the E and F2 layers (foE and foF2) were use as ionospheric parameters for the E and F2 layers while Zurich sunspot number (Rz) was used as index of solar activity in this work. The monthly mean values of the critical frequency of the E and F2 layer were computed and harmonic analysis carried out on the data. The critical frequency of the E layer is found to respond more rapidly to solar activity than that of the F2 layer. The first harmonic of diurnal variation of foE and foF2 always predominate other harmonics for the three years under investigation, confirming diurnal variation.
Keywords
Critical Frequency of E Layer (foE), Critical Frequency of F2 Layer (foF2), Sunspot Number (Rz), Harmonic Analysis
Received:April 9, 2015
Accepted: May 3, 2015
Published online: June 23, 2015
@ 2015 The Authors. Published by American Institute of Science. This Open Access article is under the CC BY-NC license. http://creativecommons.org/licenses/by-nc/4.0/
1. Introduction
Solar activity has a major influence on the characteristics of the upper atmosphere of the earth. For instance the critical frequency of the E and F2 layer of the ionosphere foE and foF2 respectively are found to vary regularly with solar activity indexed by the Zurich sunspot number (Rz). Almost all interesting features of solar activity are linked more or less directly to the appearance of sunspots (Kelly, 1989). The appearance of sunspots on the sun is unpredictable, but their number increases and decreases over a period of eleven years. The periodicity of the sunspots has ignited scientific interest and many efforts have been made to correlate all sorts of terrestrial phenomena with the spots. According to Okunola (1984) and Somoye (1984), as the sunspot number approaches a maximum the ionosphere becomes denser in direct correlation with the Zurich Sunspot number Rz which is greatest at the year of sunspot maximum and least at year of sunspot minimum.
Harmonic analysis also called Fourier analysis is the branch of physics that studies the representation of functions or signals as the superposition of basic waves. It investigates and generalize the notions of Fourier series. The basic waves are called harmonics in physics hence the name Harmonic analysis (Yitzhak, 2004). In this study, harmonic analysis is used to analyse the diurnal variation of the critical frequency of the F2 and E layers for year of solar maximum (1958), year of solar moderate (1973) and year of solar minimum (1965).
2. Method and Analysis of Data
The data for this study were obtained from the monthly bulletins of Ionospheric station at Ibadan (7.40oN, 3.90oE, 6oS dip). The critical frequencies of the E and F2-layers (foE and foF2) are used as Ionospheric parameters while Zurich sunspot number (Rz) was used as the index of solar activity.
The theory basically deals with data which gives a sinusoidal or a perfect sine curve of known period L when analyzed. The main aim of the theory is to determine the amplitude A and Phase difference ф of each sinusoid with respect to the fact that the data consist of only sine curves with known period L and it’s submultiples of L. The general form of the theory is given as
![]() 1
1
or
![]()
where
![]() is the first harmonic of period L
is the first harmonic of period L
![]() is the second harmonic of period L
is the second harmonic of period L
![]() is the thirdharmonic of period L
is the thirdharmonic of period L
![]() is the nth harmonic of period L
is the nth harmonic of period L
Let ![]() and
and ![]() be the components of the first harmonic,
be the components of the first harmonic,![]() and
and ![]() be the component of the second harmonic and
be the component of the second harmonic and ![]() and
and ![]() be the component of the third harmonic and
be the component of the third harmonic and ![]() and
and ![]() be the component of the nth harmonic.
be the component of the nth harmonic.
Also let ![]() represent
represent ![]() hence equation 1 is re-written as
hence equation 1 is re-written as
![]() 2
2
Truncating equation 2 after the 2nd harmonic gives
![]() 3
3
Assuming there are ![]() terms in the series such as
terms in the series such as ![]() (t=0,1,2............
(t=0,1,2............![]() and multiplying these terms in turns by
and multiplying these terms in turns by ![]() ,
,![]() ------------------
------------------![]() and adding up the t products, then we shall be left with
and adding up the t products, then we shall be left with ![]() that is
that is ![]()
![]() Making
Making ![]() the subject we have
the subject we have ![]() 4a
4a
Equation 4a gives the 1st component of i.e. first harmonic. Therefore that of the first component of the nth harmonic an is given as
![]() 4b
4b
Similarly by multiplying each term in the series by ![]() and then add up the L products again gives
and then add up the L products again gives ![]() that is
that is ![]() .
.
Making ![]() the subject we have
the subject we have
![]() 5a
5a
Equation 5a gives the 2nd component of the first harmonic. Thus the second component of the nth harmonic ![]() is given as
is given as
![]() 5b
5b
When ![]() have been computed, then the values of amplitude A, the phase difference
have been computed, then the values of amplitude A, the phase difference ![]() ,are calculated as follows
,are calculated as follows
![]() ,
, ![]() first harmonic
first harmonic
![]() ,
, ![]() second harmonic
second harmonic
Similarly,
![]() ,
, ![]() nth harmonic
nth harmonic
These values of Amplitudes and phase difference are then substituted into equation 1 to give
![]() 6a
6a
Where ![]()
or
![]() 6b
6b
Where ![]()
Since Frequency ![]() thus
thus
![]() 7
7
The various components of the Harmonic equation: a1,b1, a2,b2.............a4,b4, amplitude A and Phase difference ф were computed using Ms-excel 2007 spread sheet computer software. This was done by first writing a complex program of the harmonic equation in Ms-excel spreadsheet.
The mean monthly hourly values of foE and foF2 which serve as input data were inputted into the written program in Ms-excel language and the result of the various components and harmonics were automatically computed and displayed at the various outputs.
Diurnal and Semi diurnal effects were investigated by plotting the values of the first, second, third and fourth harmonics obtained against time of the day in hours to show clearly their variations and comparison. Diurnal variation of the normal curves was also obtained by plotting the mean monthly hourly values of foE and foF2 against local time (LT) in hours.
3. Results and Discussion
The normal curve of diurnal variation of foF2 against LT for 1958 showed that the critical frequency of the F2 layer has two unequal peaks which occurred between 08:00 and 19:00 hours and between 16:00 and 22:00 hours. The higher peak occurs earlier for most of the months except in February as seen in Figure 1. The first harmonic i.e. diurnal component of foF2 predominates the second, third and fourth harmonics of all the months of 1958. See Figure 4 (i) to (xii).
In Figure 2 below, the normal curve of diurnal variation of foF2 shows that the critical frequency of the F2 layer for 1973 has two unequal peaks also which occurred between 06:00 and 13:00 hours and between 14:00 and 20:00 hours indicating a diurnal variation of foF2. The first harmonic i.e. diurnal component of foF2 predominates the second, third and fourth harmonics of all the months of 1973 also {Figure 5 (i) to (xii)}.
During 1965, the normal curve of diurnal variation of foF2 showed that the critical frequency of the F2 layer also has two unequal peaks which occurred between 06:00 and 10:00 hours and between 15:00 and 20:00 hours. This also suggests diurnal variation of foF2. See Figure 3. The first harmonic i.e. diurnal component of foF2 predominates the second, third and fourth harmonics of all the months of 1965. Figure 6 (i) to (xii).
The two unequal peaks observed in the diurnal variation of foF2 are due to the effect of noon bite out. This effect is also revealed in the work of Akala et al., (2010) on variability of foF2 in the African equatorial ionosphere where foF2 is more susceptible to variability during the night time than day time and the work of Somoye (2009) on Comparison of NmF2 Variability at Ibadan, Singapore and Slough during different Epochs of Solar cycle also showed similar effect. NmF2, peak electron concentration of F2 layer is proportional to the square of foF2.
From the normal curve of diurnal variation of foE in Figure 7, it can be seen that the diurnal variation curve of foE during 1958 are all symmetric and have their maximum peak values at 12:00 noon of each month throughout the year indicating that the E layer is a Chapman layer. This result agrees with the work of Okunola (1984) on ‘Sporadic E Ionisation at Ibadan’ in which he found foE to peak around noon. The first harmonic i.e. diurnal component of foE predominates the second, third and fourth harmonics of all the months of 1958. See Figure 10 (i) to (xii).
The normal curve of diurnal variation of foE during 1973 illustrated in Figure 8 shows symmetric characteristics and attain maximum peak at 12:00 noon of each month of the year. This again confirms that the E layer at Ibadan is a Chapman layer during moderate solar activity. Harmonic analysis carried out on the foE during 1973 showed that the first harmonic i.e. diurnal component of foE predominates the second, third and fourth harmonics of all the months of 1958. See Figure 11 (i) to (xii).
From the normal curve of diurnal variation of foE shown in Figure 9 indicates symmetric characteristics and attain maximum peak at around 12:00 noon of each month of the year. This again confirms that the E layer at Ibadan is a Chapman layer also during low solar activity. The first harmonic i.e. diurnal component of foE predominates the second, third and fourth harmonics of all the months. See Figure 12 (i) to (xii).
From the foregoing the foE is observed to respond more to solar activity than foF2 during the day. Friedman (1960) pointed out that foE respond to changes in sunspot number (Rz) than do foF2, only during moderate and high sunspot number but not at low sunspot number. The foregoing may be as a result of foF2 varying linearly as the square root of Rz while foE varies directly as Rz as reported in the work of Chattopadhyay (2000) and Craig (1965).
4. Conclusion
We present the impact of diurnal and solar activity effects on the harmonic analysis of the critical frequency of the E and F2 layer during year of maximum, moderate and minimum solar activity 1958, 1973 and 1965 respectively at Ibadan (7.400N, 3.900E, 60S dip).
The harmonic analyses carried out on the critical frequency of the E- layer (foE) and F2-layer (foF2) showed that the first harmonic component of diurnal variation of foF2 and foE predominates other harmonic components for the three years investigated, confirming diurnal variation. The normal curve of the E layer always peaks at 12:00 noon showing it to be a Chapman layer. Also, foE variation responds rapidly to changes in sunspot number (Rz) than foF2 during the day.
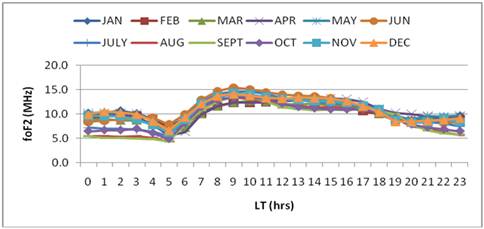
Figure 1. Diurnal variation of foF2 during year of maximum solar activity (1958).
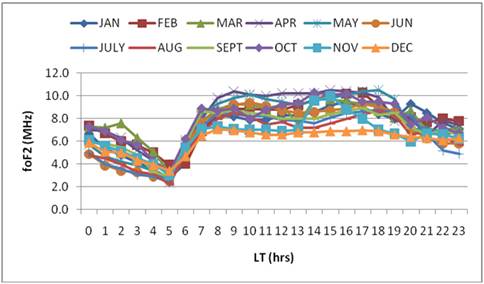
Figure 2. Diurnal variation of foF2 during year of moderate solar activity (1973).
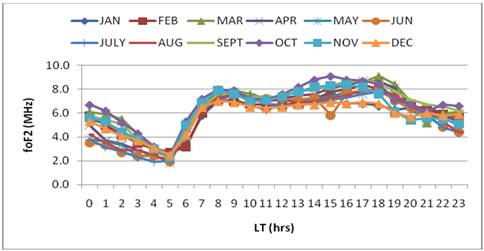
Figure 3. Diurnal variation of foF2 during year of minimum solar activity (1965).
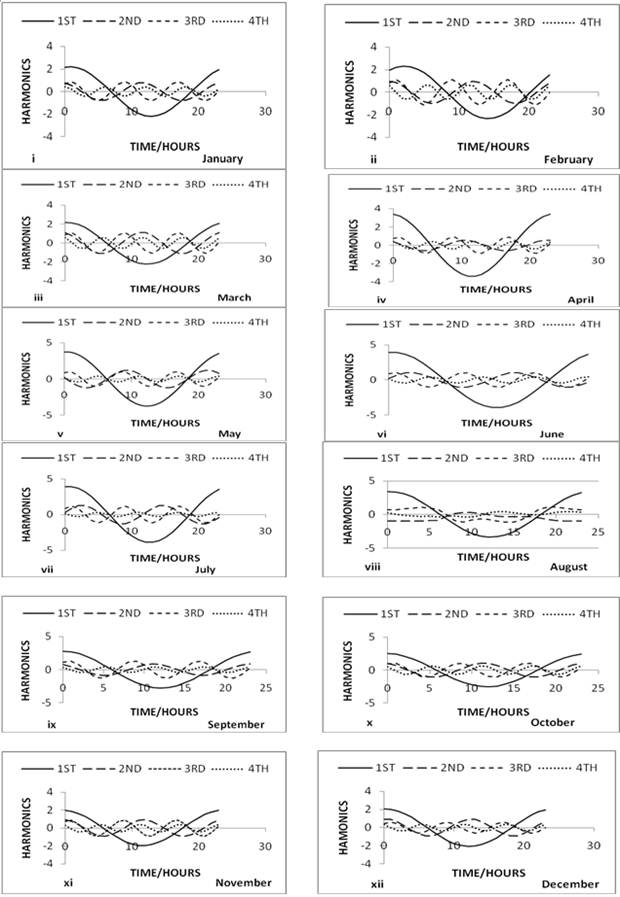
Figure 4. (i) to (xii) Diurnal harmonic curves of foF2 (January to December 1958).
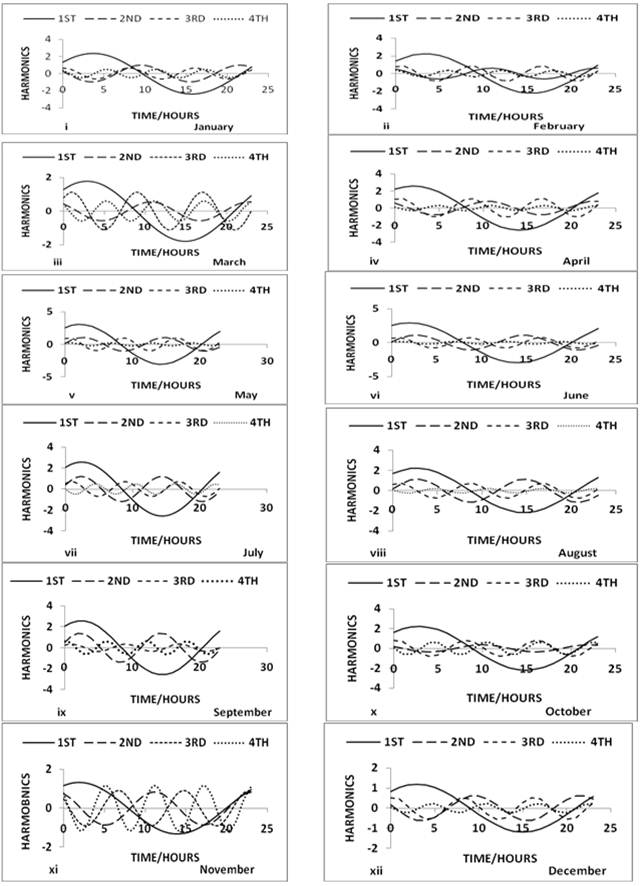
Figure 5. (i) to (xii) Diurnal harmonic curves of foF2 (January to December 1973).
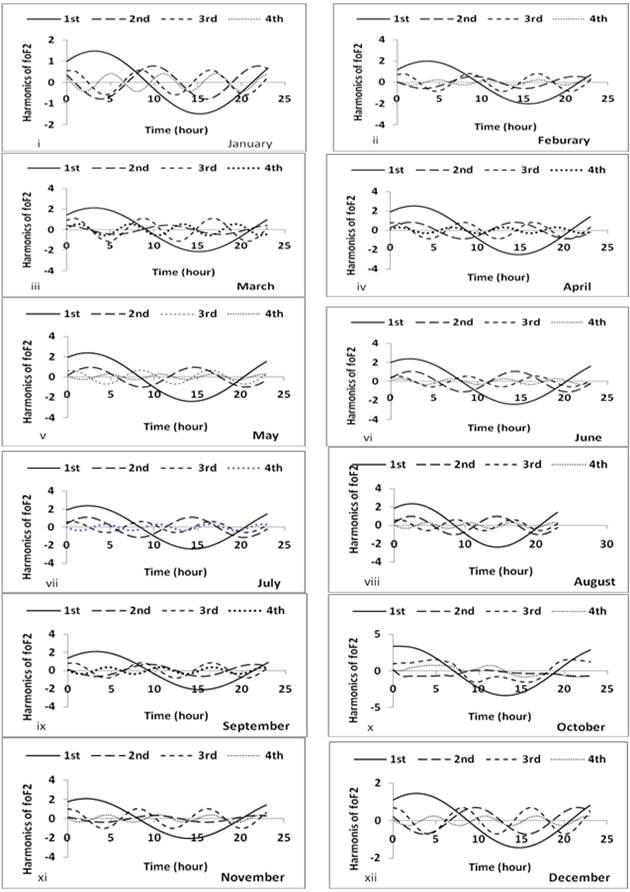
Figure 6. (i) to (xii) Diurnal harmonic curves of foF2 (January to December 1965).
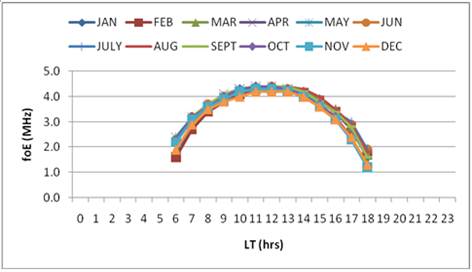
Figure 7. Diurnal variation of foE during year of maximum solar activity (1958).
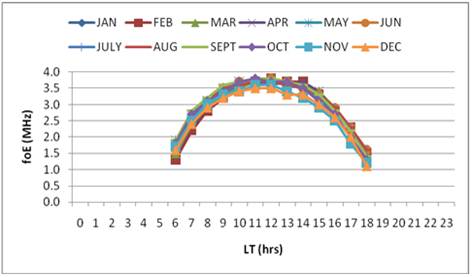
Figure 8. Diurnal variation of foE during year of moderate solar activity (1973).
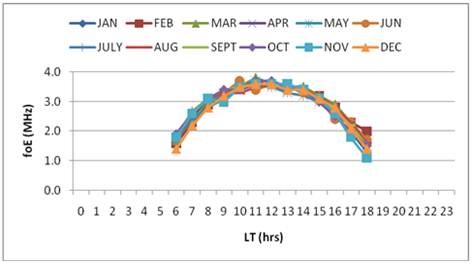
Figure 9. Diurnal variation of foE during year of minimum solar activity (1965).
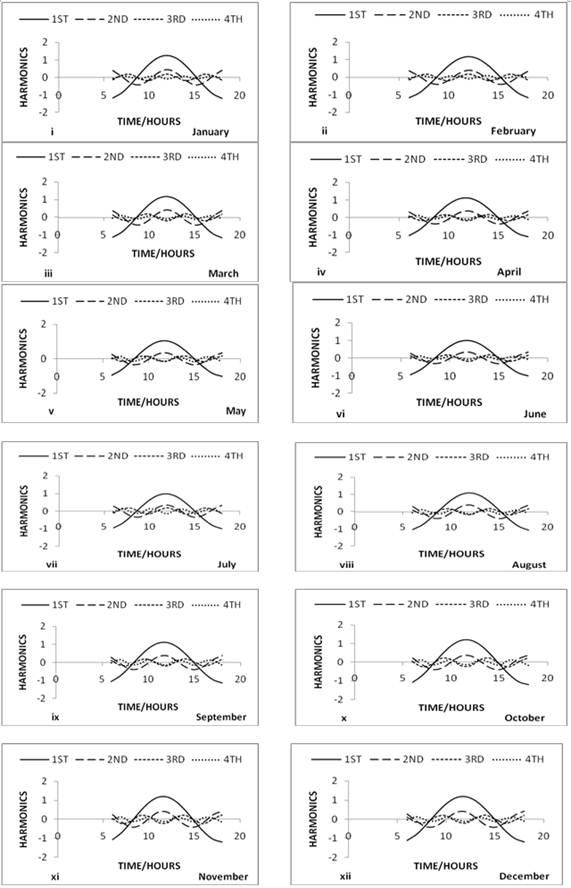
Figure 10. (i) to (xii): Diurnal harmonic curves of foE (January to December 1958).
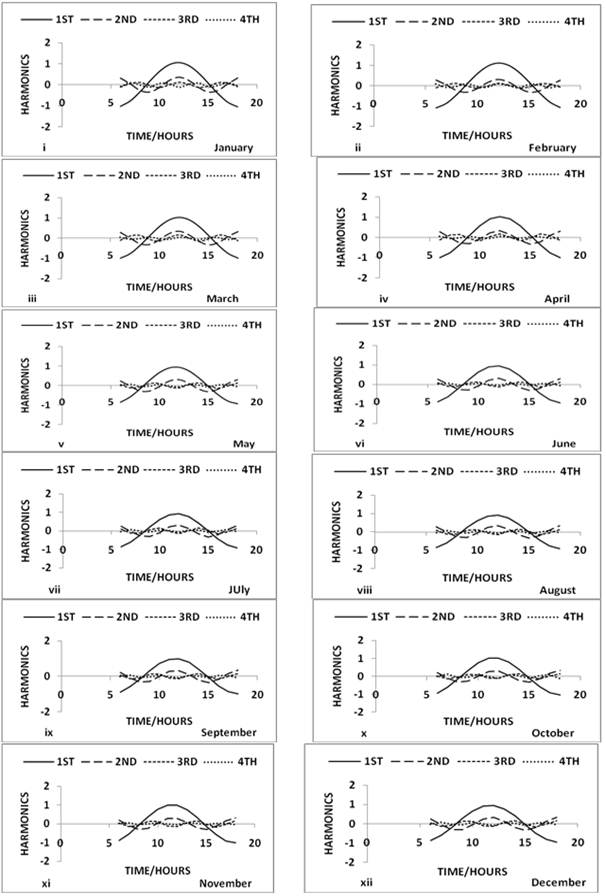
Figure 11. (i) to (xii): Diurnal harmonic curves of foE (January to December 1973).
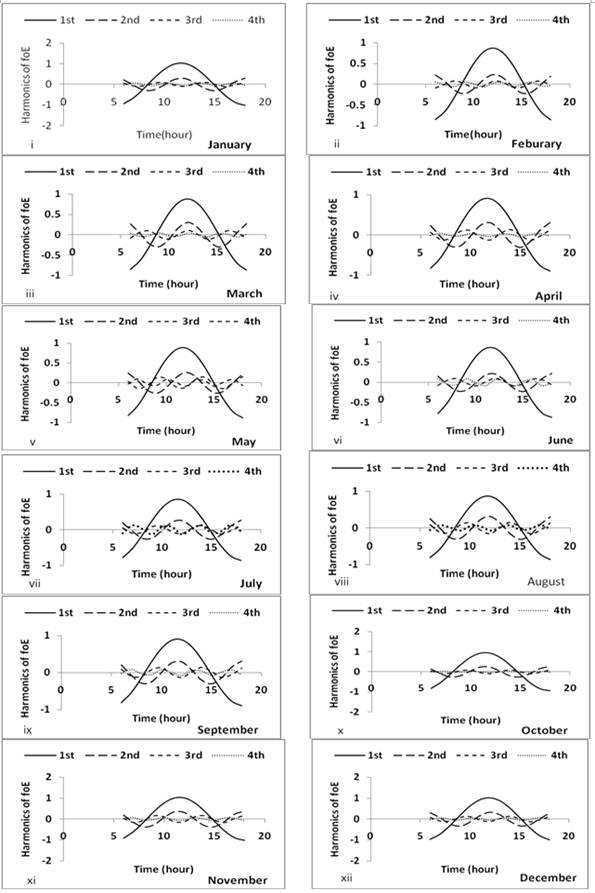
Figure 12. (i) to (xii): Diurnal harmonic curves of foE (January to December 1965).
Acknowledgement
The authors sincerely thank the reviewers and the editor for their useful comments and suggestions.
References
- Akala, A.O., Oyeyemi, E.O., Somoye, E.O, Adeloye, A.B., Adewale, A.O (2010) "Variability of foF2 in the African equatorial ionosphere" J. Adv. Space Res. 45 (2010), pp 1311-1314.
- Craig, R.A. (1965) " The Upper Atmosphere" Academic Press, New York and London
- Chattopadhyay, R. (2000). "Covariation of Critical Frequency of F2-layer and relative Sunspot number" Bull Astronomical Society of India. Vol. 28 pp 657-661.
- Chapman, S. (1950). Upper Atmospheric nomenclature, J. Atmospheric Terrest. Phys. Vol. 1 pp 121-124.
- Friedman, H. (1960)The Sun’s Ionizing Radiations, in "Physics of the Upper Atmosphere" (J.A Ratcliffe,ed.),pp 133,135,151,178,186,193.202,208 Academic Press, New York.
- Kelly, M.C. (1989). "The Earth’s Ionosphere Plasma Physics and Electrodynamics" Academic press U.K.
- Okunola, O.O. (1984). "Sporadic E Ionization at Ibadan and Possible Solar Cycle Dependence" M.Sc. Thesis, University of Ibadan, Nigeria.
- Somoye, E.O. (1984). "A statistical Study of the Critical Frequency of the Ionosphere F region". M.Sc. Thesis, University of Ibadan, Nigeria.
- Somoye, E.O. (2009). "Comparison of NmF2 Variability at Ibadan, Singapore and Slough during different Epochs of Solar cycle" Asian Journal of Scientific Research. pp 157-158.
- Yitzhak, Katznelson. (2004). "An introduction to harmonic analysis", Third edition. Cambridge University Press.


