
International Journal of Energy Science and Engineering, Vol. 1, No. 2, May 2015 Publish Date: May 28, 2015 Pages: 71-84
Experimental and Lattice Boltzmann Method Investigation of Direct Methanol Fuel Cell Performance
Mojtaba Aghajani Delavar*, Ebrahim Alizadeh, Seyed Soheil Mousavi Ajarostaghi
Faculty of Mechanical Engineering, Babol Noshirvani University of Technology, Babol, Islamic Republic of Iran
Abstract
This study experimentally and numerically investigates the effects ofthe feed methanol concentration and temperature on the Direct Methanol Fuel Cell performance. An in house fabricated DMFC with 10×10cm2 active area was used in experimental sets.A two dimensional lattice Boltzmann model with 9 velocities was used in this study. The computational domain includes all seven parts of DMFC: anode channel, catalyst and diffusion layers, membrane and cathode channel, catalyst and diffusion layers. The model was used to predict the flow pattern and concentration fields of different species in both clear channels and porous layers. Good agreement observed between experimental and numerical results. The cell voltage decreases for higher values of feed methanol concentrations due to higher rates of methanol crossover. Cell voltage increases with cell temperature increase, since both anode and cathode kinetics improve as temperature increases.
Keywords
Simulation, Fuel Cell, Porous Media, Temperature, Lattice Boltzmann Method
Received: April 7, 2015
Accepted: April 22, 2015
Published online: May 27, 2015
@ 2015 The Authors. Published by American Institute of Science. This Open Access article is under the CC BY-NC license. http://creativecommons.org/licenses/by-nc/4.0/
Contents
1. Introduction 2. Governing Equation 3. Numerical Model Assumptions and Solution Method 3.1. The Lattice Boltzmann Model 3.2. Species Modelling 3.3. LBM for Porous Zone 3.4. Boundary Conditions 3.5. Computational Domain and Experimental Detail 4. Results 4.1. Methanol Concentration 4.2. Temperature Effects 5. Conclusion Nomenclature
1. Introduction
Recently, developments in renewable energy technologies and high cost of energy from fossil fuels have increased the utilization of different type of fuel cells (Niknam et al., 2012). Fuel cells are devices that convert chemical energy directly into electrical energy without combustion (Wasselynck et al., 2012).
Direct Methanol Fuel Cell (DMFC) as other fuel cells is an electrochemical reactor which converts directly chemical energy to electrical power. In DMFC the solution of methanol and water, and air (Oxygen) are as reactants. The main benefits of DMFC are low emissions, high power density and energy capacity, a potentially renewable and relatively cheap fuel source and fast and convenient refuelling, compact and lightweight systems, and easy storage of liquid fuel.Because of these advantages, DMFC is very attractive for portable and other mobile applications (Larminie & Dicks, 2003).
The fuel cell performance has been the subject of several research papers. A comprehensive numerical model was developed by Xu et al. (2014) to predict the electrochemical performance of SOFC (solid oxide fuel cell). Okur et al. (2014) determined the optimum operating conditions for the process of preparing anode electro catalysts for DSBHFC (direct sodium borohydride fuel cell). Oliveira et al. (2013) presented a 1D mathematical model for a microbial fuel cell in order to predict the correct trends for the influence of current density on the cell voltage.
Numerous researchers devoted to explore mass transfer and electrochemical reactions in DMFCs. Scott et al. (1999) presented a model of the methanol mass transport processes to predict the effective methanol concentration at the catalystsurface and thereby the anode polarization. Argyropoulos et al. (2000) presented a model for the liquid feed direct methanol fuel cell to describe the hydraulic behaviour of an internally manifolded cell stack. Dohle et al. (2002) studied the heat and the power management of a DMFC system analytically and experimentally. In analytical part they carried out analytical solutions for both mass and energy flows. Their study was based on measurements on laboratory scale single cells to obtain data concerning mass and voltage efficiencies and temperature dependence of the cell power.A model was developed by Argyropoulos et al. (2003) to predict the cell voltage versus current density response of a liquid feed DMFC. The model was validated against experimental data for a small-scale fuel cell and is applicable over a wide range of methanol concentration and temperatures.A two dimensional model of the direct methanol fuel cell was developed to describe electrochemical reactions on anode and cathode electrodes, and transport phenomena (Guo & Ma, 2004).
Bennett et al. (2012) developed an analytical model to determine the oxygen concentration profile in the cathode backing layer and flow channel along a one-dimensional cross-section of the DMFC. The model was then applied to examine the effects of new low crossover membranes and to suggest new design parameters for those membranes. Nakagawa et al. (2012) set up some experiments and concluded that higher temperatures lead to a much higher power density. Also, an analytical model was developed by Rosenthal et al. (2012) which shows that higher temperatures have more efficiency too.
Chen &Zhao (2005) modelled a passive liquid-feed DMFC mathematically. They developed a one-dimensional model to predict the performance of this type of fuel cell operating with different methanol concentrations. They showed that the improved performance with higher methanol concentrations is due primarily to the increased operating temperature resulted from the exothermic reaction between permeated methanol and oxygen on the cathode. Kim & Bae (2005) presented a new semi-empirical model to describe the cell voltage of a DMFC as a function of current density for different methanol concentration and temperatures.Scott et al. (2006) developed a parametric analysis to predict the cell voltage versus current density response of a liquid feed direct methanol fuel cell. The model equation was applied to experimental data for a small-scale fuel cell. Ge & Liu (2006) developed a mathematical model to study the effects of methanol crossover, porosities of diffusion and catalyst layers, methanol flow rates, and channel shoulder widths on a DMFC performance. Hern et al. (2008) showed that cell performance improved with increasing of the cell temperature, cathode flow rate, and cathode back pressure. Celik & Mat (2010) developed a single cell DMFC experimental setup to measure methanol and water concentrations and performance of the cell depending on operating conditions. Many other investigations have been done to studythe effects of operating parameters on DMFC performance (such as Argyropoulos et al., 2000; Liu et al., 2005; Ghayor et al., 2009).
In comparison with the conventional CFD methods, the lattice Boltzmann method (LBM) is relatively new method based on kinetic theory which has some advantages such as simple calculation procedure, simple and efficient implementation for parallel computation, easy and robust handling of complex geometries, and others (Succi, 2001; Mohammad, 2011). The LBM was used for simulation of Fuel cells in some studies (Wang & Afsharpoya, 2006; Fei & Hong, 2007; Joshi et al., 2007; Park & Matsubara, 2007; Niu et al., 2007; Park & Li, 2008; Hao & Cheng, 2009; Delavar et al., 2010).
In authors previous study (Delavar et al., 2010) LBM was used to predict the flow pattern and concentration fields of different species in both porous parts and clear channels of a DMFC to investigate the cell performance.After that in this study,the effects of temperature and anode feed methanol concentrations on performance of a DMFC are investigated experimentally and numerically. The 2D multi component LBM is used to simulate flow pattern and chemical reactions in a DMFC simultaneously. The computational domain consists of all fuel cell sections: anode channel, diffusion and catalyst layers, membrane, and cathode channel, diffusion and catalyst layers. The flow pattern and polarization curves of the cell are obtained and compared with the experimental results.
2. Governing Equation
In DMFCs methanol and air react and produce water, heat and the electrical power. The overall reaction that takes place in DMFC is as below:
![]() (1)
(1)
The governing equations for flow fields and species concentrationsin both anode and cathode sides are:
Continuity equation
![]() (2)
(2)
Momentumequation
![]() (3)
(3)
The species conservation equation is as below:
![]() (4)
(4)
where ![]() represents the reactant species (methanol or water or carbon dioxide in the anode side, air (oxygen) or water vapour in the cathode side),
represents the reactant species (methanol or water or carbon dioxide in the anode side, air (oxygen) or water vapour in the cathode side), ![]() is mole fraction of species
is mole fraction of species ![]() ,
, ![]() is mass generation rate for species
is mass generation rate for species ![]() per unit volume (Table1),
per unit volume (Table1), ![]() is effective diffusion coefficient of the lth component,
is effective diffusion coefficient of the lth component,![]() is porosity of the porous media and
is porosity of the porous media and ![]() is diffusivity of the lth component.
is diffusivity of the lth component.
Table 1. Anode and cathode source terms [![]()
![]() ] in species equation.
] in species equation.
| Anode | Cathode | |||
| Methanol-water | Carbon dioxide | Oxygen | Water | |
| Channels | 0 | 0 | 0 | 0 |
| Diffusion layers | 0 | 0 | 0 | 0 |
| Catalyst layers |
|
|
|
|
In lattice Boltzmann method the Eqs.(4)-(6) are satisfied with calculations of different distribution functions by solving the Lattice Boltzmann Equation (LBE)as discussed later.
To determine the volumetric reaction rate (![]() in anode and
in anode and ![]() in cathode) in catalyst layers the Tafel equation is used (Ge & Liu, 2006; Delavar et al., 2010):
in cathode) in catalyst layers the Tafel equation is used (Ge & Liu, 2006; Delavar et al., 2010):
 (5)
(5)
 (6)
(6)
where ![]() is reference exchange current density,
is reference exchange current density, ![]() is methanol molar concentration,
is methanol molar concentration,![]() is reference methanol molar concentration,
is reference methanol molar concentration,![]() is oxygen molar concentration,
is oxygen molar concentration, ![]() is reference oxygen molar concentration,
is reference oxygen molar concentration, ![]() and
and ![]() are reaction order and transfer coefficient,
are reaction order and transfer coefficient, ![]() is anode over potential,
is anode over potential,![]() is cathode over potential,
is cathode over potential, ![]() is temperature ,
is temperature ,![]() is gas constant and
is gas constant and ![]() is Faraday constant
is Faraday constant ![]() . The proposednumerical model is completely sensitive to reactants concentrations in each location in the domain and their variations will affect the volumetric reaction rates and source term in species equations.
. The proposednumerical model is completely sensitive to reactants concentrations in each location in the domain and their variations will affect the volumetric reaction rates and source term in species equations.
The cell voltage is calculated by (Ge & Liu, 2006 ):
![]() (7)
(7)
where![]() is open circuit voltage,
is open circuit voltage, ![]() denotes membrane resistance,
denotes membrane resistance, ![]() is catalyst layer thickness,
is catalyst layer thickness, ![]() presents thickness of the membrane and
presents thickness of the membrane and ![]() is membrane conductivity.
is membrane conductivity.
The methanol flux which is due to diffusion and electro-osmotic drag is given by (Ge & Liu, 2006):
![]() (8)
(8)
where![]() is methanol concentration in the membrane, and
is methanol concentration in the membrane, and ![]() is electro-osmotic drag coefficient for methanol.
is electro-osmotic drag coefficient for methanol.
3. Numerical Model Assumptions and Solution Method
To develop the numerical model the following assumptions were made: fluids are incompressible; all flows are laminar and all processes are isothermal; the carbon dioxide generated in the anode side is solved in water and its effects are negligible on flow pattern; the methanol crossed over from the anode to the cathode is completely oxidized at the interface between membrane and cathode catalyst layer; and the membrane is impermeable to gases and is fully hydrated. The catalyst and diffusion layers are considered as faces not as interfaces (in 2D), and model is sensitive to change inreactants concentrations in both directions (horizontal and vertical) in all parts of DMFC. In simulation procedure the velocity fields at anode and cathode sides are determined first. For a given value of anode average current density the species concentration and over-potential at the anode side are determined. The methanol crossover flux can be determined and then the related pseudo current density is calculated by:
![]() (9)
(9)
Using species and Tafel equations in the cathode side will produce cathode side over potential by:
 (10)
(10)
Then cell voltage is calculated by Eq. (7), this procedure will repeat for other values of current density to obtain polarization curve.
3.1. The Lattice Boltzmann Model
Lattice Boltzmann method is a mesoscopic model which uses distribution functions to capture macroscopic fluid quantities such as velocity and pressure. The distribution functions are calculated by solving the lattice Boltzmann equation. After introducing BGK (Bhatnagar–Gross–Krook) approximation, the Boltzmann equation with external force can be written as:

 (11)
(11)
where ![]() denotes the lattice time step,
denotes the lattice time step, ![]() is the discrete lattice velocity in direction k,
is the discrete lattice velocity in direction k,![]() is the external force in direction of lattice velocity (
is the external force in direction of lattice velocity (![]() ),
), ![]() denotes the lattice relaxation time,
denotes the lattice relaxation time,![]() is the equilibrium distribution function,
is the equilibrium distribution function, ![]() is lattice fluid density and
is lattice fluid density and ![]() is a weighting factor depending on the LB model used (D2Q9). The LB model used in this study to simulate DMFC is as same as LB model used in Delavar et al., 2010.
is a weighting factor depending on the LB model used (D2Q9). The LB model used in this study to simulate DMFC is as same as LB model used in Delavar et al., 2010.
3.2. Species Modelling
To consider both flow field and species concentration fields, LBM utilizes multi distribution functions, ![]() and
and![]() , for the flow and lthspecies concentration fields respectively. The
, for the flow and lthspecies concentration fields respectively. The ![]() distribution function is as same as discussed above; the
distribution function is as same as discussed above; the ![]() distribution is as below:
distribution is as below:
 (12)
(12)
where![]() is source term of the lth species (as presented in Eq. (6) and Table1). Because that species concentration is scalar the corresponding equilibrium distribution functions are defined as above. After computing the values of these local distribution functions, the flow properties are defined as:
is source term of the lth species (as presented in Eq. (6) and Table1). Because that species concentration is scalar the corresponding equilibrium distribution functions are defined as above. After computing the values of these local distribution functions, the flow properties are defined as:
![]() (13)
(13)
The relaxation times, ![]() and
and ![]() , for flow and species equations given in Eqs. (11) and (12) are determined by
, for flow and species equations given in Eqs. (11) and (12) are determined by ![]() and
and![]() .
. ![]() is diffusion coefficient of the lthspecies.
is diffusion coefficient of the lthspecies.
There is a critical issue in Eq. (12), ![]() is lattice time step and must be related to real time for proper including source terms. For
is lattice time step and must be related to real time for proper including source terms. For![]() as characteristic length,
as characteristic length,![]() as diffusion coefficient of species and t as time, then:
as diffusion coefficient of species and t as time, then:
 (14)
(14)
where![]() denotes number of lattices used to mesh
denotes number of lattices used to mesh![]() . Eq. (14) determines appropriate time step for each species modelling. It was seen that using Eq. (14) yields
. Eq. (14) determines appropriate time step for each species modelling. It was seen that using Eq. (14) yields ![]() for all species.
for all species.
As same as must of other simulations to ensure correct simulation of flow and species concentration fields the relevant dimensionless numbers, Reynolds and Schmidt number, should be equal in real and LBM. After setting viscosity, velocity and number of lattices in LBM regarding to Reynolds number, the proper value of species diffusion coefficientsfor each species were achieved by related Schmidt number.
3.3. LBM for Porous Zone
The Brinkman-Forchheimer equation was used for simulation the flow in porous regions, which is written as:
 (15)
(15)
where![]() denotes the porosity, υeff is the effective viscosity, K denotes the permeability, and G is the acceleration due to gravity (which is neglected in this study). For porous medium the corresponding distribution functions are as same as Eq. (1), but the equilibrium distribution functions and forcing term,
denotes the porosity, υeff is the effective viscosity, K denotes the permeability, and G is the acceleration due to gravity (which is neglected in this study). For porous medium the corresponding distribution functions are as same as Eq. (1), but the equilibrium distribution functions and forcing term, ![]() , are calculated by:
, are calculated by:

 (16)
(16)
After improving Eq. (15) as below it can be used for both fluid and porous zones:
 (17)
(17)
this unified governing equation assured the matching conditions at the fluid-porous interface automatically. So employing LBM significantly reduces the complexity of the traditional methods, which considers two regions separately. More information about porous media simulation in DMFC with LBM can be found in Delavar et al. (Delavar et al., 2010).
3.4. Boundary Conditions
From the streaming process the distribution functions out of the domain are known so the unknown distribution functions
are those toward the domain.Regarding the boundary conditions of flow field, the solid walls are assumed to be no slip, and thus the bounce-back scheme is applied. This scheme specifies the outgoing directions of the distribution functions as the reverse of the incoming directions at the boundary sites. The treatment of the concentration population at the solid walls can be simplified by applying the bounce-back scheme to the concentration distribution function ![]() . For boundaries with specified concentration, inlet ports (
. For boundaries with specified concentration, inlet ports (![]() ), the unknown distribution functions are treated as:
), the unknown distribution functions are treated as:
 (18)
(18)
3.5. Computational Domain and Experimental Detail
Computational domain consists of all seven parts of DMFC: anode channel, diffusion and catalyst layers, membrane and cathode channel, diffusion and catalyst layers, Fig. 1. Two phases have been considered, in the anode side the liquid phase and in the cathode side the gas phase. A single cell DMFC was fabricated for experimental set. Graphite plates with 300µmthickness have been used as bipolar plates for current collection and flow distribution. A single serpentine channel, 10×10mm2 was machined. The width of the ribs was 1mm. The MEA in this work had an active area of 10×10mm2 and consist of two carbon cloth diffusion layers, two catalyst layers and the fNafion® membrane 117. Both anode and cathode electrodes used carbon cloth, catalyst was Pt–Ru on the anode side with a loading of 4mg.cm−2, and the cathode side catalyst was Pt-black with loading of 4mg.cm−2. The experiments were carried out in the test loop was shown in Fig. 1. According to experimental set and previous studies the operating conditions given in Table 2 were used in LBM simulations.
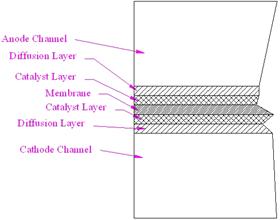
Fig. 1. The computational domain and schematic of the test loop.
Table 2. Simulation Parameters
| 0.1 cm | Anode channel height (from experimental set) |
| 0.1 cm | Cathode channel height (from experimental set) |
| 0.1 cm | Anode and cathode channels width (from experimental set) |
| 0.01 cm | Anode and cathode diffusion layers thickness (from experimental set) |
| 0.004 cm | Anode and cathode catalyst layers thickness (from experimental set) |
| 0.014 cm | Membrane thickness (from experimental set) |
| 10 ml.min-1 | Methanol flow rate (from experimental set) |
| 20 slpm | Oxygen flow rate (from experimental set) |
| 1.5×1.01325×105 Pa | Pressure of air in cathode (from experimental set) |
| 1.0×10⁻³ mol.cm-3 | Reference concentration of methanol (Scott & Taama, 1997; Guo& Ma, 2004) |
| 0.21×10⁻⁶ P/(RT) mol.cm-3 | Feed oxygen concentration |
| 1.0×10⁻⁶ P/(RT) mol.cm- | Reference concentration of oxygen (Scott & Taama, 1997; Guo& Ma, 2004) |
| 0.865 | Transfer coefficients of anode (fitted) |
| 0.865 | Transfer coefficients of cathode (fitted) |
|
| Electro-osmotic drag coefficient of water (Guo & Ma, 2004) |
|
| Diffusion coefficient of methanol in water (Guo & Ma, 2004; Scott et al., 1995) |
|
| Diffusion coefficient of methanol in membrane (Scott & Taama, 1997; Guo& Ma, 2004) |
| 1×10⁻¹⁰ cm2.s-1 | Diffusion coefficient of CO2 in water (Scott & Taama, 1997) |
| 1.22×10⁻⁶ cm2.s-1 | Diffusion coefficient of oxygen in air (Danilov et al., 2006) |
| 0.55 | Correction factor of diffusion coefficient (from experimental set) |
| 1×10⁻³ | Darcy number for porous medium (assumed) |
| 1.0 | Reaction order (Scott et al., 1995; Wang & Wang 2003) |
|
| Conductivity (Scott & Taama, 1997; Guo & Ma, 2004) |
| 1.1×10⁻² A.cm-3 | Reference exchange current density per unit volume of anode (Guo& Ma, 2004; Kulikovsky, 2002) |
| tca×1.1×10⁻²A.cm-3 | Reference exchange current density of anode (Guo& Ma, 2004; Kulikovsky, 2002) |
| 1.1×10⁻² A.cm-3 | Reference exchange current density per unit volume of cathode (Guo & Ma, 2004; Kulikovsky, 2002) |
| tcc×1.1×10⁻²A.cm-3 | Reference exchange current density of cathode (Celik & Mat, 2010; Kulikovsky, 2002) |
| 0.8 Ω/cm2 | Contact resistance (Celik & Mat, 2010) |
| 1.213 | Ideal electromotive force of the cell under standard conditions (open circuit voltage) (Guo & Ma, 2004; Zerbinati et al., 2002) |
| -1.4×10⁻⁴ | Rate of change of electromotive force |
Table 3. Cell voltage (V) for different grids sizes to mesh porous mediums
| Cell current density / mA.cm-2 | Mesh size | ||||
| 150 | 100 | 50 | 25 | cm | No. |
| 0.396 | 0.457 | 0.511 | 0.608 | 0.004 | 1 |
| 0.384 | 0.452 | 0.500 | 0.601 | 0.002 | 2 |
| 0.376 | 0.448 | 0.490 | 0.594 | 0.001 | 3 |
| 0.370 | 0.442 | 0.487 | 0.589 | 0.0005 | 4 |
A grid independence study shows that that all checked grids produced acceptable accurate results in clear parts of the domain, but for porous zones some differences were observed in the species concentrations calculation, especially in the anode side. Table 3 shows the calculated voltage of the cell at different cell current densities and grid sizes according to these results and time saving the grid No. 3 was adopted in this study.
4. Results
Fig. 2. Comparison of velocity profile for partially filled channel with porous media between present model and Alazmi & Vafai (2001).
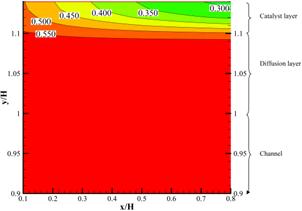
In this study a two dimensional multi component LBM code carried out to simulate flow and species concentration in clear channel and porous zones of DMFC. Simulation of flow in clear and porous regions and porous fluid interfacewas validated successfully with Alazmi and Vafai [30], Fig. 2. Figure 3 shows velocity contours for all simulation parts in DMFC. It can be seen that velocity in cathode channel is more than 12 times greater than velocity in anode channel, which leads to some problems in LBM simulation in channels interface, which was solved by using two separate distribution functions for anode and cathode sides in LBM code.
4.1. Methanol Concentration
Effects of methanol concentration were investigated experimentally and numerically. In experimental study methanol concentrations were ranging from 0.5 to 1.5M, oxygen flow rate was set at 2slpm, methanol flow rate was 10ml.min−1, and cell temperature was 60oC.The flow pattern and concentration fields for different parts of DMFC were calculated numerically and then cell polarization curves have been achieved. A good agreement was observed between the LBM and experimental results, Fig. 4.
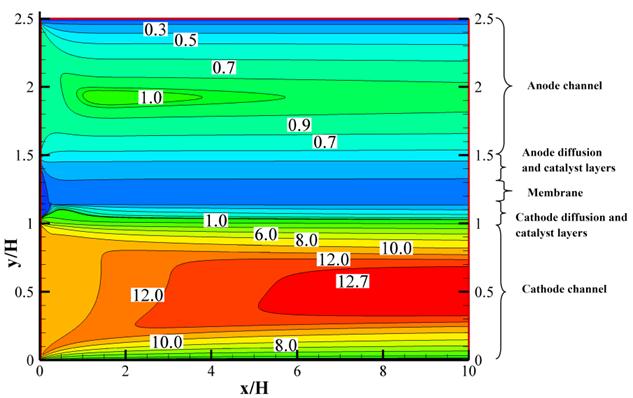
Fig. 3. Velocity contours (u/umax-anode) for all seven parts of DMFC.
Unlike some other studies (Scott et al., 1999; Liu et al., 2005; Guo & Ma, 2004; Ge & Liu, 2006) the cell voltage decreases for higher values of feed methanol concentrations due to higher rates of methanol crossover at higher anode feed methanol concentrations, Fig. 4. This result has also been reported by (Cruickshank & Scott, 1998; Jung et al., 1998; Hern et al., 2008). Cruickshank & Scott (1998) showed that lower performance of cell at higher methanol concentrations is due to methanol crossover phenomenon. Due to crossover effect, an increased methanol concentration affects not only the anode side but also more methanol is transported through the membrane at high methanol concentrations, so the potential of cathode decreases and more water is formed (Alizadeh et al., 2010). Therefore it is necessary to find the optimal concentration under the operating conditions of the fuel cell.
In this study multi component LBM is used to simulate DMFC, in this scheme the effects of second phase on flow pattern (CO2 in anode and water in cathode) are ignored. This assumption when the second phase concentration increases, degrades the numerical results from the experimental ones. According to Table 1, higher values of cell current densities will produce more second phase in anode and cathode channels. So for higher values of cell current densities, the difference between numerical and experimental results increases, Fig. 4.
Fig. 4. Experimental data and LBM for polarization curves and power variation with current density, investigation the effects of feed methanol concentration.
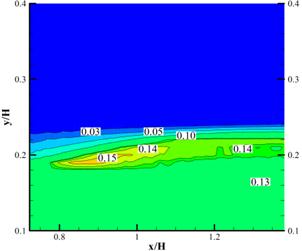
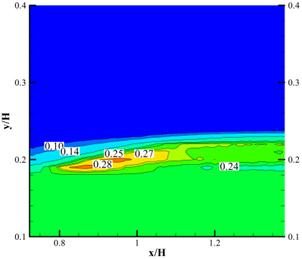
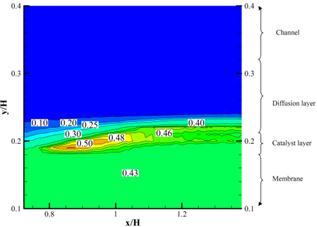
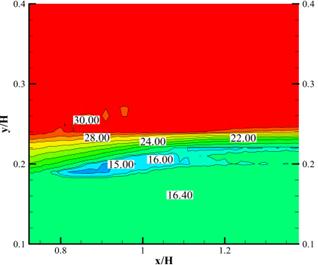
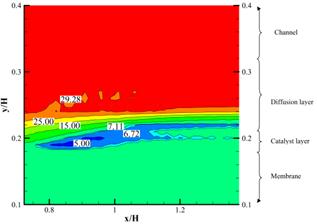
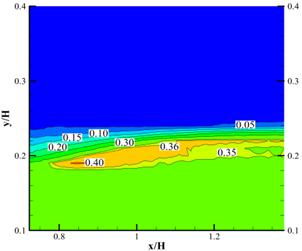
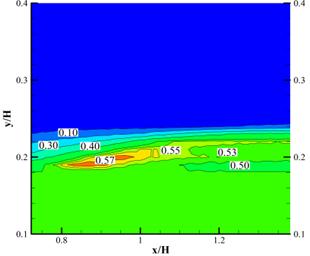
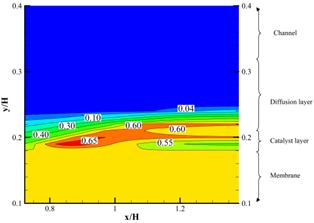
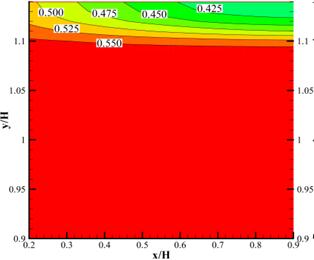
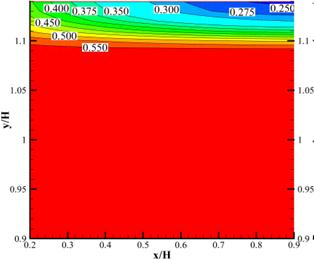
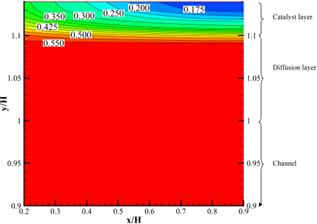
In Figs. 5 and 6 instantaneous carbon dioxide and methanol concentrations at membrane, channel, diffusion and catalyst layers of anode side are illustrated for different cell current densities, respectively. Instantaneous oxygen concentration for cathode channel, diffusion and catalyst layer is shown in Fig. 7. According to these figures the reactants concentrations (methanol and oxygen for anode and cathode sides, respectively) reduce near to active catalyst layers and at higher values of cell current density, and products concentrations increase.
a
b
c
Fig. 5. Instantaneous carbon dioxide concentration contours (kg.m-3) for anode channel, diffusion and catalyst layers, membrane, feed methanol concentration 1.0M, cell current density, a) 25mA.cm-2, b)50mA.cm-2, c)100mA.cm-2
a
b
c
Fig. 6. Instantaneous methanol concentration contours (kg.m-3) for anode channel, diffusion and catalyst layers, membrane, feed methanol concentration 1.0M, cell current density, a) 12.5mA.cm-2, b)112.5mA.cm-2, c)250mA.cm-2
a
b
c
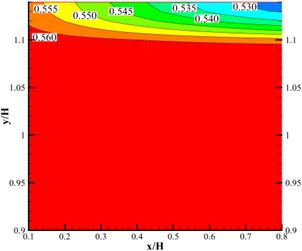
Fig. 7. Instantaneous oxygen concentration contours (kg.m-3) for cathode channel, diffusion and catalyst layers; feed methanol concentration 1.0M, cell current density, a) 10mA.cm-2, b)75mA.cm-2, c)100mA.cm-2
One of the main reasons for differences between numerical and experimental results (especially for power variation with cell current density in Fig. 4)is the differences between channel lengths in experimental and numerical configurations. In numerical simulations due to simulation time limitations (CPU time) just a limited length of channel was considered (2cm) as done before by Guo & Ma (2004) and Ge & Liu (2006). Increasing the channel length will increases the effects of second phase, because of accumulation of the chemical reactions products in the flow when the fluid flows in the anode and cathode channels.
4.2. Temperature Effects
The effects of temperature on the cell performance were investigated numerically and experimentally.The cell temperature was considered to be in the range of 40 to 60oC. For experimental configuration oxygen flow rate was set at 2slpm, methanol flow rate was 10ml.min−1, and methanol concentration was fixed at1M. As it can be seen, cell voltage increases with cell temperature increase, Fig. 8. This is expected according to Eqs. (7) and (8), since both anode and cathode kinetics improve as temperature increases. As discussed above for higher values of cell current densities, more creation of second phase will increase the differences between numerical and experimental results, Fig.8. The results presented in this figureillustrate that the temperature is a key parameter affecting cell performance.The difference between numerical results and experimental ones in Fig. 8 is also due to differences between channel lengths in these two models as discussed before.
Fig. 8. Polarization curves and power variation with current density for experimental data and LBM, investigation of temperature effects.
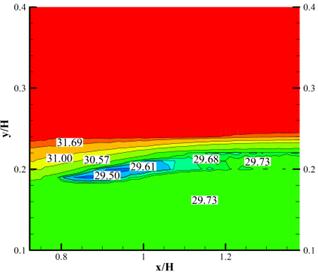
Figure 9 shows the instantaneous carbon dioxide concentration in anode channel, diffusion and catalyst layers at different cell temperatures. As discussed above the effects of temperature on cell (concentration fields) is apparent. For constant anode over potential, at higher temperatures more carbon dioxide is produced in anode catalyst layer due to higher reaction rate, Eq. (7). More oxygen is consumed in cathode catalyst layer reaction due to Eq. (8), so increasing the temperature will decreases oxygen concentration in cathode side of fuel cell, Fig. 10.
a
b
c
Fig. 9. Instantaneous carbon dioxide concentration contours (kg.m-3) for anode channel, diffusion and catalyst layers, membrane; feed methanol concentration 1.0M, ![]() ,cell temperature, a)
,cell temperature, a)![]() , b)
, b)![]() , c)
, c)![]()
a
b
c
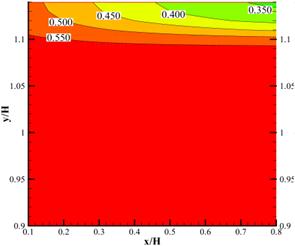
Fig. 10. Instantaneous oxygen concentration contours (kg.m-3) for cathode channel, diffusion and catalyst layers; feed methanol concentration 1.0M, ![]() , cell temperature, a)
, cell temperature, a)![]() , b)
, b)![]() , c)
, c)![]()
5. Conclusion
In this study the effects of temperature and feed methanol concentration on direct methanol fuel cellwas investigated numerically and experimentally. A two dimensional lattice Boltzmann model with 9 velocities, D2Q9, was used in numerical simulations. To increase simulations accuracy the computational domain includes seven parts: anode channel, catalyst and diffusion layers, membrane and cathode channel, catalyst and diffusion layers. The model has been used to predict the flow pattern and concentration fields of different species in both clear and porous zones. The numerical results have been compared well with experimental ones. The following results were obtained:
The cell voltage decreases for higher values of feed methanol concentrations due to higher rates of methanol crossover at higher anode feed methanol concentrations.
The reactants concentration reduces near to active catalyst layers and at higher values of cell current density, and products concentrations increase.
Cell voltage increases with cell temperature increase, since both anode and cathode kinetics improve as temperature increases.
Increasing the temperature will decreases oxygen concentration in cathode side of fuel cell.
One of the main reasons for differences between numerical and experimental results is the differences between channel lengths of experimental and numerical configurations. Channel length has a significant effect on second phase accumulation and concentration which cause a difference between experimental and numerical results.
Increasing cell current density and feed methanol concentration also increases the differences between numerical and experimental results. That is due to increasing second phase concentration which changes flow from multi component to multi phase pattern.
For higher values of cell current densities, more creation of second phase will occur which increase the differences between numerical and experimental results
Nomenclature
![]() Exchange current density
Exchange current density ![]()
![]() Molar concentration
Molar concentration ![]()
![]() Open circuit voltage
Open circuit voltage![]()
![]() Faraday constant
Faraday constant![]()
![]() Gravity acceleration
Gravity acceleration![]() .
.
![]() The average current density of the cell
The average current density of the cell ![]()
![]() Volumetric reaction rate
Volumetric reaction rate![]()
![]() Molecular weight
Molecular weight
![]() Mass transfer rate
Mass transfer rate
![]() Volumetric mass source
Volumetric mass source![]()
![]() Gas constant
Gas constant ![]() in Eqs. (9) and (10)
in Eqs. (9) and (10)
![]() Resistance
Resistance ![]() in Eq. (11)
in Eq. (11)
![]() Time
Time ![]() in Eqs (1-3)
in Eqs (1-3)
![]() Thickness
Thickness ![]()
![]() Temperature
Temperature![]()
![]() Velocity component
Velocity component ![]()
![]() Dimension
Dimension![]()
Greek symbols:
![]() transfer coefficient
transfer coefficient
![]() reaction order
reaction order
![]() Over potential
Over potential ![]()
![]() Viscosity
Viscosity ![]()
![]() Density
Density ![]()
![]() Conductivity
Conductivity ![]() )
)
Subscripts and superscripts:
![]() Anode
Anode
![]() Cathode
Cathode
![]() Catalyst layer
Catalyst layer
![]() Gas
Gas
![]() Dimension direction
Dimension direction
![]() Liquid
Liquid
![]() Membrane
Membrane
![]() Methanol
Methanol
![]() From phase
From phase ![]() to phase
to phase ![]()
![]() Reference
Reference
References
- Alazmi, B. & Vafai, K. (2001)Analysis of fluid flow and heat transfer interfacial conditions between a porous medium and a fluid layer, International Journal of Heat and Mass Transfer, 44, 1735-1749.
- Alizadeh, E., Farhadi, M., Sedighi, K. & Shakeri, M. (2010) Effects of Operating Parameters on Performance of a single Direct Methanol Fuel Cell,Thermal Science, 14, 469-477.
- Argyropoulos, P., Scott, K. & Taama, W.M. (2000)Modelling pressure distribution and anode/cathode streams vapour–liquid equilibrium composition in liquid feed direct methanol fuel cells,Chemical EngineernigJournal, 78, 29–41.
- Argyropoulos, P., Scott, K. & Taama, W. M. (2000) Modeling Flow Distribution for Internally Manifolded Direct Methanol Fuel Cell Stacks,Chemical Engineering Technology, 23(11), 985-995.
- Argyropoulos, P., Scott, K., Shukla, A.K. & Jackson, C. (2003) A semi-empirical model of the direct methanol fuel cell performance Part I. Model development and verification, Journal of Power Sources, 123, 190–199.
- Bennett, B., Koraishy, B.M., Meyers, J.P. (2012) Modeling and optimization of the DMFC system: relating materials properties to system size and performance, J Power Sources , 218, 268-279.
- Birgersson, E., Nordlund, J., Ekstr¨om, H., Vynnycky, M., & Lindberghb, G. (2003)Reduced Two-dimensional One-Phase Model for Analysis of the Anode of a DMFC,J. Electrochem. Soc., 150, A1368–A1376.
- Celik, S. & Mat, M.D. (2010)Measurement and estimation of species distribution in a direct methanol fuel cell,International Journal of Hydrogen Energy,35, 2151-2159.
- Chen, R. & Zhao, T.S. (2005) Mathematical modeling of a passive-feed DMFC with heat transfer effect, Journal of Power Sources, 152, 122–130.
- Cruickshank, J. & Scott, K. (1998) The degree and effect of methanol crossover in the direct methanol fuel cell,Journal of Power Sources, 70, 40-47.
- Danilov, V.A., Lim, J., Moon, I. & Chang, H. (2006)Three-dimensional, two-phase, CFD model for the design of a direct methanol fuel cell,Journal of Power Sources, 162, 992–1002.
- Delavar, M.A., Farhadi, M. & Sedighi, K. (2010)Numerical Simulation Of Direct Methanol Fuel Cells Using Lattice Boltzmann Method,International Journal of Hydrogen Energy, 35, 9306-9317.
- Dohle, H., Mergel, J. & Stolten, D. (2002) Heat and power management of a direct-methanol-fuel-cell (DMFC) system, Journal of Power Sources, 111, 268–282.
- Ge, J. & Liu, H. (2006)A three-dimensional mathematical model for liquid-fed direct methanol fuel cells,Journal of Power Sources, 160, 413–421.
- Fei, K. & Hong, C.W. (2007)All-angle removal of CO2 bubbles from the anode microchannels of a micro fuel cell by lattice-Boltzmann simulation, Microfluidics and Nanofluidics,3, 77-88.
- Ghayor, R., Shakeri, M., Sedighi, K. & Farhadi, M. (2009) Experimental and numerical investigation on passive and active μDMFC, International Journal of Hydrogen Energy, 35, 9329-9337.
- Guo, H. & Ma, C.F. (2004)2D analytical model of a direct methanol fuel cell, Electrochemistry Communications,6, 306–312.
- Hao, L. & Cheng, P. (2009), Lattice Boltzmann simulations of liquid droplet dynamic behavior on a hydrophobic surface of a gas flow channel,Journal of Power Sources,190, 435-446.
- Hern, S., Chang, S. & Lee, S. (2008)Effect of Operating Parameters on the Direct Methanol Fuel Cell Using Air or Oxygen As an Oxidant Gas, Energy Fuels, 22, 1212–1219.
- Joshi, A.S., Grew, K.N., Peracchio, A.A. & Chiu, W.K.S. (2007)Lattice Boltzmann modeling of 2D gas transport in a solid oxide fuel cell anode,Journal of Power Sources, 164, 631–638.
- Jung, D.H., Lee, C.H., Kim, C.S. & Shin, D.R. (1998) Performance of a direct methanol polymer electrolyte fuel cell,Journal of Power Sources, 71, 169-173.
- Kim, T.H. & Bae, Y.C. (2005) A semi-empirical cell voltage model for the direct methanol fuel cell: the methanol crossover effect, Polymer, 46, 6494–6499.
- Kulikovsky, A.A. (2002)The voltage–current curve of a direct methanol fuel cell: "exact" and fitting equations,Electrochemistry Communication, 4, 939-946.
- Larminie, J., & Dicks, A. (2003) Fuel Cell Systems Explained, second Ed., John Wiley & Sons Inc., England.
- Liu, J.G., Zhao, T.S., Chen, R. & Wong, C.W. (2005)The effect of methanol concentration on the performance of a passive DMFC, Electrochemistry Communication,7, 288–294.
- Mohammad, A.A. (2011) Lattice Boltzmann Method, Fundamentals and Engineering Applications with Computer Codes, Springer-Verlag London Limited.
- Murgia, G., Pisani, L., Shukla, A.K. & Scott, K. (2003)A numerical model of a liquid-feed solid polymer electrolyte DMFC and its experimental validation,Journal of the Electrochemical Society, 150, A1231–A1245.
- Nakagawa, N., Tsujiguchi, T., Sakurai, S., Aoki, R. (2012) Performance of an active direct methanol fuel cell fed with neat methanol, J Power Sources, 219, 325-332.
- Niknam, T., Golestaneh, F., Malekpour, A. (2012) Probabilistic energy and operation management of a micro grid containing wind/photovoltaic/fuel cell generation and energy storage devices based on point estimate method and self-adaptive gravitational search algorithm, J Energy, 43, 427-437.
- Niu, X.D., Munekata, T., Hyodoa, S.A. &Suga, K. (2007)An investigation of water-gas transport processes in the gas-diffusion-layer of a PEM fuel cell by a multiphase multiple-relaxation-time lattice Boltzmann model,Journal of Power Sources, 172, 542–552.
- Oliveira, V.B., Rangel, C.M. & Pinto, A.M.F.R. (2009) Modelling and experimental studies on a direct methanol fuel cell working under low methanol crossover and high methanol concentrations,International Journal of Hydrogen Energy, 34, 6443-6451.
- Okur, O., Alper, E., Almansoori, A. (2014) Optimization of catalyst preparation conditions for direct sodium borohydride fuel cell using response surface methodology, J Energy , 67, 97-105.
- Oliveira, V.B., Rangel, C.M. & Pinto, A.M.F.R. (2010)Effect of anode and cathode flow field design on the performance of a direct methanol fuel cell, Chemical Engineering Journal, 157, 174–180.
- Oliveira, V.B., Simões, M., Melo, L.F., Pinto, AMFR. (2013) A 1D mathematical model for a microbial fuel cell, J Energy , 61, 463-471.
- Park, J. & Li, X. (2008)Multi-phase micro-scale flow simulation in the electrodes of a PEM fuel cell by lattice Boltzmann method,Journal of Power Sources, 178, 248–257.
- Park, J., Matsubara, V & Li, X. (2007)Application of lattice Boltzmann method to a micro-scale flow simulation in the porous electrode of a PEM fuel cell,Journal of Power Sources, 173, 404–414.
- Rosenthal, N.S., Vilekar, S.A., Datta, R. (2012) A comprehensive yet comprehensible analytical model for the direct methanol fuel cell, J Power Sources, 206, 129-143.
- Scott, K., Argyropoulos, P. & Sundmacher, K. (1999) A model for the liquid feed direct methanol fuel cell, Journal of Electroanalytical Chemistry, 477, 97–110.
- Scott, K., Jackson, C. & Argyropoulos, P. (2006) A semi empirical model of the direct methanol fuel cell, Part II. Parametric analysis, Journal of Power Sources, 161, 885–892.
- Scott, K., Taama, W.M., Kramer, S., Argyropoulos, P. & Sundmacher, K. (1995)Limiting current behavior of the direct methanol fuel cell,Electrochemica Acta, 45, 945-957.
- Scott, K., Taama, W. & Cruickshank, J. (1997)Performance and modeling of a direct methanol solid polymer electrolyte fuel cell,Journal of Power Sources, 65, 159-171.
- Succi, S. (2001) The Lattice Boltzmann Equation for Fluid Dynamics and Beyond, Clarendon Press, Oxford.
- Wang, L.P. & Afsharpoya, B. (2006)Modeling fluid flow in fuel cells using the lattice-Boltzmann approach,Mathematics and Computers in Simulation, 72, 242–248.
- Wang, Z.H. & Wang, C.Y. (2003)Mathematical modeling of liquid-feed direct methanol fuel cell,Journal of the Electrochemical Society, 150, A508–A519.
- Wasselynck, G., Auvity, B., Olivier, J.C., Trichet, D., Josset, C., Maindru, P. (2012) Design and testing of a fuel cell powertrain with energy constraints, J Energy, 38, 414-424.
- Xu, H., Dang, Z., Bai, B. (2014) Electrochemical performance study of solid oxide fuel cell using lattice Boltzmann method. J Energy, 67, 475-583.
- Zerbinati, O., Mardan, A. & Richter, M.M. (2002)A Direct Methanol Fuel Cell,J. Chem. Educ., 79, 829-831.


