
International Journal of Energy Science and Engineering, Vol. 1, No. 2, May 2015 Publish Date: Apr. 22, 2015 Pages: 60-70
Thermodynamic Evaluation of the Performance of a Combined Cycle Power Plant
Thamir K. Ibrahim1, 2, *, Marwah N. Mohammed3
1Faculty of Mechanical Engineering, University Malaysia Pahang, Pekan, Pahang, Malaysia
2Mechanical Engineering Departments, Collage of Engineering, Tikrit University, Tikrit, Iraq
3Faculty of Chemical, Natural Resources Engineering, University Malaysia Pahang, Gambang, Pahang, Malaysia
Abstract
A clean and safe energy is the greatest challenge to meet the requirements of green environment. These requirements given way the long time governing authority of steam turbine (ST) in the world power generation, and gas turbine (GT) and its combined cycle (CCGT) will replace it. Therefore, it is necessary to predict the characteristics of the CCGT system and modeling its operating parameters by developing a simulation system. Increases the cycle peak temperature ratio and peak compression ratio have been proposed for improving the combined-cycle gas-turbine performance. The code of the performance model for CCGT power plant was developed utilizing the MATLAB software. The results from this simulation present that the combined cycle CCGT has the high overall thermal efficiency of 58% with an increase of the peak compression ratio and cycle peak temperature ratio of 24 and 5.3 respectively. The total power output increases with an increase of cycle peak temperature ratio and decrease of the compression ratio. The peak overall efficiency occurs at the higher compression ratio with low ambient temperature and higher turbine inlet temperature, while, the overall thermal efficiencies for CCGT are higher compared to the thermal efficiencies of the gas turbine and steam turbine power plants. Thus, it can be understood that the models developed in this study are useful tools for estimation of the CCGT power plant’s performance.
Keywords
Combined Cycle, Gas Turbine, Cycle Peak Temperature Ratio, Compression Ratio, Thermal Efficiency
Received: March29, 2015
Accepted: April 15, 2015
Published online: April 20, 2015
@ 2015 The Authors. Published by American Institute of Science. This Open Access article is under the CC BY-NC license. http://creativecommons.org/licenses/by-nc/4.0/
1. Introduction
Thermal-power plants began to gain strength in the world after the demand for diversification of the generating capabilities and the availability of natural gas, which is the main kind of fuel used by this type of generating unit. The operation of thermal-power plants is considerably more complex than the operation of hydroelectric plants, because of the use of working fluids at high temperature and pressure and the consequent difficult operational conditions of the metal tubes, heating surfaces, turbine’s combustion-chamber, casing, headings, etc. In addition, one must also consider the need for complex automatic control systems, and the effort needed for maintaining operational high efficiency and reliability [1,2].
The gas turbine is one of the most satisfactory mechanical power-producing engines in industry. The main feature of a gas turbine which distinguishes it from others is its operation logic [3]. Thermodynamic processes such as compression, combustion, and expansion are performed in individual and special components: mainly, compressor, combustion chamber, and turbine. Overall performance calculation of gas turbines covers the interrelated thermodynamic analysis of these components and can be executed with the help of the Brayton cycle [6,4]. Generally, the principle of the gas turbine cycle is that air is compressed by the air compressor, and transferred to combustion chamber (CC) in order to combine with fuel for producing high-temperature flue gas. Afterward, high-temperature flue gas will be sent to gas turbine, which connected to the shaft of generator for producing electricity [5].
The simple combined cycle gas turbine power plant continues to be one of the world's most efficient fossil fuel to electricity converters. The growth continues to boost gas turbine power plant performance and increase turbine inlet temperature and it has been recommended [6]. Combined Cycle Gas Turbine Power Plants (CCGT) and related technologies have been mature sufficient attributable almost 40 years of experience and carrying out in power generation field [7]. The design of CCGT power plants is intrinsically complex due to the presence of two different power cycles which are joined through the HRSG [8]. The performance of the whole system robustly depends on the optimal incorporation between the power units. As widespread carry out, gas and steam turbines are selected within a set of commercially obtainable ones, whereas the HRSG is the component of a CCGT cycle which can be made particularly for each gas turbine unit and for each specific power plant [9].
The first HRSG used in CCGT plants was of the style at single pressure level. The use of this particular solution is continued in recent years to power plants of small medium power generation (60-70 MW) and seldom in plants of size over 100 MW. The beginning of the second pressure levels HRSG started in the second half of the 1980s characterized a new industrial development that has led at the end of the last century to the introduction of systems with 3 pressure levels with reheater [10]. Considering the working mode of CCGT power plants it appears about two-thirds of the total power is generated by the gas turbine cycle and one-third by the steam turbine cycle so the reference value of the power output of the gas turbine is of 200 MW [11]. The maximum pressure of the HRSG ranges between 120 and 165 bars. Most of the installed CCGT power plant used the outlet temperature of the gas turbine around 850 K [12].
The overall efficiency can be increased with both environmental and economic benefits from used the combined cycle when some of energy loss can be recovered by the HRSG and then converted it to useful energy. The performance of the CCGT depends on the individual performance of the gas and steam turbine cycle [13]. Consequently, a comparison study of effective parameters (compression ratio and steam pressure) on the overall power outputs, steam mass flow rate, overall thermal efficiencies and heat rate requires managing the parameters of the system. Thus, the aim of the present study is to develop thermodynamic analysis to enhance the overall performance of CCGT utilizing the effect of the compression ratio, ambient temperature, turbine inlet temperature andair fuel ratio.
2. Modeling of Combined Cycle Gas Turbine
A CCGT power plants having Brayton cycle based topping cycle and Rankine cycle based bottoming cycle have been considered in the present study and analysis. Gas turbine power plants consist of four components, compressor, combustion chamber, turbine and generator. Air is drawn in by the compressor and delivered to the combustion chamber. Liquid or gaseous fuel is commonly used to increase the temperature of compressed air through a combustion process. Hot gases leaving the combustion chamber expands in the turbine which produces work and finally discharges to the atmosphere (stages 1, 2, 3 in Fig. 2)[3]. The waste exhaust gas temperature from gas turbine decreases as it flows into the heat recovery steam generator (HRSG), which consists of superheater, evaporator and economizer. Then the HRSG supplies a steam for the steam turbine in producing electricity. In the latter, the waste condensate from the steam turbine will be flowed into a condenser, where cooling water transfers waste heat to the cooling tower. In the final stage, feed water is the output from a condenser, which is suctioned by the feed water pump and sent to the heat recovery steam generator and so on [14].
3. Gas Turbine Model
Four components known as compressor, combustion chamber (CC), turbine and generator can be found in the GT power plants. Figure 1 shows the schematic diagram for a simple GT [15]. The compressors draw the air that is subsequently transmitted to the combustion chamber. A combustion process is utilized for increasing the temperature of compressed air through the use of natural gas fuel. The turbine is expanded by hot gases emitting from the combustion chamber. Work is hence produced before being discharged into the atmosphere (refer to 1, 2, 3 and 4 in Figure 2) [16]. For the success of a GT power plant, efficient compression of large air volume is vital [17]. The axial flow compressor and the centrifugal compressor are the two main kinds of compressors [18]. In order to obtain adequate air through the diameter of the compressor, most of the power plants have design compressors. The new design of the compressor has the ability to retain comparatively high efficiency and aerodynamic stability over the operating range together with minimum stages [19].
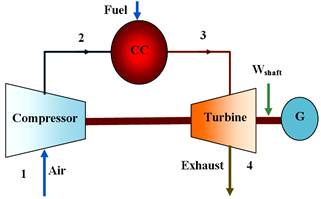
Figure 1. Schematic diagram for simple GT cycle.
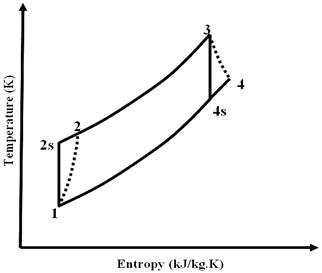
Figure 2. Temperature-entropy diagram for simple GT cycle.
Equation (1) defines the compressor pressure ratio (![]() ) [4]:
) [4]:
![]() (1)
(1)
where![]() and
and ![]() denotes compressor inlet and outlet air pressure, respectively:
denotes compressor inlet and outlet air pressure, respectively:
Equation (2) defines the isentropic efficiency for compressor and turbine that is in the range of 85-90% [10]:
![]() (2)
(2)
where T2s denotes isentropic temperature of outlet compressor, whereas compressor inlet and outlet air temperature are expressed by T1 and T2 respectively. Eq. (3) is used for calculating the outlet temperature of the compressor:
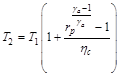 (3)
(3)
where![]() and
and ![]()
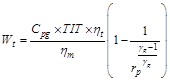
Equation (4) demonstrates the calculation of the work of the compressor (![]() ) without taking into account blade cooling:
) without taking into account blade cooling:
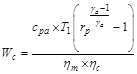 (4)
(4)
where![]() is the mechanical efficiency of the compressor and turbine while
is the mechanical efficiency of the compressor and turbine while ![]() is the specific heat of air which can be fitted by Eq. (5) for the range of 200K<T<800K [19]:
is the specific heat of air which can be fitted by Eq. (5) for the range of 200K<T<800K [19]:
![]() (5)
(5)
where![]() is given in Kelvin.
is given in Kelvin.
Equation (6) demonstrates specific heat of flue gas (![]() ) [19].
) [19].
![]() (6)
(6)
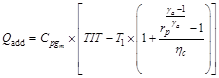
Equation (7) expresses the energy balance in the combustion chamber:
![]() (7)
(7)
where LHV is low heating value, ![]() is specific heat of fuel,
is specific heat of fuel, ![]() is air mass flow rate (kg/s),
is air mass flow rate (kg/s), ![]() is temperature of fuel,
is temperature of fuel, ![]() is fuel mass flow rate (kg/s) and T3=TIT = turbine inlet temperature. Eq. (8) expresses the fuel-air ratio (f) after manipulating Eq. (7):
is fuel mass flow rate (kg/s) and T3=TIT = turbine inlet temperature. Eq. (8) expresses the fuel-air ratio (f) after manipulating Eq. (7):
![]() (8)
(8)
Equation (3.9) depicts the exhaust gases temperature from the gas turbine:
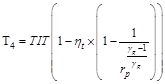 (9)
(9)
Equation (10) depicts the shaft work (![]() ) of the turbine:
) of the turbine:
 (10)
(10)
Equation (11) shows the calculation for the net work of the gas turbine (WGnet):
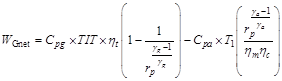 (11)
(11)
while equation (12) expresses the net power output of the turbine (P):
![]() (12)
(12)
where the mass flow rate of the exhaust gases through the gas turbine is denoted by ![]() and Eq. (13) demonstrates it as:
and Eq. (13) demonstrates it as:
![]() (13)
(13)
Equation (14) is used for determining the specific fuel consumption (SFC):
![]() (14)
(14)
Equation (15) is another way of expressing the heat supplied:
 (15)
(15)
Equation (16) can now be used for calculating the GT thermal efficiency (![]() ) [19]:
) [19]:
![]() (16)
(16)
4. Steam Turbine Cycle Model
It is assumed that the steam turbine efficiency and the pump efficiency are represented ![]() and
and![]() , respectively. The ideal and actual processes on the temperature-entropy diagram are represented in full and dashed line respectively [20].
, respectively. The ideal and actual processes on the temperature-entropy diagram are represented in full and dashed line respectively [20].
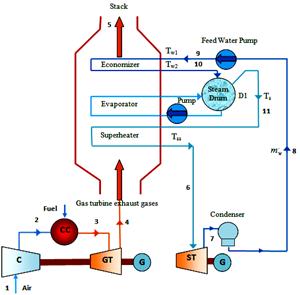
Figure 3. The schematic of a single-pressure combined cycle power plant.
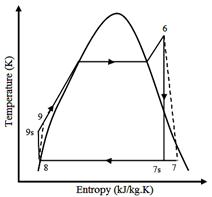
Figure 4. Temperature-entropy diagram for steam turbine plant.
A schematic of the CCGT and bottoming cycle using a single-pressure heat recovery steam generator (HRSG) without reheating is illustrated in Figure 3. To enable burning of natural gas for expansion in the GT, a combustor and a single stage axial flow compressor are included in the GT (topping cycle). For combining with fuel in order to produce high temperature flue gas, the principle of GT states that the air is compressed by the air compressor before being transferred to the combustion chamber (CC). Next, the GT which is linked to the generator’s shaft for producing electricity becomes the recipient of temperature flue gas [21]. In flowing into the HRSG, a decrease becomes imminent in the effluent exhaust gas temperature.
The superheater, economizer and evaporator exist in the HRSG. Electricity is produced with the transmission of steam by the HRSG to the ST. The effluent condensate flows from the ST into a condenser. Over here, waste heat is transferred by the cooling water to the cooling tower [22]. In the last stage, the output from the condenser namely the feed water is suctioned by the feed water pump before transference to the HRSG [23]. The ![]() and
and![]() , represent steam turbine and pump efficiencies, respectively. The solid and dashed lines represent the ideal and actual processes on the temperature entropy diagram illustrated by Figure 4[5].
, represent steam turbine and pump efficiencies, respectively. The solid and dashed lines represent the ideal and actual processes on the temperature entropy diagram illustrated by Figure 4[5].
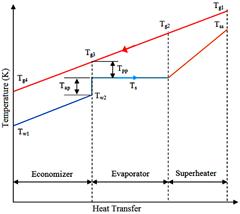
Figure 5. A typical temperature heat transfer diagram for single-pressure HRSG combined cycle.
For the CCGT plant, a single pressure HRSG is classified as a common type. The temperature profile for a single pressure HRSG case containing a superheater, economizer and evaporator is shown in Figure 5. Feed water temperature and blow down are the terminologies used for superheated steam temperature and pressure. Conditions of GT exhaust like temperature exhaust gases, flow rate and compositions are known as well. In the design mode, the aim is also to obtain the steam flow, gas and steam temperature profile. For calculating the HRSG temperature profile, the main parameters are pinch point (![]() ) and approach points (
) and approach points (![]() ). Figure 6 defines them which include steam flow fall, the complete gas and steam temperature profiles [19]. The values for (Tg3) and (Tw2) can be calculated while assumptions are made for the pinch and approach. Hence, as shown in Figure 4, the gas and water properties can be calculated by applying the energy balance for gas and water in every part. The following equations have been solved for obtaining the results as shown in equation (17) expresses the superheater duty:
). Figure 6 defines them which include steam flow fall, the complete gas and steam temperature profiles [19]. The values for (Tg3) and (Tw2) can be calculated while assumptions are made for the pinch and approach. Hence, as shown in Figure 4, the gas and water properties can be calculated by applying the energy balance for gas and water in every part. The following equations have been solved for obtaining the results as shown in equation (17) expresses the superheater duty:
![]() (17)
(17)
The heat loss factor is denoted by ![]() commonly lying in the range from 0.98 to 0.99 [4].
commonly lying in the range from 0.98 to 0.99 [4].
The approach points (![]() ) and the designed pinch point (
) and the designed pinch point (![]() ) are the basis for the thermal analysis of the HRSG. Equation (18) expresses the temperature of the gas being emitted from the evaporator:
) are the basis for the thermal analysis of the HRSG. Equation (18) expresses the temperature of the gas being emitted from the evaporator:
![]() (18)
(18)
At superheated pressure, the saturation steam temperature is denoted by Ts. Moreover, equation (19) defines the temperature of the water entering the evaporator.
![]() (19)
(19)
Equation (20) is used for calculating the mass flow rate of the generation steam [10].
![]() (20)
(20)
As defined in equation (21), the energy balance is used for calculating the temperature of the gases that leave the superheater:
![]() (21)
(21)
The trial and error method on equation (21) is performed for calculating the specific heat (![]() ) and Tg2. As shown in Figure 4, the energy balance of the economizer could be considered for calculating the temperature of the exhaust hot gases emitting the HRSG.
) and Tg2. As shown in Figure 4, the energy balance of the economizer could be considered for calculating the temperature of the exhaust hot gases emitting the HRSG.
Equation (22) is another way of demonstrating the heat available from the exhaust gases:
![]() (22)
(22)
where the exhaust temperature of the HRSG is represented by ![]() .
.
The energy balance between states 4 and 5 can be considered for calculating the temperature of the hot gases leaving the HRSG. This is shown in Figure 3. [10].
![]() (23)
(23)
The ST becomes the recipient of the high pressure and high temperature steam obtained from the HRSG [10]. Figure 4 shows the energy balance.
![]() (24)
(24)
Equation (25) expresses the heat rejected from the condenser:
![]() (25)
(25)
The pump extracts the condensate from the condenser which is then elevated to the economizer pressure. Equation (26) presents the corresponding work:
![]() (26)
(26)
Hence, the ST power plant’s net work is:
![]() (27)
(27)
The ST power plant’s efficiency is:
![]() (28)
(28)
Equation (29) represents the overall thermal efficiency of the CCGT power plant:
![]() (29)
(29)
5. Results and Discussion
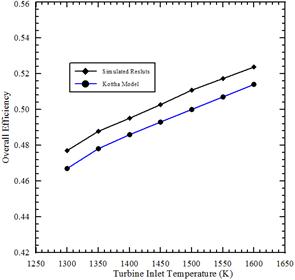
Figure 6. Comparison between simulated overall efficiency of the combined cycle and Kottha model with the effect of the turbine inlet temperature.
This study presents the characteristics of the power output, thermal efficiency and specific fuel consumption for the Single pressure CCGT power plants. The performance of the CCGT affected by the cycle peak temperature ratio, compression ratio, air to fuel ratio, and isentropic compressor and turbine efficiency of the gas turbine. The results of the proposed CC GT power plants are presenting the operational modelling and power plant operating to enhance overall performance. The effects of these parameters on the power output and efficiency are obtained by the energy-balance utilizing MATLAB code. The difference between the overall thermal efficiency of current model and Kottha model with effect of turbine inlet temperature is shown in Figure 6. This comparison plot for same plants parameters. It is apparent that, the overall thermal efficiency was increase with increase the turbine inlet temperature. The simulation results were satisfactory and get a higher overall thermal efficiency compared with Kottha model [17]. It is because, Kottha model developed base on approximation value for the specific heat.
On the other hand, the development of the simulation models on the basis of the operating, ambient and design conditions. Figure 7 shows the effect of cycle peak temperature ratio on the overall thermal efficiency of a CCGT for different values of the air fuel ratio. It can be seen that, when the cycle peak temperature ratio increases the overall thermal efficiency also increase, but it is decreasing with increase the air fuel ratio. When the air fuel ratio decrease from 52 to 36 the cycle peak temperature ratio will decrease from 5.7 to 4.1, so the overall efficiency of a CCGT decreases from 55.8% to 53.4%.
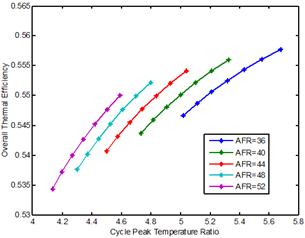
Figure 7. Variation of cycle peak temperature ratio and air fuel ratio on overall thermal efficiency.
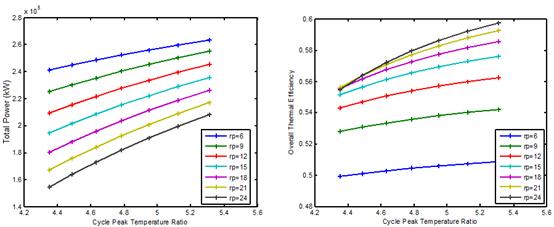
Figure 8 presents a relation between the cycle peak temperature ratios for different values of compression ratio versus the total power outputs, overall thermal efficiency. In Fig 8(a), it can be seen that, the increase in the cycle peak temperature ratio with lower compression ratio, led to increases the total power output. It is because the performance calculations were built with constant turbine inlet temperature. This led to increases the work of compressor with constant work of turbine, so, the net work of the gas turbine will decreases. In Fig 8(b), presents the increases of cycle peak temperature ratio as well as the higher values of the compression ratio have robust significant on increase of the thermal efficiency of the CCGT power plant. However, the variation of overall thermal efficiency of the CCGT power plant is insignificance at lower cycle peak temperature ratio and lower compression ratio.
(a) (b)
Figure 8. Effect of variation of cycle peak temperature ratio on: a) Total power output b) Overall thermal efficiency with effect of different value of the compression ratio with constant turbine inlet temperature.
(a) (b)
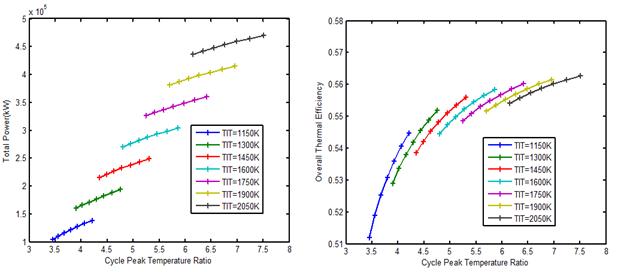
Figure 9. Effect of variation of cycle peak temperature ratioon: a) Total power output b) Overall thermal efficiency with effect of different value of the turbine inlet temperature with constant compression ratio.
Figure 9 presents the effect of cycle peak temperature ratioon total power output and overall thermal efficiency with effect of different value of the turbine inlet temperature with constant compression ratio. The total power output increases with increase the of cycle peak temperature ratio at higher turbine inlet temperature as shown in Fig. 9(a). In Fig. 9(b), is shown that as cycle peak temperature ratio increases as well as turbine inlet temperature, the overall thermal efficiency increases also. However, the variation of overall thermal efficiency is insignificant at higher turbine inlet temperature and higher cycle peak temperature ratio.
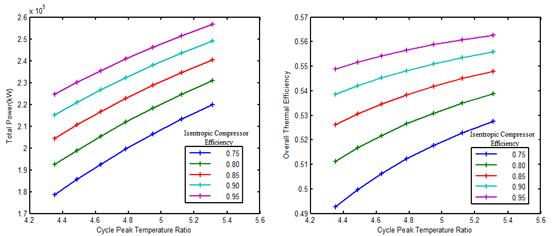
Figure 10 shows the variation of total power output and overall thermal efficiency of the CCGT power plants with effect of the cycle peak temperature ratio and isentropic compressor efficiency of the gas turbine cycle. Fig. 10(a) show that the increase of the cycle peak temperature ratio led to increase the total power output of the CCGT power plants. Also, the total power output of the CCGT power plants will increase with increase of the isentropic compressor efficiency of the gas turbine cycle. The variation of the cycle peak temperature ratio, isentropic compressor efficiency of the gas turbine cycle on overall thermal efficiency of the CCGT power plant is demonstrated in Fig. 10(b). The increase in the cycle peak temperature ratio as well as the isentropic compressor efficiency of the gas turbine cycle leads to the increase of the overall thermal efficiency. As the isentropic compressor efficiency increases, the work required to drive the air compressor is reduced.
(a) (b)
Figure 10. Variation of cycle peak temperature ratio and isentropic compressor efficiency on: a) Total power output b) Overall thermal efficiency.
(a) (b)
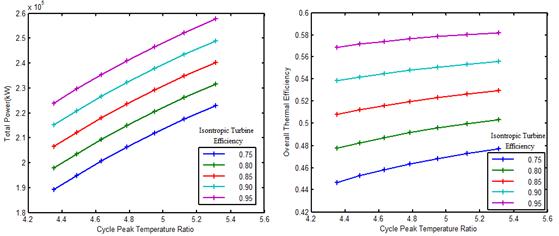
Figure 11. Variation of cycle peak temperature ratio and isentropic turbine efficiency on: a) Total power output b) Overall thermal efficiency.
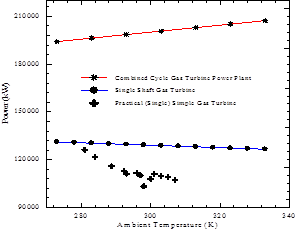
Figure 12. Comparison between simulated power outputs combined cycle and simply gas turbine versus practical results from Baiji gas turbine power plant.
Figure 11 shows the variation of cycle peak temperature ratio and isentropic turbine efficiency on total power output and overall thermal efficiency of the CCGT power plants. In Fig. 11(a), it can be seen that when the cycle peak temperature ratio of the gas turbine increased the total power output was increased. The rise in the turbine isentropic efficiency of the gas turbine, leads to a linear increase in the overall thermal efficiency of the CCGT power plant. The overall thermal efficiency with effect higher cycle peak temperature ratio increases from 47.2% to 58% when the isentropic turbine efficiency increases from 75% to 95% as shown in Fig. 11(b). Figure 12 compares simulated total power outputs of a CCGT and power output of simple gas turbine cycle versus practical results from Baiji gas turbine power plant.
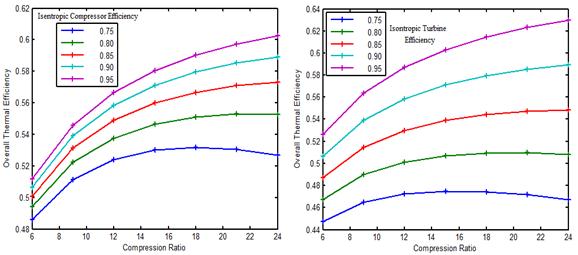
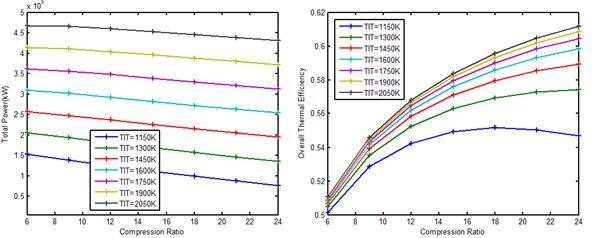
Figure 13 shows the variation of compression ratio, isentropic compressor and turbine efficiencies of the gas turbine cycle on overall thermal efficiency for CCGT power plant. It is noticed that, the overall thermal efficiency of the CCGT power plant increases with compression ratio as well as isentropic compressor and turbine efficiency of the gas turbine cycle. However, the variation of overall thermal efficiency is minor at lower compression ratio while it is very significant at higher compression ratio for both of the isentropic compressor and turbine efficiency. The increase in the power output owing to the reduction in the thermal losses for both the compressor and turbine respectively. The overall thermal efficiency of the CCGT power plant with effect high compression ratio of the gas turbine cycle increases from 53% to 60.9% when the isentropic compressor efficiency increases from 75% to 95% as shown in Fig. 13(a), however, when the isentropic turbine efficiency increases from 75% to 95% the thermal efficiency was increased from 46.9% to 62.8% as shown in Fig. 13(b). Figure 14 presents the variation of the total power output and overall thermal efficiency of the CCGT power plant with effect of the compression ratio and turbine inlet temperature. Figure 14(a) shows the effect of compression ratio as well as higher turbine inlet temperature on the total power output of the CCGT power plant. The increase in the compression ratio and decrease of the turbine inlet temperature of the gas turbine cycle leads to the decrease in the total power output of the CCGT power plant. However, it is observed that at the lower compression ratio, there is a minor variation in the total power output of CCGT power plant, while there is a significant variation at the higher compression ratio. This is due to the increase in the power output of the GT with the compression ratio to a certain value and then decreases.
(a) (b)
Figure 13. Effect of compression ratioon overall thermal efficiency: a) Isentropic compressor efficiency b) Isentropic turbine efficiency.
(a) (b)
Figure 14. Variation of compression ratio andturbine inlet temperature on: a)Total power output b) Overall thermal efficiency.
In Fig. 14(b), is observed that the increase in the overall thermal efficiency of the CCGT power plant with increase of the compression ratio at higher turbine inlet temperature. The deviation of overall thermal efficiency at higher compression ratio is vital for overall thermal efficiency. The turbine inlet temperature is very crucial at higher compression ratio. The overall thermal efficiency at high compression ratio increases from 54.7% to 61.2% with an increase of the turbine inlet temperature from 1150 to 2050K.
6. Conclusion
The simulation model of the CCGT plant with effect the cycle peak temperature ratio and peak compression ratio of the gas turbine has been used for carrying out the thermodynamic study. The simulated model results are summarised as follow:
1. The air to fuel ratio, compression ratio, cycle peak temperature ratio and the isentropic efficiencies are strongly influenced on the overall thermal efficiency of the CCGT.
2. The optimum overall thermal efficiencies of a CCGT compared to the thermal efficiencies of a GT cycle and ST cycle power plants.
3. The overall thermal efficiency increases and total power output decreases linearly with an increase of cycle peak temperature ratio as well as the compression ratio with constant turbine inlet temperature.
Acknowledgements
The authors would like to thank University Malaysia Pahang for providing laboratory facilities and financial support.
References
- Basha, M., Shaahid, S. M. and Al-Hadhrami, L.Impact of Fuels on Performance and Efficiency of Gas Turbine Power Plants. Energy Procedia, 2012; 14: 558-565.
- Thamir K. Ibrahim, Rahman, M. M., Abdalla, A. N. Study on the effective parameter of gas turbine model with intercooled compression process.Scientific Research and Essays, 2010; 5(23): 3760-3770,.
- Cengel Y. A. and Michael A. Thermodynamics an engineering approach, McGraw-Hill Science/Engineering/Math; 8 edition, 2015.
- Thamir, K. Ibrahim, Rahman, M.M., and Abdalla, A.N., Improvement of gas turbine performance based on inlet air cooling systems: A technical review. International Journal of Physical Science, 2011; 6(4): 620-627.
- Thamir K. Ibrahim and Rahman M.M., Effect of the Compression Ratio on the performance of different strategies of the Gas Turbine. International Journal of Automotive and Mechanical Engineering, 2014A; 9: 1747-1757.
- Dechamps, P. J., Advanced combined cycle alternatives with the latest gas turbines. Transactions of the ASME, Journal of Engineering for Gas Turbines Power, 1998; 120(3): 350-357.
- Chandraa, H., Aroraa, A., Kaushik, S.C., Tripathi, A. and Rai, A., Thermodynamic analysis and parametric study of an intercooled–reheat closed-cycle gas turbine on the basis of a new isentropic exponent. International Journal of Sustainable Energy, 2011; 30(2): 82–97.
- El-Hossani, K.M. and Dorosti, Q. Improvement of gas turbine performance test in combine cycle. World Academy of Science, Engineering and Technology,2009; 58: 383-386.
- Erdem, H.H. and S.H. Sevilgen.Case study: Effect of ambient temperature on the electricity production and fuel consumption of a simple cycle gas turbine in Turkey. Applied Thermal Engineering, 2006; 26(2–3): 320-326.
- Thamir K. Ibrahim and RahmanM. M.Effective Parameters on Performance of Multipressure Combined Cycle Power Plants. Advances in Mechanical Engineering Volume 2014 , Article ID 781503, 14 pages.
- Thamir, K. Ibrahim, Rahman, M. M., Sharma, K. V., Influence of operation conditions on performance of combined cycle gas turbine, 3rd International Conference on Mechanical and Electrical Technical (ICMET2011) Dalian, China, August 26-27, 2011; 3, 9-15, ASME Press, Book No.: 859810, ISBN: 978-0-7918-5981-0.
- Dries V. and Carlos B., Impact of heat transfer on the performance of micro gas turbines. Applied Energy, 2015; 138: 445-449
- Godoy, E., Benz, S. J. and Scenna N. J.,A strategy for the economic optimization of combined cycle gas turbine power plants by taking advantage of useful thermodynamic relationships. Applied Thermal Engineering, 2011; 31(5): 852-871.
- Woudstra, N., Woudstra, T., Pirone, A. and Stelt T.,Thermodynamic evaluation of combined cycle plants. Energy Conversion and Management, 2010; 51(5): 1099-1110.
- Rahman, M. M., Ibrahim, T. K., Abdalla, A. N., Thermodynamic performance analysis of gas-turbine power-plant. International Journal of the Physical Sciences, 2011; 6(14): 3539-3550.
- Basrawi, F., Yamada, T., Nakanishi, K. and Naing, S., Effect of ambient temperature on the performance of micro gas-turbine with cogeneration system in cold region, Applied Thermal Engineering, 2011; 31: 1058-1067.
- Kottha, P.R. Parametric optimization of a combined cycle. Master’s Thesis, 2004, Lamar University.
- Carlo C., Federico C. and Beniamino P., Performance Analysis in Off-design Condition of Gas Turbine Air-bottoming Combined System. Energy Procedia, 2014; 45: 1037-1046.
- Thamir, K. Ibrahim, Rahman, M. M., Abdalla, A. N., Optimum Gas Turbine Configuration for Improving the Performance of Combined Cycle Power Plant, Procedia Engineering, 2011; 15: 4216 – 4223.
- Rahman, M. M., Thamir, K. Ibrahim, Taib, M. Y., Noor, M. M., Kadirgama, K. and Rosli, A. Bakar, Thermal analysis of open-cycle regenerator gas-turbine power-plants, World Academy of Science, Engineering and Technology Journal, 2010; 68: 94-99.
- Wei H., Qiang C., Ru-mou L. and Hong-guang J., Assessment of off-design performance of a small-scale combined cooling and power system using an alternative operating strategy for gas turbine. Applied Energy, 2015;138: 160-168.
- Rahman, M. M., Thamir, K. Ibrahim. Kadirgama, K., Mamat, R., Bakar, R. A., Influence of operation conditions and ambient temperature on performance of gas turbine power plant, Advance Materials Research, 2011; 189-193: 3007-3013.
- Yadav, J.P. and Singh, O. Thermodynamic Analysis of Air Cooled Simple Gas/ Steam Combined Cycle Plant. IE(I) Journal-MC, 2006;86: 217-222.


