
International Journal of Energy Science and Engineering, Vol. 1, No. 2, May 2015 Publish Date: Apr. 18, 2015 Pages: 40-48
Integration of Geophysical and Geotechnical Methods to Site Characterization for Construction Work at the School of Management Area, Lagos State Polytechnic, Ikorodu, Lagos, Nigeria
Joseph Olakunle Coker*
Department of Physical Science, Lagos State Polytechnic, Ikorodu, Nigeria
Abstract
Resistivity measurement using 1-D and 2-D resistivity probing techniques and Geotechnical method using Cone Penetrometer Test (CPT) were integrated to delineate the subsurface geology at the School of Management area, Lagos State Polytechnic, Ikorodu. The resistivity measurements were made with Allied Ohmega Resistivity meter. The 1-D vertical electrical resistivity sounding data were obtained using the Schlumberger electrode array while the 2-D resistivity data were obtained using the Wenner array. Two 2.5 tonnes Cone Penetration Test (CPT) and one borehore log was used for control. The acquired VES data were processed and interpreted using partial curve matching technique and 1D computer assisted forward modeling using WinResist software. DiproWin software version 4.0 was to process the 2D data. Based on the results of the investigations, the main lithological unit consists of sandy clay and sand materials It is concluded that the northern part of the study area consist of sandy clay, a mechanically unstable soil formations which is capable of being inimical to building structures and the southern part consist of the sand layer which is viewed as the only competent geo-material for the foundation of any engineering structures within the study area.
Keywords
Cone Penetration Test, Schlumberger Array, Subsurface Geology, Vertical Electrical Sounding, Wenner Profiling
Received: March 22, 2015
Accepted: April 6, 2015
Published online: April 17, 2015
@ 2015 The Authors. Published by American Institute of Science. This Open Access article is under the CC BY-NC license. http://creativecommons.org/licenses/by-nc/4.0/
Contents
1. Introduction 2. Location and Geological Setting of the Study Area 3. Methodology 3.1. Geophysical Investigation 3.2. Geotechnical Investigation 4. Data Processing and Interpretation 4.1. Vertical Electrical Sounding (Schlumberger Array) 4.2. 2D Imaging (Wenner Profiling) 4.3. Geoelectric Section along W1W1 4.4. Cone Penetration Test 4.5. Correlation of VES, 2D Imaging and Cone Penetration Test Data 5. Conclusion Acknowledgment
1. Introduction
In the past few years, the incident of collapse buildings has become frequent as the State’s Tribunal of Enquiry on Building Collapse constituted on May 20, 2013, stated no fewer than 135 buildings collapsed in Lagos in the last seven years. This catastrophe might not be at variance with what is expected since Lagos is overpopulated with its buildings in all its swamps and flood plains with no significant laws to put this to check and lack of quality subsurface investigation prior to any civil engineering works.
In recent years, several organization and private individuals have been engaging in infrastructural development but recent studies showed that many of them do not engage the services of professionals in order to maximize profits; the effect being poor building constructions which may ultimately lead to gradual or sudden collapse of such structures (Oyedele and Olorode, 2010).
The upgrading of the Lagos State Polythenic, Ikorodu, Lagos, with more buildings call for proper subsoil investigation for civil engineering works to avoid building collapse as well as the catastrophic effect to staff and students if the eventuality occurred.
Geophysical and geotechnical methods are mostly integrated to complement each other. While geotechnical investigation of the soil is discrete, invasive and expensive; geophysical investigation is continous, non-invasive and cost-effective.
Ayolabi et al. (2012) discussed the necessity of a holistic approach to foundation investigation prior to the erection of structures as a panacea to environmental and engineering tragedy of our time, due to the high spate of collapse of buildings and/or differential settling of structures in Lagos. In his work a 2D electrical resistivity tomography (ERT) and geotechnical investigation was carried out at Ogudu Estate in Lagos, Nigeria. The study shows that foundation investigation needs to be complemented with geophysical survey. By this, where the engineering soil tests terminate, geophysical survey could continue and could be a veritable tool to decipher deeper subsurface structures inimical to engineering construction.
Fakere et al. (2012) investigated the causes of structural failures of an ongoing Naval Building development in Abuja, Nigeria. A series of site investigation and inspections were carried out at the site of the collapsed building. The findings shows that improper demolition method, coupled with its dangerous nature, contributed to the collapse of the building. The coarse aggregates used in the construction contained impurities like biotite and muscovite, which are oxidizing agents capable of accelerating building collapse. Based on the results obtained through this study as well as the recommendations on them, the further occurrence of building collapse will be greatly reduced.
According to Ibrahim (2013) every built structure is expected to satisfy the functional objectives of safety, serviceability and economy. The cost of building collapse in terms of human lives, economic waste, loss of investment, jobs, income, etc., are of unmeasured account. It is against this backdrop that in his study, he examines the monumental effect of building collapse in Nigeria using Lagos Island as case study. It was found out from chi-square statistics that building collapse have significant effect on various aspect of human life such as physical and human development, landscape structure, infrastructure, security, among many others. The need for State and Federal Government, and other stakeholders to intensify efforts toward curbing the ugly trend is highlighted.
A combined geophysical and geotechnical investigations offer very useful approach for characterizing near surface earth and thus can help in preparation before engineering structures are found on same (Coker et al, 2013).
Coker J.O. (2015) uses geophysical and geotechnical methods with the aim of assessing the characteristics of subsurface layers to identify area of competent soil to support any proposed structures in Library complex area of Lagos State Polytechnic, Ikorodu, Lagos. A total of six Schlumberger vertical electrical sounding (VES), three 2D electrical resistivity imaging using Wenner configuration, were acquired with Allied Ohmega Resistivity meter, two 2.5 tonnes Cone Penetration Test (CPT) and one borehore log was used for control. The acquired VES data were processed and interpreted using partial curve matching technique and 1D computer assisted forward modeling using WinResist software. DiproWin software version 4.0 was used to process the 2D data. The integration of the VES results and 2D resistivity imaging data reveal four geoelectric layers which composed of topsoil, sandy clay, sand and coarse sand. It is concluded that investigated area has competent sand layer that can support medium to giant engineering structures with resistivity values that vary from 180 and 259.5 ohm-m and corresponding thickness values that vary from 25.8 and 43.9m.
Resistivity measurement using 1-D and 2-D resistivity probing techniques and Geotechnical method using Cone Penetrometer Test (CPT) were employed to delineate the subsurface geology at the School of Management area, Lagos State Polytechnic, Ikorodu.
Geotechnical and geophysical surveys are often the most cost-effective and rapid means of obtaining subsurface information, especially over large study area (Oyedele and Bankole, 2009; Sirles, 2006; Fatoba and Olorunfemi, 2004).
2. Location and Geological Setting of the Study Area
The study area Ikorodu, is part of Lagos State located within the Federal Republic of Nigeria (Fig.1). The Geology of Nigeria is dominated by crystalline and sedimentary rocks both occurring approximately in equal proportions (Ayolabi et al, 2012).
The geology of Lagos and its environs is an integral part of Dahomey Basin, which is the Eastern part of Sedimentary Basin that extends from Volta Delta state in Ghana to Okitipupa ridge in Nigeria. Lagos belongs to the Coastal Plain Sand formation which is made up of loose sediment ranging from silt, clay and fine to coarse grained sand.
The site of investigation is the School of Management area, Lagos State Polytechnic, Ikorodu. Ikorodu is a suburb of Lagos which is purely sedimentary and falls in Dahomey Basin. It consists of thick shale in its Northern part with Coastal Plain Sand in its Southern end according to Jones and Hockey (1964), Omatshola and Adegoke (1981), Enu (1985) and Nton (2001).
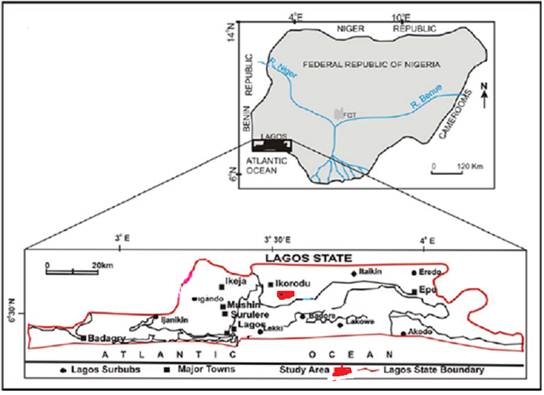
Figure 1. Map of Nigeria inset Map of Lagos State showing the study area (Modified from Oyedele, 2011).
3. Methodology
3.1. Geophysical Investigation
The 1-D vertical electrical resistivity sounding data (VES) was obtained using the Schlumberger electrode array with the Allied Ohmega Resistivity meter. Electrode spread (AB) was varied from 2.0m to a maximum of 400m. Six vertical electrical sounding were acquired at the School of Management (Figure2).
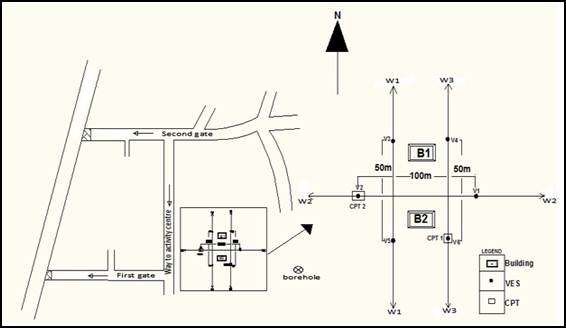
Figure 2. Base map of the study area showing the data points.
One of the newly developments in recent years is the use of 2-D electrical imaging/tomography surveys to map areas with moderately complex geology (Griffiths and Barker 1993). Such surveys are usually carried out using a large number of electrodes, 25 or more, connected to a multi-core cable. A laptop microcomputer together with an electronics switching unit is used to automatically select the relevant four electrodes for each measurement. The spacing was varied for 10m, 20m, 30m, 40m, 50m and 60m in turns. After that, the measurements are taken automatically and stored in the computer. Three traverses (profiles) were considered in the North-South and East-West Directions of the study area. Borehole data was used to constrain the resistivity interpretation for different lithological Formations.
3.2. Geotechnical Investigation
The geotechnical technique employed was the Cone Penetrometer Test (CPT). This test is a continuous measurement of resistance to penetration of the cone tip ![]() and frictional resistance
and frictional resistance![]() (Lunne et al, 1997 and Coerts, 1996). Measurements can also be made of other soil parameters using more specialized cones such as pore water pressure (piezocone), electrical conductivity, shear wave velocity (seismic cone), pressuremeter cone, etc. Equation (1) shows the relationship between cone end resistance and sleeve frictional resistance.
(Lunne et al, 1997 and Coerts, 1996). Measurements can also be made of other soil parameters using more specialized cones such as pore water pressure (piezocone), electrical conductivity, shear wave velocity (seismic cone), pressuremeter cone, etc. Equation (1) shows the relationship between cone end resistance and sleeve frictional resistance.
![]() Equation 1.
Equation 1.
Where ![]() frictional ratio
frictional ratio
Two CPT tests were conducted in the study area corresponding to a VES points on a profile to constrain the geophysical results. 600 cone head was penetrated to the ground through a set of 1m long rods. Measurements were taken at every 0.25m penetration of the rod into the ground.
4. Data Processing and Interpretation
4.1. Vertical Electrical Sounding (Schlumberger Array)
After converting resistance to resistivity by multiplying with appropriate geometrical factors for the Schlumberger array, the VES data were plotted on log-log graphs with apparent resistivity (![]() ) and half electrode separation (
) and half electrode separation (![]() ) values on the ordinate and abscissa respectively. The resultant curves were interpreted qualitatively through visual inspection and quantitatively through partial curve matching technique to generate the layered apparent resistivities and thickness. The results were further iterated using WINRESIST computer software.
) values on the ordinate and abscissa respectively. The resultant curves were interpreted qualitatively through visual inspection and quantitatively through partial curve matching technique to generate the layered apparent resistivities and thickness. The results were further iterated using WINRESIST computer software.
Table 1. Summary of the VES Results for School of Management.
| VES NO | LAYERS | RESISTIVITY (Ωm) | THICKNESS (m) | DEPTH (m) | CURVE TYPE | INFERRED LITHOLOGY |
| 1 | 1 | 49.5 | 0.2 | 0.2 | AK | Topsoil |
| 2 | 320.5 | 6.6 | 6.8 | Sand | ||
| 3 | 652.6 | 23.6 | 30.4 | Coarse sand | ||
| 4 | 290.3 | Sandy clay | ||||
| 2 | 1 | 729.1 | 0.6 | 0.6 | KH | Topsoil |
| 2 | 1094.6 | 6.0 | 6.6 | Coarse sand | ||
| 3 | 598.9 | 19.3 | 25.9 | Sandy clay | ||
| 4 | 621.2 | Sand | ||||
| 3 | 1 | 705.0 | 0.6 | 0.6 | KH | Topsoil |
| 2 | 871.2 | 6.0 | 6.6 | Coarse sand | ||
| 3 | 483.0 | 19.3 | 25.9 | Sandy clay | ||
| 4 | 491.7 | Sand | ||||
| 4 | 1 | 2459.3 | 2.1 | 2.1 | Topsoil | |
| 2 | 695.1 | 15.1 | 17.2 | Coarse sand | ||
| 3 | 567.4 | 33.4 | 50.7 | Sand | ||
| 4 | 255.9 | Sandy clay | ||||
| 5 | 1 | 313.1 | 0.9 | 0.9 | KH | Topsoil |
| 2 | 1243.1 | 5.8 | 6.7 | Coarse sand | ||
| 3 | 442.1 | 34.5 | 41.2 | Sandy clay | ||
| 4 | 682.8 | Sand | ||||
| 6 | 1 | 514.1 | 0.4 | 0.4 | KQ | Topsoil |
| 2 | 1313.4 | 6.6 | 7.0 | Coarse sand | ||
| 3 | 652.1 | 37.9 | 45.0 | Sand | ||
| 4 | 340.3 | Sandy clay |
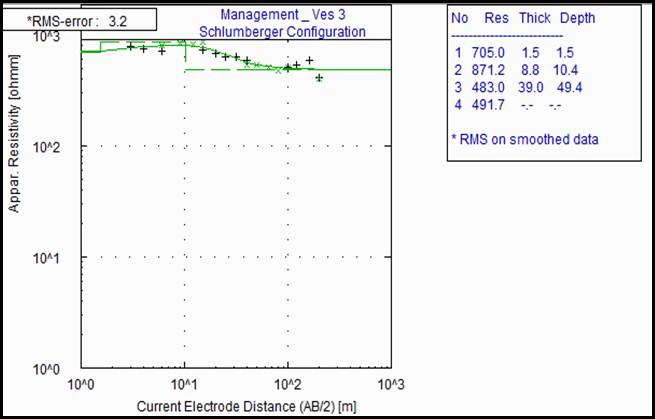
Figure 3. Sample of 1-D resistivity model curve for VES 3.
Table 1 shows the summary of the interpreted VES results with its inferred lithology for the School of Management. Figure 3 present the 1-D resistivity model curves of the study area for VES 3. The computer iterated curves showed a smooth geometry of four layers, characteristics of a typical sedimentary terrain. The curve types identified within the study area include KQ, QQ, KH and AK type with the KH as the predominant curve type.
Beneath VES 1 to 6, Table 1 interpreted, the data reveal maximum of four geoelectric layers which compose of topsoil, coarse sand, sandy clay and sand. The topsoil of the lithology has a relatively high resistivity between the range 313.1 and 2459.3 ohm-m and thickness range of 0.2 to 2.1m, the high resistivity values of the topsoil is attributed to the hard nature of soil deposits in the study area. The second layer has same lithology for VES 2 to VES 6 which is coarse sand except VES 1. The resisitivity range and the thickness are 320.5 – 1313.4 Ωm, and 6.6 - 17.2m respectively.
The weathered layer lithology for VES 2, 3 and 5 is mainly sandy clay a non - competent materials with thickness values ranging from 19.3 and 34.5.m and a close resistivity values between 442.1 and 598.9 ohm-m. The corresponding last layer is underlain by sand of resistivity 491.7 - 682.8 ohm-m with a range of depth to basement values between 25.9 and 41.2m. Similarly, the weathered layer lithology beneath VES 1, 4 and 6 is sand material with thickness of the sand layer vary from 23.6 to 37.9m with a corresponding resistivity values between 567.4 and 652.6 ohm-m.
4.2. 2D Imaging (Wenner Profiling)
The 2D Wenner resistance data was converted to resistivity by multiplying it with the appropriate geometrical factors of ![]() , where "a" is the spacing. The appropriate resistivity values for the 2D data set were inverted for true subsurface resistivity using DIPROfWIN version 4.0 inversion software and the resulting estimated models presented and interpreted accordingly.
, where "a" is the spacing. The appropriate resistivity values for the 2D data set were inverted for true subsurface resistivity using DIPROfWIN version 4.0 inversion software and the resulting estimated models presented and interpreted accordingly.
A total spread of 220m was surveyed in profile W1W1 as shown in Figure 4 and a depth of 50m was probed from the North – South direction.
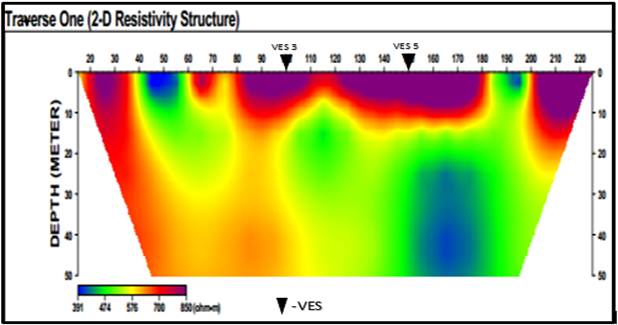
Figure 4. 2D Resistivity pseudo-section for traverse one.
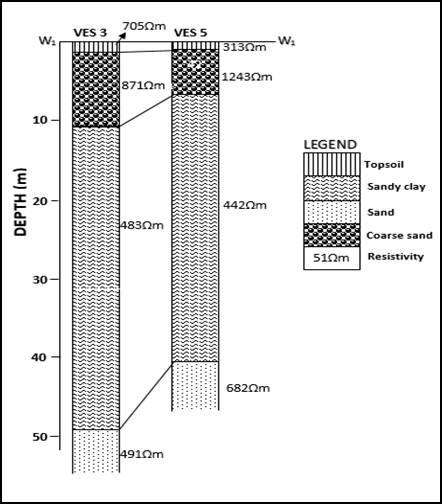
Figure 5. Sample of inferred geoelectric section beneath VES 3 and 5 correlated with borehole log.
The section has resistivity values ranging from 41.0-1193Ωm, the first zone has a resistivity range of 41 – 150Ωm which is indicative of dry clay as the topsoil along the profile which is along lateral distance of 0 – 25m and 90-100m at depth 0 - 6m and 0 - 4m respectively. The clay is also shown to exist within a depth range of 25m – 50m along a lateral extend of 0 – 170m. Other geoelectric units are made up of resistivity range of 160 – 700Ωm and 800 -1193Ωm which stretches along the section from a lateral distance of 20 – 110m and 150 – 220m, which indicates regions of sand and coarse sand to a depth range of about 0 – 20m and 0 – 50m. From the trend of the inferred lithology, it is obvious that the area is essentially made up of sandy clay materials at high depth of 25 – 50m which VES was unable to reveal.
4.3. Geoelectric Section along W1W1
Traverse W1W1, consists of VES 3 and 5 stationed at 90m and 140m. It has four geoeletric layers which varies from topsoil, sandy clay, sand and coarse sand . The topsoil is characterized by resisitivity values ranging from 106.1 - 215Ωm and layer thickness 1 - 1.5m. The second, third and fourth layers have same lithology for VES 3 and VES 5 which are sandy clay, sand and coarse sand respectively. The resisitivity range for the second, third and fourth layers are 131.2 -143.7Ωm, 180 - 259Ωm and 474 – 695.6Ωm respectively. While the thickness of the second and third layers are 9.1 - 10.3m and 35.4 – 43.9m respectively. The thickness of the fourth layer could not be determined because the current terminate at this horizon as shown by the resistivity curves in Figure 3.
4.4. Cone Penetration Test
A linear graph of cone resistance against depth of penetration was done by Excel software. The maximum cone resistance![]() value at refusal was determined. The CPT tests were conducted at same locations as the VES points to constrain the geophysical results.
value at refusal was determined. The CPT tests were conducted at same locations as the VES points to constrain the geophysical results.
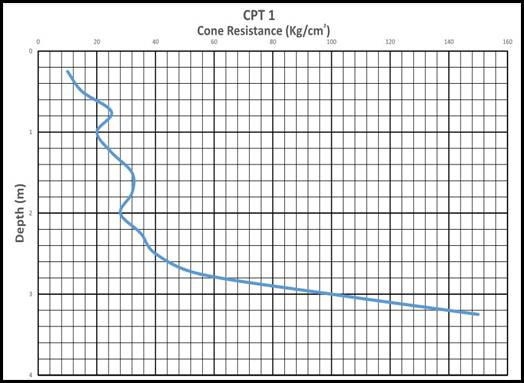
Figure 6. A Graph of Depth (m) against Cone Resistance (kg/cm2) for CPT 1.
The cone resistance reading for CPT 1 was recorded to a depth of 4.2m as shown in Figure 6, before the 2.5 tons Dutch Cone Penetrometer anchor pulled from the surface to a depth of about 2m with a cone resistance of about 20kg/cm2which is indicative of loose to medium dense granular soil and this value remained unchanged from the surface to this depth. While from a depth of 2m – 2.8m, the cone resistance value changed and increased sharply to 70kg/cm2 indicating medium dense granular soil, with this value maintain to a depth range of 2.8m – 4m while from a depth of 4m – 4.2m, the cone resistance readings increases to 180kg/cm2 indicating dense sand. Presence of strange debris in the subsurface might prevent the cone penetrometer from penetrating the soil as it is a point source.
The cone resistance reading for CPT 2 was recorded to a depth of 4.8m as shown in Figure 7, before the 2.5 tons Dutch Cone Penetrometer anchor pulled from the surface to a depth of about 3m with a cone resistance of about 40kg/cm2which is an indicative of loose to medium dense granular soil and this value remained unchanged from the surface to this depth. While from a depth of 3m – 4m, the cone resistance value changed and increased sharply to 72kg/cm2 indicating medium dense granular soil. It should be recorded that, from a depth of 4m – 4.2m, the cone resistance readings increases to 120kg/cm2 indicating dense sand. Presence of strange debris in the subsurface might prevent the cone penetrometer from penetrating the soil as it is a point source.
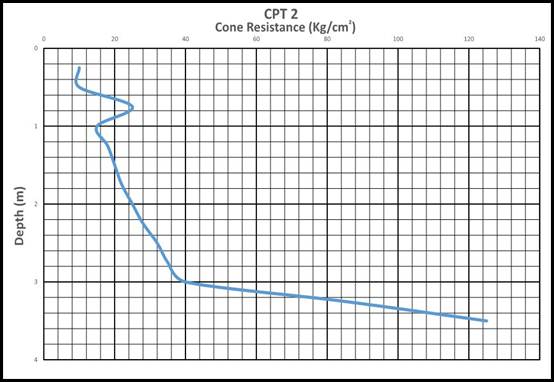
Figure 7. A Graph of Depth (m) against Cone Resistance (kg/cm2) for CPT 2.
4.5. Correlation of VES, 2D Imaging and Cone Penetration Test Data
It is noteworthy that the integration of the three methods revealed similar soil layering consisting of topsoil, coarse sand, sandy clay and sand. The subsurface feature capable of being inimical to engineering works discovered from the geophysical and geotechnical study of the site was the existence of sandy clay as weathered layer in the northern part of the study area. Continuous foundation footings should not be placed on soils consisting of sandy clay layer because the differential settlements caused by such incompetent soils could affect any construction work. In view of this incompetent material, deep foundation in which piles carry super-structural loads to competent soil is recommended for this site.
A mechanically stable sand material as weathered layer was discovered in the southern part of the site which indicates high load bearing capacity suitable for foundation in the area where it occurs and can support massive structures.
5. Conclusion
Based on the results of the investigations, the main lithological unit consists of sandy clay and sand materials. It is concluded that the northern part of the study area consist of sandy clay, a mechanically unstable soil formations which is capable of being inimical to building structures and the southern part consist of the sand layer which is viewed as the only competent geo-material for the foundation of any engineering structures within the study area.
The integration of the VES results and 2D resistivity imaging data reveal four geoelectric layers; geophysical and geotechnical tests showed good agreement. The presence of swampy area at the northern direction is due to the soft nature of soil deposits in the study area and therefore considered unsuitable for any construction work.
This work has showed the importance of combination of geophysical and geotechnical techniques in engineering site characterization.
Acknowledgment
I hereby acknowledged the approval granted to me as beneficiary of year 2013 Tertiary Education Trust Fund (TETF) AST & D grant to undergo this research project. My sincere appreciation also goes to the polytechnic management for this opportunity and kind gesture.
References
- Ayolabi, E.A., Folorunso, A.F. and Jegede, O.E. 2012. The Application of 2D Electrical Resistivity Tomography in Geotechnical Investigations of Foundation Defects, Ogudu Estate as a Case Study, Journal of Geology and Mining Research, 3(12): 142 - 151.
- Coerts, A.O. 1996. Analysis of static cone penetration test data for subsurface modelling. A methodology – PhD Thesis, Nethernals Geographical Studies 210, 263pp
- Coker, J.O. 2015. Geophysical and Geotechnical Assessment of Foundation Failure: A Case Study of Library Complex Area, Lagos State Polytechnic, Ikorodu, Lagos, Nigeria. Research Journal in Engineering and Applied Sciences. Vol.3, No 7
- Coker, J.O., Makinde, V., Adesodun, J.K and Mustapha, A.O. 2013. Integration of Geophysical and Geotechnical Investigation for a Proposed New Lecture Theatre at Federal University of Agriculture, Abeokuta, South Western Nigeria. International Journal of Emerging Trends in Engineering and Development Issue 3, Vol.5: 338-348
- Enu, E. I. 1985. Textural Characteristic of the Nigerian Tar Sands, Sedimentary Geology, 44: 65-81.
- Fakere, A. A., Fadairo, G. and Fakere, R.A. 2012. Assessment of Building Collapse in Nigeria: A Case of Naval Building, Abuja, Nigeria, International Journal of Engineering and Technology (IJET), 2(4): 584-592.
- Fatoba, J.O. and Olorunfemi, M.O. 2004. Subsurface sequence delineation and saline water Mapping of Lagos State, Southwestern Nigeria. Global Journal of Geological sciences 111 – 123pp
- Griffiths, D.H. and Barker, R.D. 1993. Two dimensional resistivity imaging and modelling in areas of complex geology. J Appl Geophys 29:211–226
- Ibrahim, R. B. 2013. Monumental Effects of Building Collapse in Nigerian cities: The case of Lagos Island, Nigeria, Basic Research Journal of Engineering Innovation, 1(2): 26-31.
- Jones, H.A. and Hockey, R.D. 1964. The Geology of Part of South-Western Nigeria, Geological Survey Nigeria Bulletin, 31: 56 - 86.
- Lunne, T; Robertson, P.K and Powell, J.J.M. 1997. Cone Penetration Testing in Geotechnical Practise, Blackie Academic and Professional, London, 312p
- Nton, M.E. 2001. Sedimentological and Geochemical Studies of Rock Units in the Eastern Dahomey Basin, South Western Nigeria, Unpublished PhD thesis, University of Ibadan, 315.
- Omatsola, M.E. and Adegoke, O.S. 1981. Tectonic Evolution and Cretaceous Stratigraphy of the Dahomey Basin, Journal of Mining and Geology, 8: 30-137.
- Oyedele, K.F. and Olorode, D.O. 2010. On Site Investigation of Subsurface Conditions using Electrical Resistivity Method and Cone Penetration Test at ‘Medina Brook Estate, Gbagada, Lagos, Nigeria, World Applied Science Journal, 11 (9): 1097-1104.
- Oyedele, K.F and Bankole, O.O. 2009. Subsurface Stratigraphic Mapping using Geophysics and its impact in urbanization in Arepo area, Ogun State, Nigeria. New York Science Journal (5) 2, pp31 – 45.
- Sirles, P. 2006. Advancement in 3D Subsurface Modelling using Seismic Refraction Data- A new perspective in Proceedings for GEOPHYSICS 2006, 3rd International Conference on Applied Geophysics, St. Louis MO.


