
American Journal of Geophysics, Geochemistry and Geosystems, Vol. 2, No. 5, October 2016 Publish Date: Nov. 21, 2016 Pages: 64-73
Geodynamic and Tectonic Setting of Oman Line in South of Iran
Ghasem Ghorbani Rostam1, Seyed Reza Sakhaei2, Naser Ebadati3, *
1Department of Physics, Sciences Faculty, Islamshahr Branch, Islamic Azad University, Islamshahr, Iran
2Sama College, Islamic Azad University, Islamshahr Branch, Islamshahr, Iran
3Department of Geology, Sciences Faculty, Islamshahr Branch, Islamic Azad University, Islamshahr, Iran
Abstract
We can be considered the Oman Line in the south of Iran as transition zone of two completely different seismotectonic zone, Makran subduction zone in the east and Zagross continental collision zone in the west. Studies of the stress and strain fields are very important in geodynamic analysis. So in this study, the stress and strain fields are considered in around of Oman Line to analyzing this region in terms of geodynamic. To achieve this purpose, amount of stress and their directions calculated by iterative joint inversion. From the east to the west of Oman Line, with transition from Makran to Zagross, the azimuth of maximum horizontal stress, reduced from 4.8° to 2.43°. In the previous studies, the direction of maximum stress is obtained N28° in the Arabian plate and N8° in the Iran. This amount in the world stress map approximated N31° for the Arabian plate. In this research direction of stress resulting from inversion obtained about N8° in the Zagross-Makran transition zone. It seems Zagross collision zone acts as a geodynamic boundary that changes the stress from N31° to N5°. Due to the direction of stress obtained in this study (about N5°) and trend of ZMP fault system (N160°), transpressional mechanism for ZMP is expected. Also mechanism of Sabzevaran-Jiroft -Kahnooj (SJK) fault system with an approximately north-south trending would be strike-slip mechanism. To surveying the strain field, considered the GPS data for finding the velocity vectors. Maximum difference between velocity vector and azimuth of maximum horizontal stress is obtaining 10 degrees in the BABS station, which it is in of transition zone. This cab is a reason for the existence of crushed zone in the Zagross-Makran transition zone. Also, in both sides of transition zone, the azimuth of velocity vector reduced from the west to the east.
Keywords
Stress Field, Strain Field, Inversion of Focal Mechanism, Oman Line
Received: September 16, 2016
Accepted: September 25, 2016
Published online: November 21, 2016
@ 2016 The Authors. Published by American Institute of Science. This Open Access article is under the CC BY license. http://creativecommons.org/licenses/by/4.0/
Contents
1. Introduction
Coloumb, a French physicist, provided Coulomb failure criterion in 1776 [1]. Anderson (1905), Hoskins (1896), and Van Hise (1896), by using of theories Coulomb and other researchers determined the direction of the principal stresses for a conjugate set of pages [2, 3 and 4]. Methods of determining the stress in the crust are divided into two main categories that are as follows: direct methods (e.g. flat jack, hydraulic fracturing and over coring) and indirect methods (e.g. acoustic radiation, borehole failure and fault plane solution). In many studies, geodetic observations are used to determine the pattern of regional strain rate. Shen et al. (1996), Cai and Grafarnd (2007), used a technique known as discretization [5, 6]. Other way is using inversion technique to determine the strain field that Spakmn and Nyst (2002) used this method [7]. Allmendingr et al. (2007) used the nearest neighbor and weighted distance methods, to obtain the velocity fields [8]. In this study, to determination of stress field will be used method of focal mechanism inversion [9]. Also, will employing the GPS datas to determining the strain rate. The target region is Zagross- Makran transition zone in Iran, from 51 to 60°E and 25-30°N (Fig. 2).
2. Tectonic Setting
In the Strait of Hormuz in south of Iran (26.5° N and 56.5° E), the Arabian plate at avelocity of 25-23 mm/ yr (measured by GPS), converges with Eurasia [10, 11, 12, 13 and 14]. Due to convergence of Arabia and Eurasia plates, has been created two different zones: continental collision (Zagross) and oceanic subduction (Makran) in West and East Strait of Hormuz, respectively. The shortening rate of Zagross is obtained about 10 mm/yr by with GPS measurement [15, 16 and 17]. The total amount of shortening, in some studies, about 50 km [18, 19] and according to other studies, about 85 km is estimated [20]. Zagross is very active in terms of seismicity. More than 50 percent of Iran's earthquakes recorded by the global networks have occurred in Zagross [21]. Convergence rate in Makran rises from the West (36.5 mm/yr near the Strait of Hormuz) to East (42 mm/yr in the eastern border Makran) [22, 23]. Transition between Zagross collision zone and Makran subduction zone located in near of Strait of Hormoz. The convergence velocity in Zagross collision zone rises from the northwest to the northeast. This amount in transition zone is from 9±2 mm/yr to 19±2 mm/yr [13, 14]. In West of longitude 57 degrees, shortening associated with the convergence of the Arabian and Eurasian plates has been detected as folding and thrust faulting. In the east of longitude 57 degrees, created accretionary wedge regime in the south Jazmurian subsidence. In many researchs, the transition zones between Zagross and Makran have been described as Oman Line, which extends with trend of N20° E from Musandam peninsula to the north (e.g., [24, 25 and 26]). "Oman Line" separates the continental environment in the West and oceanic crust in the East.
3. Determination of Stress Field
The inversion methos for calculation of stress field based on focal mechanisms are developed by a number of researchers [27, 28 and 29]. There are several common hypotheses in all methods of Inversion [30]:
As for slickenside lineations on exposed fault surfaces, seismic slip is assumed to occur in the direction and sense of the shear stress component resolved on the fault plane [31].
![]() (1)
(1)
Where s is the slip vector and τ is the component of shear stress on the fault plane.
Thus, the inversion of direction of slip vector can not give all the components of the stress tensor. However, this data can be used to identify the principal stress direction and shape ratio R (relative difference between magnitudes of principal stress). Gephart and Forsyth (1984), defined the shape ratio R as below:
![]() (
(![]() (2)
(2)
Where ![]() are principall stresses and
are principall stresses and![]() .
.
The forward problem for a specified fault is as follows: can be calculated slip derections with reduced stress tensor and fault plane geometry, then, we would seek to minimize the calculated slip direction in the inversion. Finding the reduced stress tensor means finding 4 components from 6 components of stress tensor. The other two components (magnitude of maximum shear stress and isotropic component) can not be achieved without supplementary data:
a The physical properties of rocks are assumed to be homogeneous within our region. But, indeed the stress tensor changes in the horizontal and vertical direction. If the stress state is considered for a large region, inversions should be conducted within smaller size cells that fill up the complete region of interest, each sampling volume being small enough for the assumption of stress uniformity to remain valid [32].
b The focal mechanisms considered for the inversion are supposed to sample the unperturbed regional stress field. Hence they must be independent of each other, i.e. they must involve events that are far enough from each other so that stress variations associated with any previous earthquake do not influence in a significant manner the stress field near the event under consideration.
3.1. Michael’s Linear Inversion
If the measured tangential traction on fault planes in a region can be obtained an image of stress field the region [29, 31]. The purpose of stress inversion, is finding the stress tensor, which is cause of faulting. In this way will be used from the shear tension τ and normal tension σn with the following equations:
![]() (3)
(3)
![]() (4)
(4)
Where T is tension and N is direction of unit vector of shear stress. The final equation is:
![]() (5)
(5)
To solving the right side of equation 4, Michael applied the Wallace-Bott hyphothesies and determined the direction of shear stress and slip in fault strike. We can write this equation in Matrix format:
![]() (6)
(6)
t is the vector of stress component.
 (7)
(7)
And A is a matrix based on normal vector n.
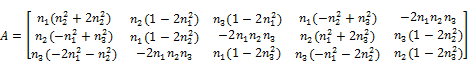 (8)
(8)
Also, s is the direction of slip vector. Finally, can be solved the system of equations with generalized inverse problem [33].
3.2. Iterative Joint Inversion Method
Lund and Slunga applied the fault instability criteria in inversion of Gephart and Forsyth (1984) and improved its performance [28]. But, Iterative joint inversion method used these criteria in Michael’s Method (1984). Michael’s linear inversion method will obtain the direction of principal stresses with accuracy. But, will obtain shape ratio R with a lot of error. Instability criteria will be obtained by following equation [34]:
![]() (9)
(9)
Where:
![]() (10)
(10)
![]() (11)
(11)
The value of instability is from zero (maximum stability) to one (minimum stability).
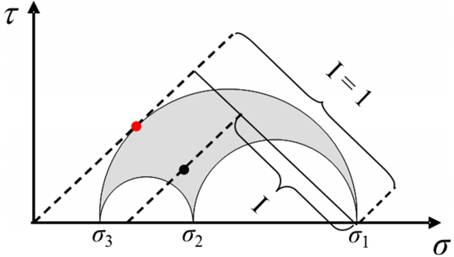
Fig. 1. Fault definition instability in the Mohr's diagram. The red dot marks the tractions of the principal fault (i.e. the most unstable fault in the stressfield, characterized by instability I=1. The black dot marks the tractions of an arbitrarily oriented fault with instabilityI. Quantities τandσare the effective principal stresses [34].
In the algorithm of iterative joint inversion the Michael’s method is first applied in a standard way without considering any constraint and with no knowledge of the orientation of the fault planes. After finding the principal stress directions and the shape ratio, these values are used for evaluating the instability (equation 9) of the nodal planes for all inverted focal mechanisms. The fault planes are the nodal planes which are more unstable. The orientations of the fault planes found in the first iteration are used in the second iteration performed again using Michael’s method. The procedure is repeated until the stress converges to some optimum values. To surveying instability equation with equation 9, we used various values for μ ranging from 0.2 to 1.2. Then, the value producing the maximum instability is reserved for the inversion. Numerical tests show that this iterative inversion is fast and accurate and performance better than linear standard inversion.
In this research, we used focal mechanism data from reliable references, such as:
• Global CMT (Centroid Moment Tensor) Project from 1977 to 2012.
• European Mediterranean Seismological Centre, from 1956 to 1977.
• Iranian seismological centre, from 2012 to 2015.
• Earthquake catalog entitled Basic Parameters of Earthquakes in Iran, and published articles [36, 37].
• For events that occurred after 2012, the focal mechanisms were processed by the ISOLA software developed using broad-band records of seismic stations in the study area [37].
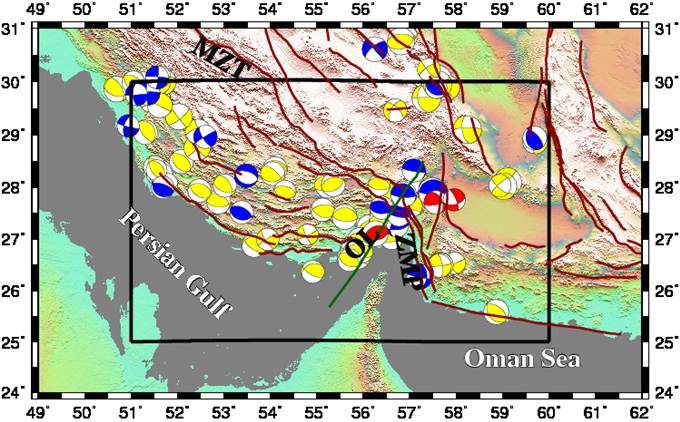
Fig. 2. Major faults location and earthquakes focal mechanisms (MW > 5). Earthquakes depth is showed by three colors. Yellow: < 20 Km, Blue: 20-40 Km and Red: > 40 Km. Also, location of Zendan-Minab-Palami fault system (ZMP), Oman Line (OL) and Main Zagros Thrust (MZT) are represented in figure.
To observe the third assumption (independence focal mechanisms) in this paper selected Pearson's correlation [38], between the rupture radius (r) and seismic moment (M0) and relation between moment magnitude (MW) and seismic moment (M0) was presented [39]:
![]() (12)
(12)
![]() (13)
(13)
Combinations of two equations give me following equation between rupture radius (r) and moment magnitude:
![]() (14)
(14)
According to magnitude of events, the rupture radius will be calculated. Twice the radius of rupture, it is called the radius of Rad. In this study also, to assume the independence of events, the distance of each event with previous events was calculated and the minimum distance (Rmin) was excluded. If the minimum distance is greater than the radius of Rad, this event is selected for the inversion of focal mechanisms. In fact, with this selection, the influence of stress field associated with this event is determined independently.
4. Results of Stress
After removing inappropriate data, based on the distribution of earthquakes we divided the study area into smaller zones, to observe the condition of homogeneous stress field. Thus, the area around the Oman Line is divided into four zones, three zones in the West of Oman line and a zone is located in the East. Available datas and zones considered to be the stress field they will be shown in figures 2 and 3. From total of 157 focal mechanisms available, the number 101 focal mechanisms were chosen for inversion. Table 1 shows the stress direction resulting from the inversion process.
Also, the maximum horizontal stress (SH) were determined in four zones (Table 1 and Fig. 3). The maximum and minimum angle, are accociated with the zone 3 (6.31°) and zone 2 (2.43°), respectively. In both sides (Zones 1 and 2) of Oman Line the maximum horizontal stress is reduced from East to West (from 4.80 degrees to 2.43 degrees). In all of the zones, the maximum stress directions (σ1) are northeast-southwest trending.
In zones 1, 2 and 3 angle of plunge in σ3 is about 90 degrees, and is more than the angle in σ2 and σ1, which represents the reverse faulting in these regions. But, in zone 4, the plunge of σ2 is close to 90 degrees and is more than the plunge in σ1 and σ3, which indicate strike-slip faulting in this zone. The amount of the shape ratio R only in the zone 1 is a medium value (0.54), but in other zones are high values (more than 0.76).
Table 1. Directions of principal stress in around of Oman Line.
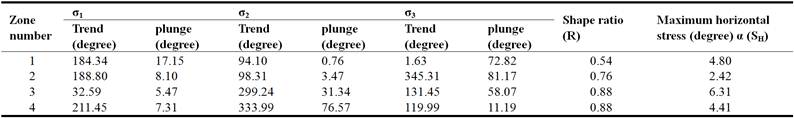
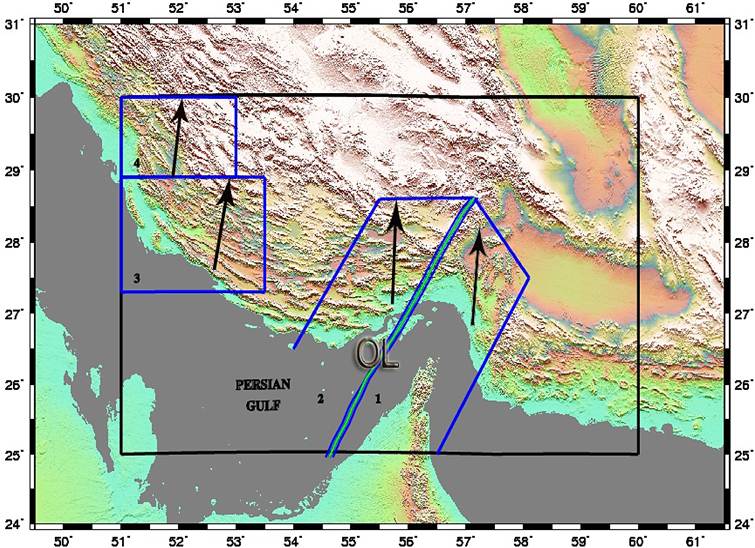
Fig. 3. Stress direction in the study area. Black arrows represent the direction of stress obtained in this paper.
Figure 4 shows the principal stresses in the four zones of Oman line. Also, Figure 5 shows a histogram of shape ratio for the four zones. Minimum and maximum dispersion are related to zones 4 and 3, respectively, which large amount of distribution represents the more error for shape ratio. Confidence limits for stress calculation are represented in Fig. 6, which are very negligible.
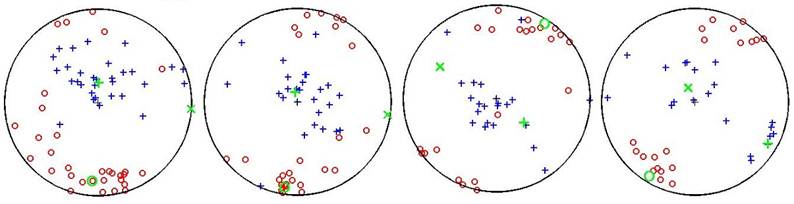
Fig. 4. Diagram of principal stresses in blocks 1 to 4 (left to right, respectively). Circle, cross and plus represents the direction of σ1, σ2 and σ3, respectively. Locations of principal stresses are represented by green color.

Fig. 5. Shape ratio histogram for four blocks. (left to right, respectively).
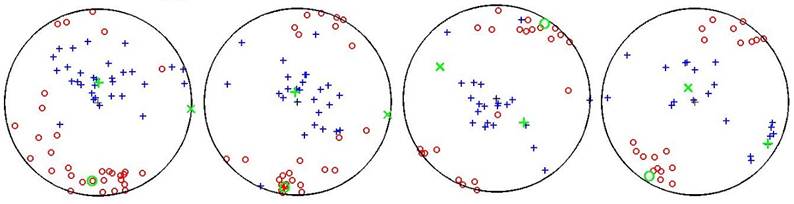
Fig. 6. Confidence limits of principal stress axes in blocks 1 to 4 (left to right, respectively). Red (σ1), green (σ2), blue (σ3).
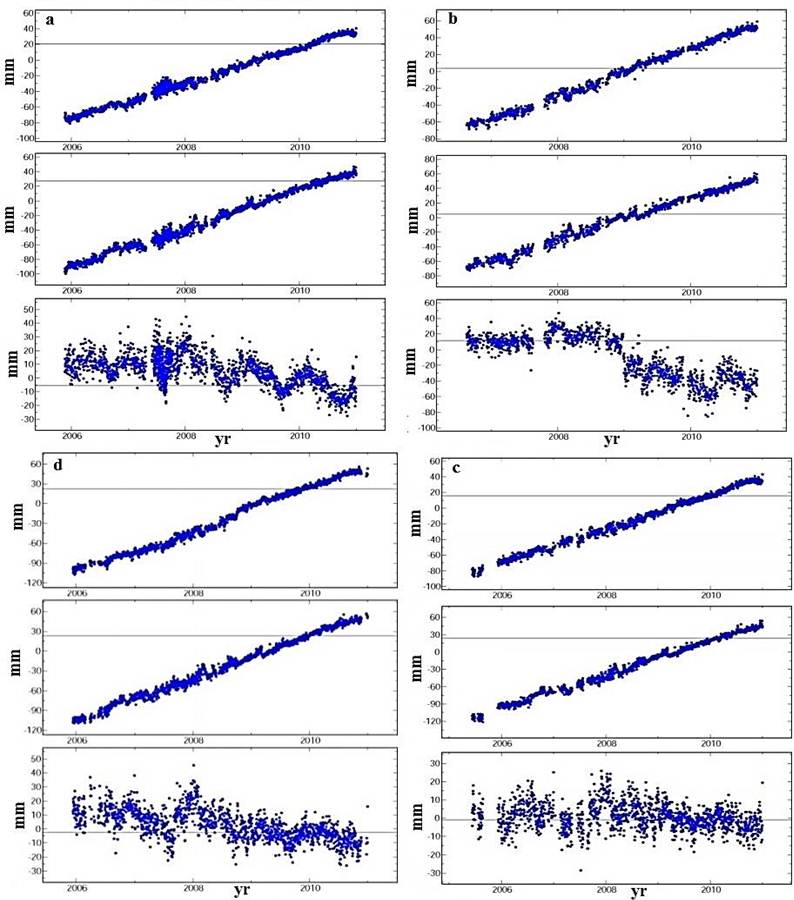
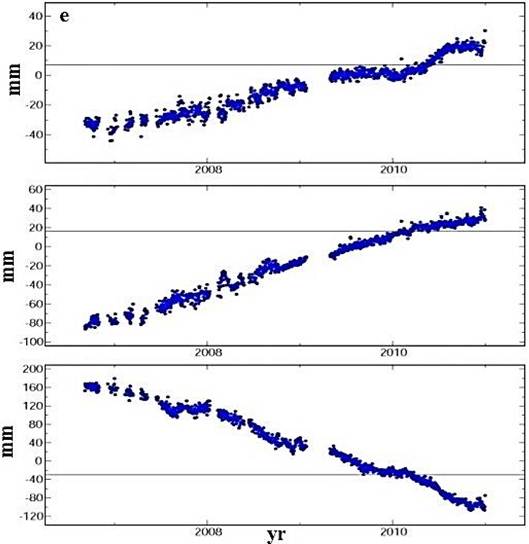
Fig. 7. Time series in the GPS stations. a) Shiraz, b) Lamard, c) Baft, d) Bandar-Abbas and e) Fahraj. Up to down represented respectively East-West, North-South and Height cmponents. Horizontal and vertical axes are respectively time (yr) and displacement (mm).
Strain rate: To finding the strain field, used from GPS permanent network datas in the study area during 2010 and 2011. The network stations record the change of displacement as time series in the three components of north-south, east-west and height (Figure 7), which can be determined velocity vectors by using them. Position and velocity vectors of stations are shown in Figure 8. East-west and north-south components of time series, shows the displacement relative to the fixed reference Eurasia. As can be seen in all the time series (Figure 7), East-West component has been slower than north-south component. Time series of east-west component of Fahraj station unlike other stations do not have regular trend, so in early and late 2010 is its speed downward trend. Elevation components of time series show the amount of subsidence or uplifting. Except BAFT station, in elevation components of other stations can be seen the overall trends of subsidence. Also, zigzag trending in Bandar Abbas and Shiraz can be due to the beginning and end of rainfall seasons and groundwater accumulation.
The maximum and minimum magnitude of the velocity vector, were calculated in stations BABS (23.64 mm/yr) and FHRJ (8.53 mm/yr), respectively. Also, the maximum and minimum angular of velocity vector towards the north are accociated to the stations BABS (15.11 degrees) and SHRZ (-0.38 degree), respectively. According to Table 2 amount of calculations uncertainty is very low.
Table 2. Strain rate related to Eurasian reference frame.
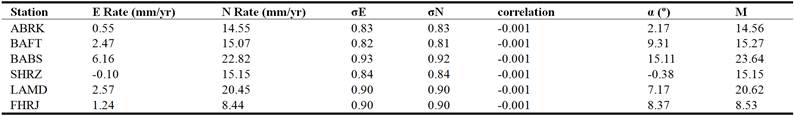
Figure 8 shows the velocity vectors obtained from GPS data in this paper. The azimuth of velocity vector from the West to the East of transition zone first increased and then reduced. Fahraj station (FHRJ) to about 8 mm/yr had the lowest velocity.
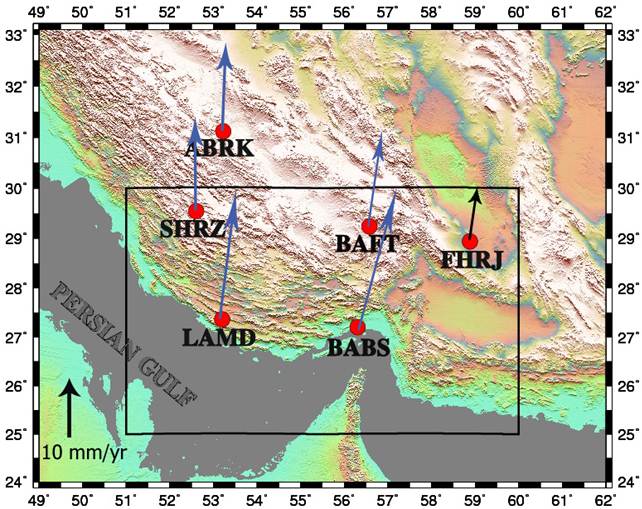
Fig. 8. Velocity vectors estimated from GPS data: collected in this research during the 2010 and 2011 campaigns in Eurasia fixed reference frame. Red circles represent GPS stations. Velocity vectors in the west and the east of Oman-Line is showed by blue and black arrows, respectively.
Bayer et al. [11] calculated the velocity vector direction relative with the fixed reference Arabian plate. These vectors have a clockwise rotation in the transition zone of the Zagross-Makran. If we plot the velocity vectors related to the Eurasian, we will see a counterclockwise rotate. It seems that the reason for the NW-SE trending of ZMP (Zendan-Minab-Palami) fault system.
The maximum horizontal stress obtained from interpolation of more than 6000 world stress map datas (Fig. 9) [40]. The direction of maximum stress in the Arabian plate and Iran are N28° and N8°, respectively. Heidbach et al. (2009) obtained N31° for the direction of stress with boreholes failure method in the Arabian plate at 44.7° E and 19.05° N. In this study, the direction of stress resulting from the inversion in Zagross-Makran transition zone is estimated around N5° (Fig. 3) [41]. It seems Zagross collision zone acts as a geodynamic boundary that changes the stress from N31° to N5°.
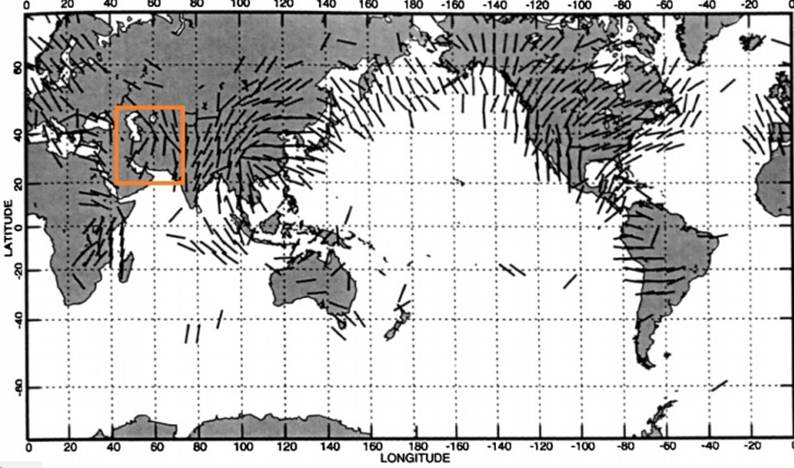
Fig. 9. Maximum horizontal stress direction in the world [40]. Iran is marked square.
5. Conclusion
In this study, direction of the principal stress is determined by the iterative joint inversion method. Also, the strain field using GPS data was reviewed and based on their results, geodynamic analysis was performed.
Maximum amount of velocity vector is observed in Bandar Abbas (BABS), which could be the reason for the existence of crushed zone in the Zagross-Makran transition zone. Maximum azimuth of maximum horizontal stress is obtained up to 6.31 degrees, which is in good agreement with the Arabian plate moving to the Eurasian plate. The results of paleo stress studies, such as Lacombe et al., (2006, 2007) (equivalent to zones 3 and 4) [42, 43] and the Dolati and Burg (2013) in Makran, partly in accordance with the results of this research [45]. The present stress calculated with iterative joint inversion method. In comparison with paleostress, differences in the amount ±20°, but is consistent with the stress on the world stress map.
The dominant stress directions in zones 1, 2 and 3 on the around of Oman Line, indicate the existence of reverse faulting in the Zagross- Makran transition zone. Due to the direction of stress obtained in this study (about N5°) and trend of ZMP fault system (N160°), transpressional mechanism for ZMP is expected. Also, mechanism of Sabzevaran-Jiroft-Kahnooj (SJK) fault system with an approximately north-south trending would be strike-slip mechanism.
In previous syudies, the direction of maximum stress in the Arabian plate and Iran approximated N28° and N8°, respectively, and this value obtained N31° in the Arabian plate at 44.7° E and 19.05° N. According to the direction of stress in Zagross - Makran transition zone, show resulting from the inversion (N5°). It seems Zagros collision zone acts as a geodynamic boundary that changes the stress from N31° to N5°.
In the field strain study based on velocity vectors that obtained from GPS data, was found in Bandar Abbas (BABS) which is adjacent to Oman line, the rate of displacement, both in terms of magnitude and in terms of the azimuth is greater than the other station. On the other hand, is seen only in the station at about 10 degrees difference between directions of the stress and the strain. This shows that the strain field of Zagross-Makran transition zone had the significant changes than the surrounding regions. On either side of transition zone neighbors, azimuth velocity decreases from West to East.
The velocity magnitude vector obtained from GPS data. In Fahraj station have the lowest value. The station is located near Lot stable block, could be due to the small size of the vector. Because central Iran and Lot block is confronted with less surface deformation.
From time series of all GPS stations was observed that the east-west component has been slower than north-south component. There is the overall trend of subsidence in Elevation component of all stations, except BAFT station. Zigzag trending in elevation components of the Bandar Abbas and Shiraz stations can be due to begining and ending the seasons of rainfall and groundwater accumulation.
References
- Coulomb, C. A., (1776); Sur une application des règles maximis et minimis à quelques problèmes de statique relatifs à l'architecture. Mémoires de mathématique and de physique, présentés à l’Académie Royale des Sciences par divers savans. 7, 343–382.
- Anderson, E. M., (1905); The dynamics of faulting. Trans. Edinb. Geol. Soc. 8 (3), 387–402.
- Hoskins, L. M., (1896); Flow and fracture of rocks as related to structure. In: Walcott, D. (Ed.), Sixteenth Annual Report of the United States Geological Survey to the Secre-tary of the Interior 1894–1895: Part 1. USGS, pp. 845–874.
- Van Hise, C. R., (1896); Principles of North American Pre-Cambrian geology. In: Walcott, D. (Ed.), Sixteenth Annual Report of the United States Geological Survey to the Secretary of the Interior, 1894– 1895: Part 1. USGS, pp. 571–843.
- Shen, Z. K., Jackson, D. D. and Ge, B. X., (1996); Crustal deformation across and beyond the Los Angeles basin from geodetic measurements. Journal of Geophysical Research, Vol. 101, 27957–27980.
- Cai, J. and Grafarend, E. W., (2007); Statistical analysis of geodetic deformation (strain rate) derived from the space geodetic measurements of BIFROST Project in Fennoscandia. Journal of Geodynamics, 43, 214–238.
- Spakman, W. and Nyst, M., (2002); Inversion of relative motion data for estimates of the velocity gradient field and fault slip, Earth and Planetary Science Letters, 203 (15), 577–591.
- Allmendinger, R. W., Reilinger, R. and Loveless, J.,(2007); Strain and rotation rate from GPS in Tibet, Anatolia, and the Altiplano, Tectonics, 26, TC3013.
- Vavryčuk, V., (2014); Iterative joint inversion for stress and fault orientations from focal mechanisms. Geophysical Journal International, 199, 69-77.
- Bayer, R., Shabanian, E., Regard, V., Doerflinger, E., Abbassi, M., Chery, J., Nilforoushan, F., Tatar, M., Vernant, P. and Bellier, O., (2003); Active deformation in the Zagros–Makran transition zone inferred from GPS measurements in the interval 2000–2002, Geophysical Research Abstracts, 5, 05891.
- Bayer, R., Chery, J., Tatar, M., Vernant, P., Abbasi, M., Masson, F., Nilforoushan, F., Doerflinger, E., Regard, V. and Bellier, V., (2006); Active deformation in Zagros-Makran transition zone. Geophysical Journal International, 165, 373-381.
- McClusky, S., Reilinger, R., Mahmoud, S., Ben Sari, D. and Tealeb, A., (2003); GPS constraints on Africa (Nubia) and Arabia plate motions, Geophysical Journal International, 155, 126–138.
- Vernant, P., Nilforoushan, F., Hatzfeld, D., Abbasi, M. R., Vigny, C., Masson, F., Nankali, H., Martinod, J., Ashtiani, A., Bayer, R., Tavakoli, F. and Chery, J., (2004); Present-day crustal deformation and plate kinematics in Middle East constrained by GPS measurements in Iran and northern Oman. Geophysical Journal International, 157, 381–398.
- Masson, F., Anvari, M., Djamour, Y., Walpersdorf, A., Tavakoli, F., Daignieres, M., Nankali, H. and Van Gorp, S., (2007); Large-scale velocity fieldand strain tensor in Iran inferred from GPS measurements: new insight for the present-day deformation pattern within NE Iran. Geophysical Journal International, 170, 436–440.
- Tatar, M., Hatzfeld, D., Martinod, J., Walpersdorf, A., Ghafori-Ashtiany, M. and Chery, J., (2002); The present-day deformation of the central Zagros from GPS measurements, Geophysical Research Letters, 29.
- Hessami, K., Nilforoushan, F. and Talbot, C. J., (2006); Active deformation within the Zagros mountains deduced from GPS measurements.Journal of the Geological Society, 163 (1), 143–148.
- Blanc, E. J. P., Allen, M. B., Inger, S. and Hassani, H., (2003); Structural styles in the Zagros Simple Folded Zone, Iran. Journal of the Geological Society, 160, 401–412.
- Molinaro, M., Leturmy, P., Guezou, J. C. and Frizon de Lamotte., (2005); The structure and kinematics of the south-eastern Zagros fold-thrust belt, Iran: from thin-skinned to thick-skinned tectonics. Tectonics, 24, 42–60.
- McQuarrie, N., (2004); Crustal scale geometry of the Zagros fold-thrust belt, Iran. Journal of Structural Geology, 26, 519–535.
- Mirzaei N, Gheitanchi M. R. Naserieh S, Raeesi M, Zarifi Z, Tabaei S. G., (2002); Basic parameters of earthquakes in Iran. Danesh Negar Publications. Tehran.
- Demets, C., Gordon, R. G., Argus, D. F. and Stein, S., (1990); Current plate motions. Geophysical Journal International, 101, 425–478.
- Zarifi, Z., (2006); Unusual subduction zones: case studies in Colombia and Iran, PhD thesis, University of Bergen, Norway.
- Gansser, A., (1964); The geology of the Himalayas, Intersciences, New York, 289.
- Shearman, D. J., (1977); The geological evolution of Southern Iran, the report of the Iranian Makran expedition. Geographical Journal, 142, 393–410.
- Kadinsky-Cade, K. and Barazangi, M., (1982); Seismotectonics of Southern Iran, Tectonics, 5, 389–412.
- Angelier, J., (2002); Inversion of earthquake focal mechanisms to obtain the seismotectonic stress: IV-Anew method free of choice among nodal planes. Geophysical Journal International, 150, 588 – 609.
- Gephart, J. W. and Forsyth, D. W., (1984); An improved method for determining the regional stress tensor using earthquake focal mechanism data: application to the San Fernando earthquake sequence. Journal of Geophysical Researchs, 89, 9305-9320.
- Michael, A. J., (1987); Use of focal mechanisms to determine stress: a control study. Journal of Geophysical Researchs, 92, 357–368.
- Maury, J., (2013); Analyse du potentiel sismique d'unsect eurlithos phérique au nord-ouest des Alpes. PhD thesis, University of Strasbourg, France.
- Bott, M. H. P., (1959); The mechanics of oblique slip faulting, Geological Magazine, 96, 109-117.
- Plateaux, R., Angelier, J., Bergerat, F., Cappa, F. and Stefansson, R., (2010); Stress changes induced at neighbouring faults by the June 2000 earthquakes, south iceland seismic zone. Terra Nova, 22 (2), 79-86.
- Lay, T. and Wallace, T., (1995); Modern Global Seismology. Academic Press, United States.
- Vavryčuk, V., Bouchaala, F. and Fischer, T.,(2013); High-resolution fault image from accurate locations and focal mechanisms of the 2008 swarm earthquakes in West Bohemia, Czech Republic, Tectonophysics, 590, 189–195.
- Talebian, M. and Jackson, J., (2003); A reappraisal of earthquake focal mechanisms and active shortening in the Zagros mountains of Iran. Geophysical Journal International, 156, 506-526.
- Sadeghi H, Shoja-Taheri J. (2006); Tectonic stress indicators in the Iranian plateau by determining the focal mechanism of the recorded earthquakes. Geosciences Jour., Vol. 59, pp. 102-119.
- Zahradnik, J., Jansky, J. and Plicka, V., (2008); Detailed waveform inversion for moment tensors of ∼ 4 events: examples from the Corinth Gulf, Greece. Bulletin of the Seismological Society of America, 98, 6, 2756–2771.
- Pearson, C., (1982); Parameters and a magnitude moment relationship from small earthquakes observed during hydraulic fracturing experiments in crystalline rocks. Geophysical Research Letters, 9, 404-407.
- Hanks, T. C. and Kanamori, H.,(1979); A moment magnitude scale. Journal of Geophysical Researchs, 84, 2348-2350.
- Bird, P. and Li, Y., (1996); Interpolation of principal stress directions by nonparametric statistics: Global maps with confidence limits. Journal of Geophysical Researchs, 101, 5435-5443.
- Heidbach, O., Tingay, M., Barth, A., Reinecker, J., Kurfeß, D. and Müller, B., (2009); The World Stress Map based on the database release 2008, equatorial scale 1:46,000,000, Commission for the Geological Map of the World, Paris, doi: 10.1594/GFZ.WSM.Map2009.
- Lacombe, O., Amrouch, K., Mouthereau, F. and Dissez, L., (2007); Calcite twinning constraints on late Neogene stress patterns and deformation mechanismsin the active Zagros collision belt. Geology, 35, 263–266.
- Lacombe, O., Mouthereau, F., Kargar, S. and Meyer, B., (2006); Late Cenozoic and modern stress fields in thewestern Fars (Iran): implications for the tectonic and kinematic evolution of Central Zagros. Tectonics, 25, TC1003.
- Dolati, A. and Burg, J. P., (2013) Preliminary fault analysis and paleostress evolution in the Makran Fold-and-Thrust Belt in Iran. Lithosphere Dynamics and Sedimentary Basins: The Arabian Plate and Analogues Frontiers in Earth Sciences, Springer, 261-277.


