American Journal of Geophysics, Geochemistry and Geosystems, Vol. 2, No. 5, October 2016 Publish Date: Sep. 10, 2016 Pages: 51-63
Adverse Effects of Phosphate Industry on the Environment and Groundwater Geochemistry in the Ghannouch Field, Southeastern Tunisia
Belgacem Agoubi*, Maher Gzam
Higher Institute of Water Sciences and Techniques, Departement of Water Ressources, University of Gabes, Zrig Eddakhlania, Tunisia
Abstract
Since 1970, Ghannouch field, southeastern Tunisia, has been recognized as an industrial area specialized in mining phosphate processing industry. Furthermore, this region has also been characterized by an excessive groundwater pumping to meet extensive agricultural activities and increasing industrial installation. Degradation of groundwater quality and its contamination became a serious concern of the communities. This manuscript describes the findings of a study performed to investigate the characteristics of groundwater quality and identify the contribution of the different factors to its chemical pollution and degradation. Groundwater was sampled in different locations of the study area. Physical parameters such as EC, TDS, pH were measured and major ions where analyzed. Geochemical, kriging techniques and statistical modeling was used to assess groundwater mineralization. Results show that dominant chemical facies of groundwater is Na-Cl-Ca-SO4-F due to rock-water interaction, rejection of phosphate waste from the phosphate processing industry and the fluorine industry and irrigation water flow rich in chemical fertilizers. Computed saturation with respect to calcite and calcite for most water samples may result from the dissolution of CaCO3 and CaF2 after the water is saturated with respect to the carbonate and fluorite minerals. Regardless moderate to high fluoride concentrations was out of permissible values of World Health Organization (WHO) and Tunisian National Standard (NT09.14).
Keywords
Fluoride, Phosphate Processes, Adverse Effects, Tunisia
Received:August 13, 2016
Accepted: August 26, 2016
Published online: September 10, 2016
@ 2016 The Authors. Published by American Institute of Science. This Open Access article is under the CC BY license. http://creativecommons.org/licenses/by/4.0/
Contents
1. Introduction 2. Materials and Method 2.1. Study Area 2.2. Sample Collection and Database 2.3. Geochemical, Geostatistical and Multivariate Analysis Methodoly 3. Results and Discussion 3.1. Summary Statistics 3.2. Geochemical Investigation 3.3. Spatial Distribution Groundwater Salinization Indicators 3.4. Multivariate Statistical Analysis 3.5. The Origin of Fluoride in Ghannouch Groundwater 3.6. Fluoride Saturation Index 3.7. Assessment of Fluoride Health Implications 4. Conclusion
1. Introduction
Natural and anthropogenic processes may contribute to groundwater mineralization and factors that control. Rock–water interaction, agriculture and industrial effluents, mixing water, mineral dissolution, ions exchange and saltwater intrusion are the main factors that control and govern groundwater quality in coastal area [42,38,2].
Among the problems affecting groundwater, high fluoride concentration is one of the most serious and environmental problems in several countries in the world [14,16]. Severe contamination of fluoride in groundwater, as manifested in the form of fluorosis, has been reported recently [46,15,7,9,12,50]. The presence of fluoride in groundwater poses a great problem. High fluoride concentration in drinking water has been found to cause severe human health hazards. Several authors [44, 20, and 14] have indicated that fluoride is known to cause diseases like dental fluorosis, Alzheimer’s disease, dementia, skeletal fluorosis and other hormonal disturbances.
The most recent studies indicate that potential origins of fluoride in water are numerous and are dominated by industrial fluorosis or foodborne. Industry phosphates, phosphoric acid, phosphate fertilizers and combustion of coal are the main source of pollution by fluorinated derivatives. Some authors [23,21,37,16] have shown that the consumption of water contaminated with dust emitted by the industries producing phosphate fertilizers led to the development of chronic fluorosis in cattle and humans. High fluoride in groundwater has been reported by several researchers [22,24,26,33,42,51,12,14].
In nature, groundwater is principally governed by climate and geologic composition of aquifer. In semiarid area, high fluoride concentration is probably due to higher TDS in groundwater, resulting in increased ionic strength and higher fluorite (CaF2) solubility in groundwater [30, 13, 40, and 12]. Fluoride is released to the soil and groundwater by the process of weathering of the primary rocks. Apart from natural sources, a considerable amount of fluoride may be caused by anthropogenic activities. Phosphatic fertilizers, extensively used in agriculture, contain fluoride as an impurity, which is leached down to the saturated zone by irrigational flows [29, 17, 40, and 16].
In this study, geochemical modeling, geostatistical and statistical analyses were used to investigate the factors controlling the groundwater mineralization and adverse effects of phosphate industry on the environment and groundwater quality. The results are of great importance for the planning and management of water resources in the study area.
2. Materials and Method
2.1. Study Area
The Ghannouch aquifer is a part of northern Jeffara multilayered aquifer, which is located in southeastern Tunisia, on the Mediterranean Sea (Fig. 1). The study area is characterized by semi-arid Mediterranean climate with a dry and hot summer season and a wet and cool winter season. The long-term mean annual rainfall is 200 mm and the potential evaporation is over 1300 mm [11]. The annual temperature varies between 6.7°C (in Winter) and 33.2°C (in Summer) and exceeds sometimes 40°C in July and August [11,43].
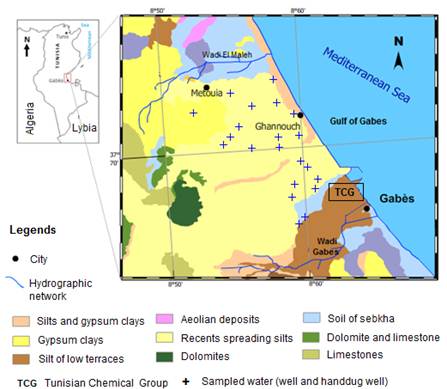
Fig. 1. Situation and geological map of study area.
The geological of Ghannouch consists in Mio-Plio-Quaternary formations overlying in discordance lower cretaceous formations consisting of continental deposits with intercalations of conglomeratic and sandy levels [43]. In Ghannouch coastal area, two aquifers were identified. The shallow aquifer is in the Miocene continental deposits with clays and sandy intercalation and the Senonian aquifer represented by two stratigraphic units (a limestone horizon with a thickness of approximately 300 m, and a marly limestone unit characterized by variable thickness of up to 500 m [43].
2.2. Sample Collection and Database
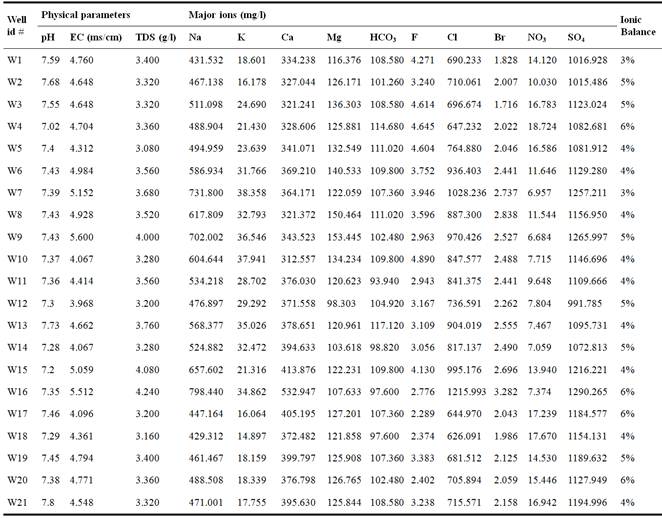
Groundwater samples were collected in March 2014 from 21 groundwater samples from wells and hand dug wells (Table 1). Geographic coordinates were measured using Trimble GPS. Physical parameters (TDS, pH, EC) were measured in situ using a handheld Consort C933 multiparameter water analyser. The samples were filtered before and analyzed by ionic chromatography (Methrohm 850 Professional IC).
Table 1. Physical and chemical analysis of sampled groundwater from study area.
2.3. Geochemical, Geostatistical and Multivariate Analysis Methodoly
A multidisciplinary approach was used to investigate groundwater geochemical composition in study area. Geochemical modeling, geostatistical techniques and multivariate statistical methods such as Principal Components Analysis (PCA) and Hierarchical Cluster Analysis (HCA) were considered to understand the processes controlling groundwater hydrochemistry.
2.3.1. Geochemical Modeling
The chemical composition of groundwater is related to the solid product of rock weathering and changes with respect to time and space. Therefore, the variation on the concentration levels of the different hydrogeochemical constituents dissolved in water determines its usefulness and its chemical quality [3]. To understand hydro-chemical processes and to define groundwater chemical facies, geochemical criteria was derived by constructing Piper diagrams and scatter plots of relationship between main groundwater chemical compositions. These diagrams allow the understanding of correlation between composition, their relationship and their effect on groundwater quality. In this way, Pie diagram, (Na vs Cl), (Br vs Cl), (F vs Ca, pH, HCO3) were established in order to identify groundwater mineralization processes and principal sources of contamination.
PHREEQC software [36] was used to compute aqueous speciation and saturation indices for each mineral in the sampled groundwater. The saturation indices are used to evaluate the degree of equilibrium between water and specific minerals and are expressed as SI = log (IAP/Kt), where IAP is the ion activity product and Kt is the equilibrium solubility constant.
The natural source of fluoride in the hydric environment is reflected in the bedrock where the compounds of fluoride minerals are leached by groundwater. In nature, hydrogen fluoride (HF) is the form of the more reactive fluorine. Other inorganic fluorides of environmental importance are calcium fluoride (CaF2) (fluorite or fluorspar), sodium fluoride (NaF) and sulfur hexafluoride (SF6). As for anthropogenic source of fluorine, recent studies have shown that releases of inorganic fluorides in the environment are mostly from aluminum industry and the production of phosphate fertilizers.
2.3.2. Variographic and Geostatistical Analysis
Kriging techniques refer to the process of estimating variable values at locations, where no measurements are available. Semivariogram is the basic geostatistic tools for visualizing, modeling and exploiting the spatial autocorrelation of a regionalized variable [3]. Suppose that F(x) is the fluoride concentration in groundwater known at N points. Autocorrelation between F(x) values at different location xi, i=[1..N], is determined by the computational variogram g(h) of the distance h between sampling points in which fluoride values were measured. g(h) is computed using the following equation (eq. 1).
![]() (1)
(1)
Where F(xi) is the measured concentration in groundwater at xi location, N is the sampled groundwater number separated by distance h.
After selecting the best perfect variographic model, spatial estimation of fluoride concentration can be done by resolving ordinary kriging system (eq. 2) which ![]() is a Lagrange multiplicator and kriging weights li computation.
is a Lagrange multiplicator and kriging weights li computation.
![]() (2)
(2)
Fluoride interpolated value in location x0 is given by the equation [2] below:
![]() (3)
(3)
In which F*(x0) is the kriged value at location x0, F*(xi) is the known value at location xi, and li are a set of weights obtained by solving the ordinary kriging system.
2.3.3. Statistical Analysis
Multivariate analysis of hydro-geochemical database of sampled groundwater was performed using multivariate statistical approach to investigate the origin of high groundwater mineralization in the study area. This approach is widely used to identify the sources of high concentration of major elements in a groundwater. The utilization of various multivariate approaches such as hierarchical cluster analysis (HCA) and principal component analysis (PCA), provide better understanding of water quality characteristics and allows comparison of different samples of waters [4].
3. Results and Discussion
The results of the sampled water analysis are shown in Table 1. For each sample the physical parameters and the major components are presented. The ionic balance calculated for all samples analyzed, shows values ranging from 3 to 6% which confirms the good quality of chemical analysis performed during the study.
3.1. Summary Statistics
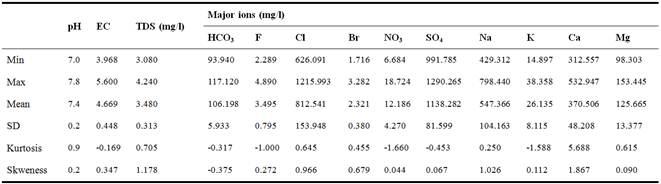
Statistical summaries of physical and geochemical parameters of the groundwater sampled in study area are shown in Table 2. TDS ranged from 3.08 to 4.24 g/l with a mean of 3.48 g/l indicating a high mineralization values. pH ranged from 7 to 7.8 indicating a neutral water. Table 2 also shows that, based on mean values, the dominant ions were SO4, Cl, Na, Ca, and Mg, suggesting that the groundwater mineralization is conditioned by these ions. The fluorine values ranged between 2.289 to 4.890 mg/l with mean of 3.495. Fluorine values were higher than normal Fluorine values in normal groundwater, which raises the interest in determining the origins of the high fluorine centration of the groundwater in Ghannouch region.
Table 2. Summary statistics of pH, EC, TDS and major ions of sampled wells of study area.
3.2. Geochemical Investigation
TDS and fluorine concentration (F) are shown in Fig. 2. According to Tunisian National Standard NT09.14 (2013), all sampled water exceeded the permissible limit of TDS (1.5 g/l) and F (1.5 mg/l). In fact, these values are much higher than the Tunisian National Standard T09.14 and WHO [49]. These results raise an important question about possible sources of mineralization of groundwater in the study area.
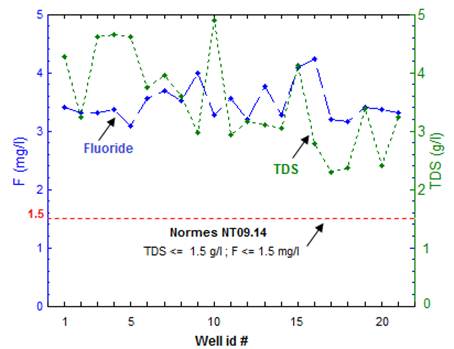
Fig. 2. Correlation diagram between TDS and F in sampled wells from database of study area.
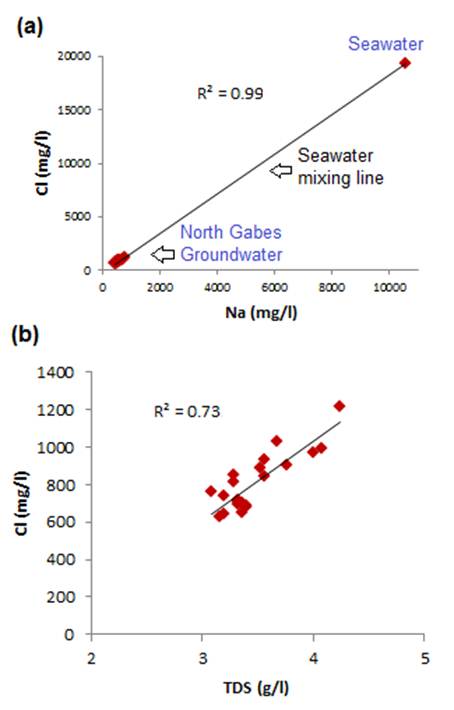
Fig. 3. Relationship between Chloride and Na (a), TDS (b), NO3 and Br.
Table 2 shows that the dominant ions in groundwater are Cl, Na, SO4, and Ca, suggesting a saline to brackish groundwater. The sequence of the abundance of the major ions is in the following order SO4 > Cl > Na > Ca > Mg > HCO3 > K > NO3 > F > Br. A plot of TDS against Cl and Na vs Cl (Fig. 3) show that Cl was perfectly correlated with Na (R² = 0.99). The correlation points of Cl = f (Na) diagram (Fig. 3.a) coincides with the line of mixing seawater. This shows that the Na and Cl ions derived largely from the same marine origin. The strong correlation between TDS and Cl (R² = 0.73) (Fig. 3.b) indicates that these ions contribute significantly to salinization of regional groundwater.
The diagram Cl vs Br (Fig. 4) shows that Cl is well correlated with Br supporting the hypothesis that suggests the marine origin of Chloride.
In order to highlight hydro-chemical trends in groundwater, database of sampled groundwater were plotted on the Piper diagram (Fig. 5) using the DIAGRAMS software [45]. Fig. 5 shows that the dominant water type is Na-Cl-Ca-SO4. This dominant class may be due to dissolution of Halite (NaCl), Gypsum and anhydrite (CaSO4) and seawater intrusion in coastal area.
3.3. Spatial Distribution Groundwater Salinization Indicators
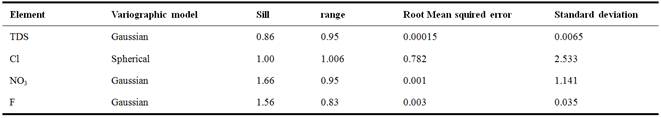
Geostatistics is widely used to map hydro-geochemistry aquifer parameters. It allows studying the spatial variability of the studied phenomenon. In order to understand spatial variability of groundwater salinization indicators such as TDS, Cl, NO3 and F, a geostatistical study was conducted using EasyKrig MATLAB toolbox. Experimental variograms were computed and best fitted models were selected based on variographic parameters and double kriging cross-validation for TDS, Cl, NO3 and F. Results are shown in Fig. 6 and summarized in Table 3. Double kriging cross-validation method was used to evaluate the model and select the best fitted variographic model. Table 3 shows that the RMSE values ranges from 0.00015 to 0.782 and mean standard deviation is less than 1.141. The low values of RMSE and SD indicate a robustness of the variographic models selected to map spatial distribution of groundwater indicators.
Table 3. Summarizes of variographic parameters of TDS, Cl, NO3 and F.
Kriged maps of TDS, Cl and NO3 were showed in Fig. 7. Spatial distribution was based on variographic model and estimated by Ordinary kriging. Fig. 7a shows that the high mineralization is located nearby coastal line in the north of study area which indicates a saltwater intrusion in the study area. This hypothesis is confirmed by spatial distribution of Cl (Fig. 7.b) in which the highest chloride concentration is observed in the north of study area (Ghannouch North). NO3 spatial distribution map (Fig. 7.c) indicates that the highest NO3 values were observed in the irrigated areas indicating that NO3 might originate from fertilizers.
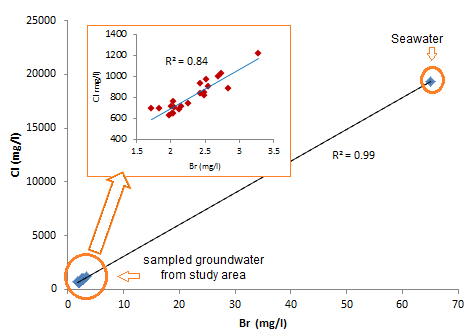
Fig. 4. Correlation diagram between Cl and Br.
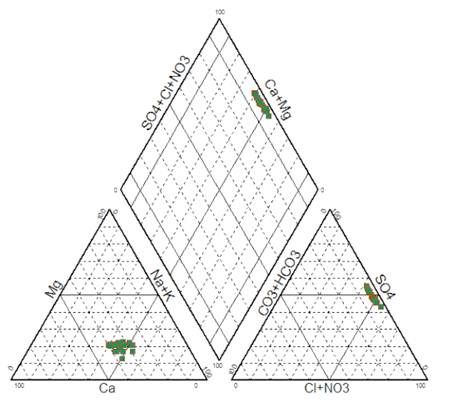
Fig. 5. Piper diagram of sampled groundwater from study area (Murch 2014).
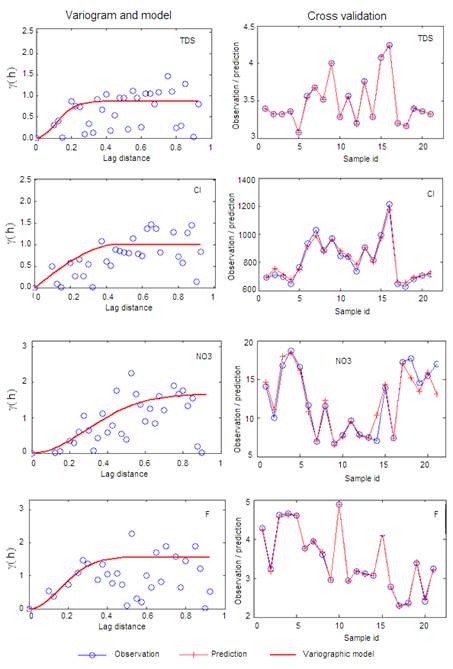
Fig. 6. Empirical variogram, fitted model parameters and double kriging cross-validation.
The fluorine distribution map (Fig. 7d) shows three distinguished areas with high concentration of fluorine (F> 4 mg / l). A first zone is localized in the south of study area, in which the Tunisian Chemical Group complex is located. This finding highlights the possible effect of the local phosphate industry on groundwater contamination in the region. A second area is identified in the west part of study (Metouia-Oudhref oases). This area is characterized by intense agricultural activities and the existence of the Mio-Plioquaternary evaporates rocks filling the sedimentary basin. Finally, the third area with a significant concentration of fluorine is the Northern part of the study area which corresponds to the agricultural area of Northern part of study area.
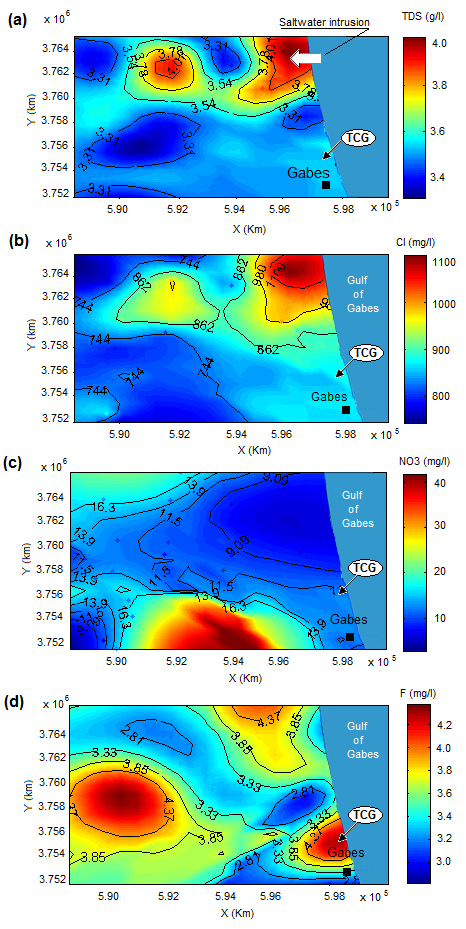
Fig. 7. Spatial distribution map of fluoride in study area (a) TDS, (b) Chloride, (c) NO3 and (d) fluoride.
3.4. Multivariate Statistical Analysis
Principal Component Analysis (PCA) was performed on the groundwater database from the study area using 13 variables and 21 observations. PCA includes loading for the rotated component matrix, eigenvalues for each component and the variance explained of each variable controlled by the set of components [1]. The first three components explain more than 75% percent of the variance, respectively, and, thus, account for the majority of the variance in the original data set. However, Component 3 explains only 12.65% of the variance (Table 4). Factorial F1 x F2 is shown in Fig. 8.
Table 4. Rotated Component Matrix of the Chemical Data from study area.
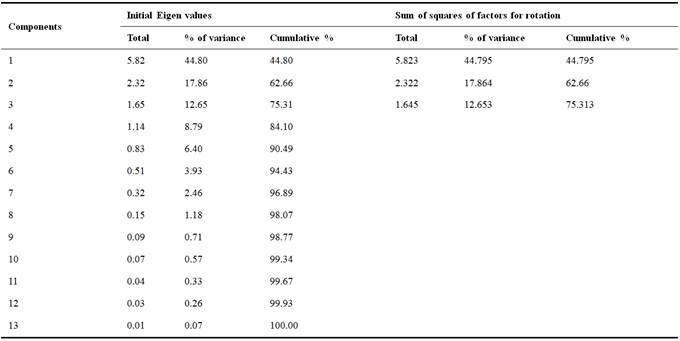
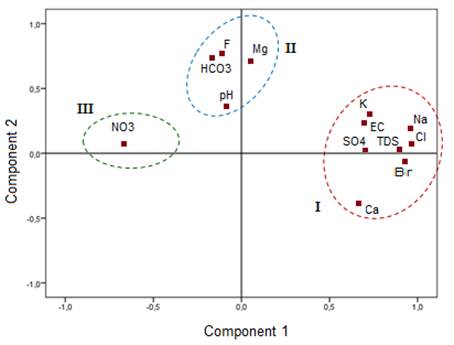
Fig. 8. Projection of the variables in the first and second factorial plan.
The high correlation values between variables and the eigenvectors can be used to interpret the hydrochemical processes that control groundwater salinity. For instance, TDS, EC, Na, Cl and SO4 are included by the first principal component shown in Table 4.
Fig. 8 shows three distinguished groups on the factorial diagram F1xF2. A first association loaded positively by the factor F1 containing the main ions that control groundwater mineralization (TDS, Cl, Na, Ca, SO4, Br). This component was considered, therefore, as the component of groundwater mineralization. The second association is positively loaded by the second component and includes pH, HCO3, F and Mg. This component is interpreted as the alkalinity component. The ion NO3, is the third association and is manifested by the negative F1 axis. This axis represents the anthropogenic pollution component due to the rich irrigation water return phosphatic elements.
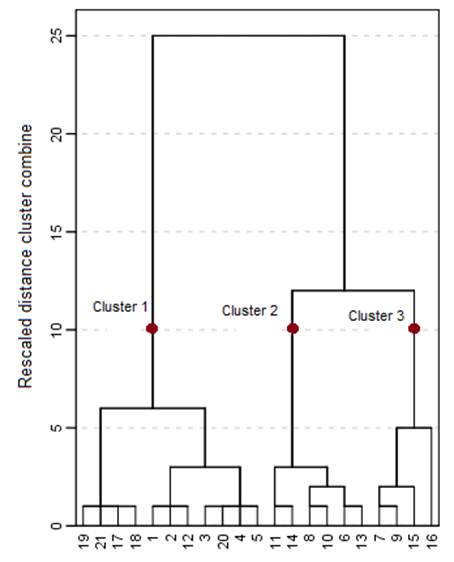
Fig. 9. Groundwater quality dendrogram using award distance from Q-mode HCA.
Hierarchical cluster analysis (HCA) was applied to groundwater data in order to understand the different water samples. Based on Ward’s linkage method, the dendrogram computed for water samples (Fig. 9). HCA clusters together at low linkage distances samples with similar spatial characteristics and relationships, while dissimilar samples are linked at higher linkage distances. Fig. 9 shows three distinguished clusters in the dendrogram. These findings confirm the PCA results and suggest that each cluster is an indication of a distinct water group.
3.5. The Origin of Fluoride in Ghannouch Groundwater
The analysis of the fluorine kriging map (Fig. 10) allowed us to identify three possible sources of fluorine in groundwater:
i) Natural origin, caused by water-rock interaction and chemical reactions, during the residence time, between groundwater and rocks. This origin concerns the entire study area in which the fluorine content rarely exceeds 2 mg / l,
ii) An agricultural origin corresponding to the fraction of fluorine phosphate fertilizer, returning from irrigation water. This fluorine source concerns mainly agricultural areas, and
iii) An industrial source, although anthropogenic, this source is due to the storage and disposal of phosphate waste from the phosphate treatment industry.
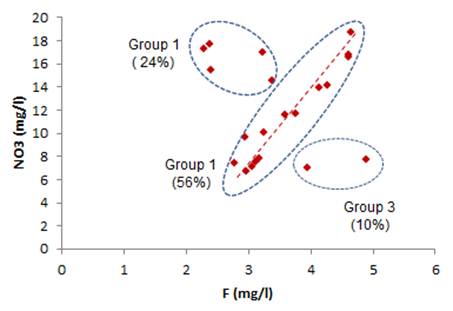
Fig. 10. Relationship between NO3 and F, showing three possible origins of fluoride in groundwater from study area.
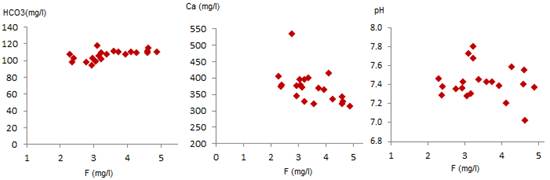
Fig. 11. Plots of pH, Ca and HCO3 against F.
To better understand the relationship between fluorine and other components of groundwater, relationship between fluorine and HCO3, pH and Ca was established. Fig. 11.a shows a significant relationship between HCO3 and F. Nevertheless, the relationship between fluorine and calcium (Fig. 11.b) shows a negative correlation between these two ions. This suggests a reaction between Ca and F ions. [25] indicated that Ca and Mg decrease with increasing fluoride in groundwater. High fluoride and very low Ca and Mg in groundwater may be due to prior precipitation of CaCO3 from water and only limited incorporation of F in CaCO3. The positive relation between fluoride and HCO3 is explained by considering the mass law equation relating calcite and fluorite when the two elements are in contact with groundwater. Chemical reaction of fluoride with calcite [25] is shown in the following equation (eq.4).
![]() (4)
(4)
The water pH is also very important for the fluoride solubility in groundwater. [18], [6] and [25] reported that water pH is responsible for increasing or decreasing of the fluorine content in groundwater. Fig.11.c shows that the concentration of fluorine corresponds to pH values over than 7.
3.6. Fluoride Saturation Index
The saturation index (SI) is the ratio of Ion Activities Product (IAP) to the product solubility of the mineral. SI indicates trend phases to dissolve or precipitate and can track the geochemical evolution of water in an aquifer. When SI is positive, it means that the solution is saturated with respect to the mineral that has a tendency to precipite. However, when SI is negative, the solution is under-saturated with mineral which tends to dissolve. The geochemical modeling program PHREEQC [36] was used to calculate SI of sampled waters from study area. The plots of SI against gypsum, halite, calcite and fluorine were shown in Fig. 12.
Fig. 12 shows that gypsum and halite have not reached the saturation line but they continue to dissolve in groundwater. However, groundwater in study area is oversaturated with fluorine and calcite. The fluoride tends to precipitate and enriched groundwater fluorine by precipitation of fluorite (CaF2).
The relationship between SI (Fluorite) and SI (Calcite) was also plotted. Figure 13 shows that most of the scatter plot was over the saturation line of both calcite and fluorite. These findings support the hypothesis of fluoride groundwater saturation and contamination of groundwater.
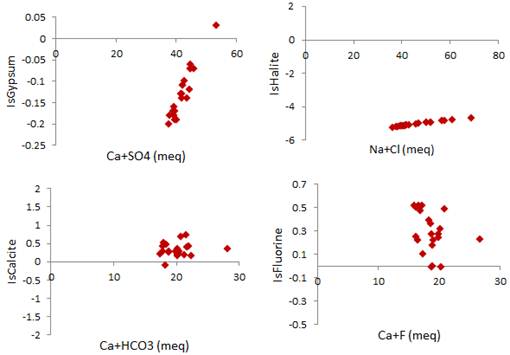
Fig. 12. Relationships between Saturation Index (IS) and (a) gypsum, (b) Halite, (c) Calcite and (d) Fluorine.
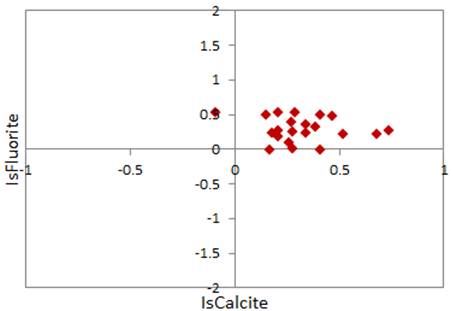
Fig. 13. SI-Fluorite versus SI-Calcite showing a saturation of Calcite and Fluorite in groundwater of study area.
3.7. Assessment of Fluoride Health Implications
In order to showcase the measured fluoride levels and their effects on human health in Ghannouch region, groundwater was classified based on fluoride concentration. Fig. 14 reveals that 100% of sampled waters have Fluoride concentration over the limit permissible by World Health Orggabesanization [49] suggesting possible effects on human health and risk of fluorosis in this region.
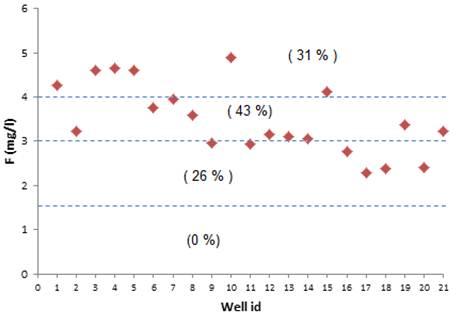
Fig. 14. Fluoride concentration risk classes of study area.
In order to assess groundwater fluoride hazard, all sampled waters were classified according World Health Organization. The results of this classification are shown in Table 5. Table 5 shows that none of the tested samples was classified in safe limit. Therefore, all of sampled waters were in fluoride hazard on human health and 26% of waters are in dental fluorosis (Table 5).
Table 5. Classifying groundwater based on F-(mg/l) hazard.
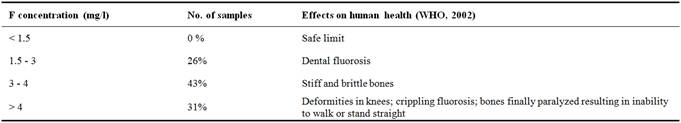
This effect was remarkable on the teeth of the habitants of Ghannouch, where traces of flurosoe began to appear over a part of the population [19]. This area has more than 70 thousand habitants that may be under the effects of atmospheric and water pollution. For instance, exceeding 3 mg/l, fluoride can cause health problems related to skeletal [49]. In addition, according to [49], consuming water with fluoride concentrations greater than 3 mg/l can cause bones to become rigid and brittle. If the fluorine concentration exceeds 4 mg/l, deformations can appear in the knees. Then after, bones can be finally paralyzed resulting to an inability to walk or stand straight. These findings, combined with the effects of high fluorine, renders the situation very serious and in need of attention by the authorities. If people continue to use these waters without treatment to reduce the concentration of fluoride, these people will be in great risk of being attacked by very serious bone diseases.
4. Conclusion
The present study concludes that fluoride concentration in groundwater has values greater that permissible limit of World Health Organization. Fluoride concentration ranged from 2.8 to 4.89 mg/l. Several modeling approach indicated that the chemistry of the groundwater is controlled by the fluorite (CaF2), calcite (CaCO3) and halite (NaCl) solubility. Water quality was determined by several factors such as geology and anthropogenic effects. High fluoride in groundwater occurs in:
• Return of irrigation water rich phosphate fertilizers, due to the intense exploitation of agricultural land in the study area.
• Rock-water interactions due to long time residence of groundwater expressed by ionic exchange with Mio-Plioquaternary clays filling the sedimentary basin of study area;.
• Rejection of phosphate waste from the phosphate processing industry and the fluorine industry.
Groundwater from study area was assessed according to world health organization. It was concluded that all sampled waters have a fluoride concentration over permissible limit concentration.
Among sampled waters, 74% show a fluoride concetration exceeding 3 mg/l. This contamination is due, in part, to the return of irrigation water rich in phosphate components and industrial discharges of chemical industry of phosphate and fluorine. The situation, in the study area, becomes critical and defloruration treatments are necessary for prevention against bone diseases that may attack the consumers of water in the study area.
References
- Agoubi B, Kharroubi B, Abida H, (2014) Geochemical Assessment of Environmental Impact on Groundwater Quality in Coastal Arid Area, South Eastern Tunisia. Journal of Environmental Science and Engineering Technology, (2) 35-46.
- Agoubi B, Kharroubi A, Abichou T, Abida H, (2013) Hydrochemical and geoelectrical investigation of marine Jeffara aquifer, Southeastern Tunisia. Applied Water Science Journal, DOI: 10.1007/s13201‐013‐0091‐4.
- Agoubi B, Kharroubi A, Abida H, (2011)Hydrochemistry of groundwater and its assessment for irrigation purpose in coastal Jeffara Aquifer, southeastern Tunisia. Arab Journal Geosci. DOI 10.1007/s12517-011-0409-1.
- Agoubi B, Kharroubi A, Abida H, (2012) Saltwater intrusion modelling in Jorf coastal aquifer, South-eastern Tunisia: Geochemical, geoelectrical and geostatistical application. Hydrol. Process.DOI: 10.1002/hyp.9207.
- Andezhath SK, Ghosh G, (2000) Fluorosis management in India: the impact due to networking between health and rural drinking water supply agencies.IAHS-AISH Publication,260, 159–165.
- Apambire WM, Boyale DR, Michel F, (1997) Geochemistry, genesis, and health implications of fluoriferous groundwaters in the upper regions of Ghana. Environ. Geol 35(1):13-24.
- Armienta MA, Segovia N, (2008) Arsenic and Fuoride in the groundwater of Mexico. Environ Geochem Health (2008) 30:345–353, DOI 10.1007/s10653-008-9167-8.
- Ayoob S, Gupta A K, (2006) Fluoride in drinking water: A review on the status and stress effects. Critical Reviews in Environmental Science and Technology, 36, 433–487.
- Babulal D, Jitu T, Surashree S, Biren G, Robin K D, Himangshu B D, Subhash C D, (2003) Fluoride and other inorganic constituents in groundwater of Guwahati, Assam, India, Current Science, 85(5).
- Ben Aissa N, (2001). Revision of pollution hot spots in Mediterranean, country report for Tunisia, 14p.
- Ben Hamouda M F, Mamou A, Bejaoui J, K Froehlich, (2013) Hydrochemical and Isotopic Study of Groundwater in the North Djeffara Aquifer, Gulf of Gabès, Southern Tunisia. International Journal of Geosciences, 4:1-10, http://dx.doi.org/10.4236/ijg.2013.48A001
- Brindha K, Elango L (2011). Fluoride in groundwater: causes, implications and mitigation measures. In: Monroy, S.D. (Ed.), Fluoride Properties, Applications and Environmental Management, 111-136.
- Chae G T, Yun, S T, Kwon M J, Kim Y S, Mayer B, (2006) Batch dissolution of granite and biotite in water: Implication for fluorine geochemistry in groundwater.Geochemical Journal,40, 95-102.
- Chakrabortty S, Roy M, Pal P, (2013) Removal of fluoride from contaminated roundwater by cross flow nanofiltration: Transport modeling and economic evaluation. Desalination journal, 313:115-124. http://dx.doi.org/10.1016/j.desal.2012.12.021
- Dwivedi S K, Dey S, Swarup D, (1997) Hydrofluorosis in water buffalo (Bubalus bubalis) in India. Sci Total Environ; 207, pp105‐109.
- Fadili A, Mehdi K, Riss J, Najib N, Makan A, Boutayab K, (2015) Evaluation of groundwater mineralization processes and seawater intrusion extension in the coastal aquifer of Oualidia, Morocco: hydrochemical and geophysical approach. Arab J Geosci, DOI 10.1007/s12517-015-1808-5.
- Farooqi A, Masuda H, Kusakabe M, Naseem M, Firdous N, (2007) Distribution of highly arsenic and fluoride contaminated groundwater from east Punjab, Pakistan, and the controlling role of anthropogenic pollutants in the natural hydrological cycle.Geochemical Journal, 41, 213-234.
- Gaciri S J, Davies T C, (1993) The occurrence and geochemistry of fluoride in some natural waters of Kenya.Journal of Hydrology, 143, 395-412.
- Guissouma, W. and Tarhouni, J., 2015. Fluoride in Tunisian Drinking Tap Water. Journal of Water Resource and Protection, 7, 860-870. http://dx.doi.org/10.4236/jwarp.2015.711070
- Gupta S, Banerjee S, Saha J K, Mondal N (2006) Fluoride geochemistry of groundwater inNalhati-1 block of the BirbhumDistrict,West Bengal, India, Research report, Fluoride 39 (4), 318–320.
- Haikel Y, Voegel J C, Frank R M, (1986) Fluoride content of water, dust, soils and cereals in the endemic dental fluorosis area of khouribge (Morocco). Archs oral Biol.; 31: pp. 279‐286.
- Karthikeyan K, Nanthakumar K, Velmurugan P, Tamilarasi P, (2010) Prevalence of certain inorganic constituents in groundwater samples of Erode district, Tamilnadu, India, with special emphasis on fluoride, fluorosis and its remedial. measures.Environmental Monitoring and Assessment,160,141-155.
- Kessabi M, Assimi B, (1984) The effects of fluoride on animals and plants in the south Safizone. Sci Total Environ 38:pp.63-68.
- Kim Y, Kim J Y, Kim K, (2010) Geochemical characteristics of fluoride in groundwater of Gimcheon, Korea: Lithogenic and agricultural origins.Environmental Earth Sciences, doi:10.1007/s12665-010-0789-7.
- Kundo N, Panigrahi M K, Tripathy S, Munshi S, Powell M A, Hart B R, (2001) Geochemical appraisal of fluoride contamination of groundwater in the Nayagarh District of Orissa, India. Environmental geology, 41:451-460. DOI. 10.1007/s002540100414.
- Looie S B, Moore F, (2010) A study of fluoride groundwater occurrence in Posht-e-Koohe-Dashtestan, South of Iran.World Applied Sciences Journal, 8 (11), 1317-1321.
- Mandinic Z, Curcic M, Antonijevic B, Lekic C P, Carevic M, (2009) Relationship between fluoride intake in Serbian children living in two areas with different natural levels of fluorides and occurrence of dental fluorosis. Food Chem Toxicol, 47, 1080-1084.
- Messaïtfa A (2008) Fluoride contents in groundwaters and the main consumed foods (dates and tea) in Southern Algeria region. From the issue entitled "Special Issue: Groundwater Flow - selected papers from XXXIII IAH Congress, Zacatecas, Mexico (233-320)". Environmental Geology, 55(2), 377-383.
- Mirlean N, Roisenberg A, (2007) Fluoride distribution in the environment along the gradient of a phosphate-fertiliser production emission (southern Brazil). Environmental Geochemistry and Health, 29(3), 179-87.
- Moghaddam A A, Fijani E, (2008) Distribution of fluoride in groundwater of Maku area, northwest of Iran. Environ Geol (2008) 56:281–287. DOI 10.1007/s00254-007-1163-2.
- Motalane M P, Strydom C A, (2004) Potential groundwater contamination by fluoride from two South African phosphogypsums. Water SA, 30 (4), 465-468.
- Msonda, K W M, Masamba W R L, Fabiano E, (2007) A study of fluoride groundwater occurrence in Nathenje, Lilongwe, Malawi. Physics and Chemistry of the Earth, Parts A/B/C, 32(15-18), 1178-1184.
- Naseem S, Rafique T, Bashir E, Bhanger M I, Laghari A, Usmani T H, (2010) Lithological influences on occurrence of high-fluoride groundwater in Nagar Parkar area, Thar Desert, Pakistan. Chemosphere, 78, 1313–1321.
- NT09.14 (2013) Norme Tunisienne relative à la qualité des eaux destinées à la consommation humaine.
- Ozsvath D L (2006) Fluoride Concentrations in a Crystalline Bedrock Aquifer, Marathon County, Wisconsin Marathon County, Wisconsin. Environmental Geology, 50 (1), 132–138.
- Parkhurst D L, Appelo C A J, (2009 PHREEQC for windows ver 2.16.0, BRGM.
- Patra R C, Dwivedi S K, Bhardwaj B, Swarup D, (2000) Industrial fluorosis in cattle and buffalo around Udaipur, India. Sci total Enviro, 235:pp. 145-150.
- Pazand K, Hezarkhani A, (2012) Investigation of hydrochemical characteristics of groundwater in the Bukan basin, Northwest of Iran. Appl Water Sci 2:309–315.
- Rango T, Bianchini G, Beccaluva L, Tassinari R, (2010) Geochemistry and water quality assessment of central Main Ethiopian Rift natural waters with emphasis on source and occurrence of fluoride and arsenic. Journal of African Earth Sciences, 57, 479–491.
- Rao N S (2009) Fluoride in groundwater, Varaha River Basin, Visakhapatnam District, Andhra Pradesh, India Environ Monit Assess (2009) 152:47–60, DOI 10.1007/s10661-008-0295-5.
- Reddy A G S, Reddy D V, Rao P N, Maruthy P K, (2010) Hydrogeochemical characterization of fluoride rich groundwater of Wailpalli watershed, Nalgonda District, Andhra Pradesh, India. Environ Monit Assess 171:561–577. doi:10.1007/s10661- 009-1300-3.
- Reddy D V, Nagabhushanam P, Sukhija B S, Reddy A G S, Smedley P L, (2010) Fluoride dynamics in the granitic aquifer of the Wailapally watershed, Nalgonda District, India. Chemical Geology, 269 (3-4), 278-289.
- Sahli H, Tagorti M A, Tlig S, (2013) Groundwater hydrochemistry and mass transfer in stratified aquifers ystem (Jeffara Gabes basin, Tunisia). Larhyss Jpurnal, 12, pp. 95-108.
- Sarkar M, Banerjee A, (2003) Cause, effect and remedial options for fluoride in drinking water, Yearb. Environ. Prot. 5, 123–129.
- Simler R, (2009) DIAGRAMMES: Logiciel d’hydrochimie multi-langage en distribution libre.Laboratoire d’Hydrogéologie d’Avignon, France.
- Singh JL, Swarup D, (1994) Fluorosis in buffalo. Vet Rec.; 135, pp260-261.
- Viswanathan G, Gopalakrishnan S, Sivailango S, (2010) Assessment of water contribution on total fluoride intake of various age groups of people in fluoride endemic and nonendemic areas of Dindigul District, Tamil Nadu, South India. Water Research, 44, 6186-6200.
- Viswanathan G, Jaswanth A, Gopalakrishnan S, Sivailango S, (2009) Mapping of fluoride endemic areas and assessment of fluoride exposure. Science of the Total Environment, 407, 1579-1587.
- WHO (2002) Fluorides, Geneva, World Health Organization. Environmental Health Criteria 227, 268.
- Xubo G, Wang Y, Yilian Li, Guo Q, (2007) Enrichment of fluoride in groundwater under the impact of saline water intrusion at the salt lake area of Yuncheng basin, northern China, Environ Geol (2007) 53:795–80. DOI 10.1007/s00254-007-0692-z.
- Young S M, Pitawala A, Ishiga H, (2010) Factors controlling fluoride contents of groundwater in north-central and northwestern Sri Lanka. Environmental Earth Sciences, doi:10.1007/s12665-010-0804-z.


