
American Journal of Geophysics, Geochemistry and Geosystems, Vol. 2, No. 4, August 2016 Publish Date: Aug. 5, 2016 Pages: 31-42
The Need to Make Sea-Level Numbers Straight
A. Parker*
School of Engineering and Physical Science, James Cook University, Townsville, Australia
Abstract
The sea-level rise claims recently published in the Proceedings of The National Academy of Science of The United States of America (PNAS) have largely exceeded the most alarmist predictions of the latest Intergovernmental Panel on Climate Change (IPCC) Assessment Report (AR) 5. These claims have been accompanied by the request of urgent measures to prevent and mitigate the threats that climate change is posing to the 20 million of Americans now living below sea-levels +9.9 meters. It is shown that the most likely sea-level rise scenario for 2,100 is the prosecution of the trend on average slow rising and acceleration free measured over the last decades, that is below the less alarmist prediction of the IPCC AR5, and it is totaling for the United States less than 20 centimeters by 2,100.
Keywords
Climate Change, Mitigation, Prevention, Sea-Levels, Ethics
Received: June 27, 2016
Accepted: July 11, 2016
Published online: August 5, 2016
@ 2016 The Authors. Published by American Institute of Science. This Open Access article is under the CC BY license. http://creativecommons.org/licenses/by/4.0/
Contents
1. Introduction 2. IPCC AR5 Sea-Level Rise Predictions 3. Strauss, Kulp & Levermann Sea-Level Rise Claims 4. Comment by Boyd, Pasquantonio, Rabalais & Eustis and Reply by Strauss, Kulp & Levermann 5. Actual Sea-Level Rise Evidence at the Worldwide Tide Gauges 6. Actual Sea-Level Rise Evidence at the Tide Gauges of the United States 7. Measured Oscillatory vs. Reconstructed Accelerating Patterns 8. Causes of Floods in New Orleans 9. Conclusions 10. Conflict of Interest Appendix - NOAA 50-Year Mean Sea Level Trends
1. Introduction
The tide gauges measure the continuously oscillating sea levels vs. the tide gauge instrument. The sea level oscillations are characterized by periodicities from very short to very long up to quasi-60 years clearly evidenced in all the tide gauge signals from around the globe. This introduces some issues in evaluating the sea level velocity when data have not enough quality or length. The instrument or the nearby land may suffer of a vertical velocity same order of magnitude of the sea level velocity. Sea levels are rising or falling around the globe at very different rate as a result of the claimed growth of the volume of the ocean waters and the subsidence of the land.
2. IPCC AR5 Sea-Level Rise Predictions
The latest sea-level rises claims for the United States are now largely exceeding the latest alarmist Intergovernmental Panel on Climate Change (IPCC) predictions, drastically rising the estimates from the upper band of the upper estimate of the IPCC work [1]. The already alarmist latest sea-level predictions by the IPCC [1], purely based on process based models, were returning projections of global mean sea-level (GMSL) rise by 2,100 relative to 1986–2005 for the scenarios SRES A1B, RCP2.6, RCP4.5, RCP6.0 and RCP8.5 (Table 13.5 of [1]) of 0.60, 0.44, 0.53, 0.55 and 0.74 meters. The ranges indicated for every prediction was [0.42 to 0.80], [0.28 to 0.61], [0.36 to 0.71], [0.38 to 0.73] and [0.52 to 0.98].
3. Strauss, Kulp & Levermann Sea-Level Rise Claims
Strauss, Kulp & Levermann [2] propose in PNAS their apocalyptic views of United States coastal cities inundated by rising seas. Their subjective analysis suggests unabated CO2 emissions up to 2,100 would now commit global sea-level rises of 4.3–9.9 meters. They conclude that the absence of protective measures to prevent global warming could lead to United States population movements of 20 million peoples before the year 2,100. The 4.3-9.9 meters are not predicted to occur in the year 2,100, but somewhere in the future. However, the 20 million peoples at risk of displacement are those living now in the coastal areas that could be flooded by the 9.9 meters of sea-level rise.
4. Comment by Boyd, Pasquantonio, Rabalais & Eustis and Reply by Strauss, Kulp & Levermann
Not only nobody in between the reviewers picked up these blatant inconsistent claims, or somebody was then permitted to negatively comment these extremist findings. Rather, a comment [3] and a reply [4] were published to make stronger these claims giving the false impression of a settled debate.
A comment by Boyd, Pasquantonio, Rabalais & Eustis [3] and the reply by Strauss, Kulp & Levermann [4] recently published in PNAS both agree on the prospect of up to 9.9 meters sea-level rise. Together they support urgent climate action in the form of further prevention through renewable energy and further mitigation through floodwalls and levees.
Boyd, Pasquantonio, Rabalais & Eustis [3] only question for the specific of New Orleans the assertions that the carbon dioxide emissions already have exceeded critical levels to note how important are on-the-ground efforts to enhance this city’s resilience to climate change with hydrological barriers. Strauss, Kulp & Levermann [4] reply to acknowledge the value of levees and floodwalls they did not factor in. For the United States and in particular New Orleans, the renewable energy substitution of fossil fuels energy and the enforcement of adaptation measures for sea-level rise are the only hope.
5. Actual Sea-Level Rise Evidence at the Worldwide Tide Gauges
The measured sea-levels are predominantly not rising, but rather oscillating [5-10], without any powerful drive by the CO2 emission. Since the time of the IPCC AR5, nothing new has been measured directly by the tide gauges, or indirectly by monitoring projects for warming oceans [11] or melting ices [12] to motivate the aggravation [2-4] of the predictions of [1]. During the last decades, the sea-level have risen and decreased around the world, averaging only a quite small rise, with spatial and temporal oscillations both positive and negative, averaging a time rate of change practically zero.
The Permanent Service for Mean Sea-level (PSMSL) provides actual sea-level data from tide gauges. Their surveys deliver about same relative rates of rise in same locations year after year with small changes both in positive and negative. The tide gauges measure the sea-level relative to the instrument. When the natural oscillations of the sea-levels are accounted, the instrument and the land are not moving vertically less than the sea-levels.
The latest PSMSL survey [13] has 722 tide gauges, of average sea-level rise (SLR) +1.39 mm/year, maximum +10.25, and minimum -17.63 mm/year. Year span of data is on average 55, maximum 208 and minimum 21. If we focus on the tide gauges long enough to infer a trend cleared of the natural oscillations [8,10], the 212 tide gauges of length exceeding 60 years have average SLR +0.41 mm/year, maximum +9.01 mm/year, minimum -13.22 mm/year. The year span of data is now on average 92.
Only 16 tide gauges of these 222 have a SLR exceeding the "present" +3.7 mm/year postulated in the IPCC computations, where the rate of rise at the start of the IPCC RCP projections (2007–2013) is about 3.7 mm/year.
The PSMSL surveys also deliver about same relative rates of rise in same locations year after year with small changes both in positive and negative. This means the relative rates of rise are small on average and their acceleration is also negligible. If the acceleration is negligibly small, this means that not only the sea-levels are presently rising much less than what is requested to produce the IPCC predicted values, but also that there is no indication they may start rising faster and faster driven by the carbon dioxide emission as postulated in the models.
Over the last decades, the relative sea-levels have risen and decreased around the world, averaging only a quite small rise, with spatial and temporal oscillations both positive and negative, averaging a time rate of change practically zero. In 206 of 222 locations around the world, the most likely scenario is to have negative, zero or small positive sea-level rises by 2,100, and only in 16 of 222 locations around the world, the most likely scenario is to have sea-level rises by 2,100 exceeding the 37 centimetres. Therefore, the IPCC sea-level rise predictions are very likely overestimations, not underestimations as claimed in [2-4].
6. Actual Sea-Level Rise Evidence at the Tide Gauges of the United States
The minimum SLR of -17.63 mm/year in [13] is measured in the United States. Similarly in the United States we do have the maximum SLR of +10.25 mm/year in [13]. The highest sea-level rises worldwide are experienced in the Gulf of Mexico, in the United States, simply because the area is subjected to top subsidence rates.
Global sea-levels may rise everywhere due to the thermal expansion of the warming oceans and the melting of the ices on land, but obviously the relative rate of rise is then larger where the subsidence is higher.
The latest United States average rate of rise from the National Oceanic and Atmospheric Administration (NOAA) survey [14] is less +1.73 mm/year, biased upwards by the higher concentration of tide gauges along the East Coast, and predominantly driven by the subsidence of the land and the instrument, as it is shown in Figure 1.a, b, c.
Figure 1.a) and b) present the relative sea-level rise for the United States (images from [15] downloaded May 16, 2016) over the time window of data 1930 to 1999 and 1930 to 2014. The relative rates of rise are quite similar, somewhere larger and somewhere smaller, to demonstrate they haven’t accelerated that much. Over this century, the rates of rise of sea-levels haven’t accelerated that much in the United States and in every other area of the world where they have been measured.
Regarding the contribution by subsidence, Figure 1.c) is the vertical velocity of GPS domes (image from [16] downloaded May 19, 2016) monitored by the Système d'Observation du Niveau des Eaux Littorales (SONEL). The East Coast of the United States is affected by subsidence. The Gulf of Mexico is an area of intense subsidence. The West Coast of the United States is also mostly affected by subsidence but at a reduced rate, similarly to Hawaii. Alaska is affected by isostasy. The GPS velocities are a possibly inaccurate product, but at least they are constrained over the globe to plausible values opposite to the climate models computations never validated versus something really measured.
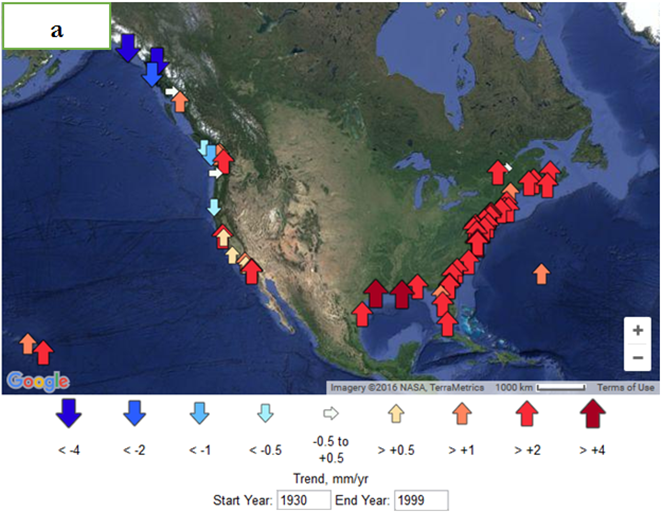
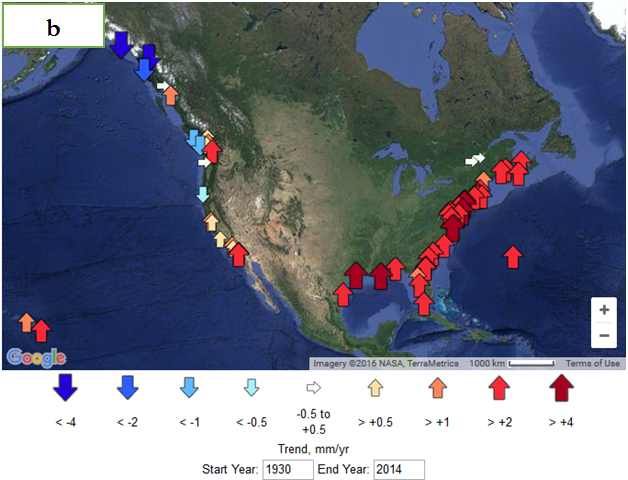
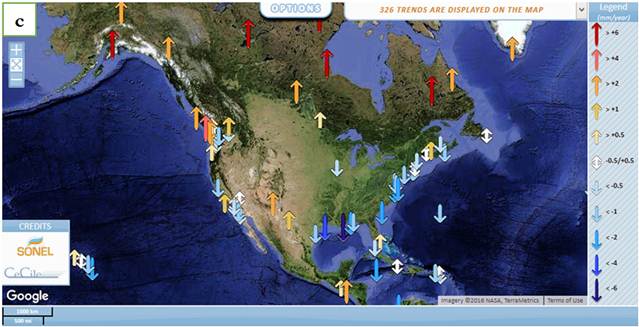
Figure 1. a, b) Relative sea-level rise for the United States (images from [15] downloaded May 16, 2016) over the time window of data 1930 to 1999 and 1930 to 2014. The relative rates of rise are quite similar, somewhere larger and somewhere smaller, to demonstrate they haven’t accelerated that much. Over this century, the rates of rise of sea-levels haven’t accelerated that much in the United States. Similarly, in every other area of the world where they are measured. c) Vertical velocity of GPS domes (image from [16] downloaded May 19, 2016). The East Coast of the United States is affected by subsidence. The Gulf of Mexico is an area of intense subsidence. The West Coast of the United States is also mostly affected by subsidence but at a reduced rate, similarly to Hawaii. Alaska is affected by isostasy. This makes increasingly unlikely to experience sea-level rises by 2,100 more than 20 cm.
7. Measured Oscillatory vs. Reconstructed Accelerating Patterns
Figure 1a) and Figure 1b) are only "qualitative" evaluations of sea level accelerations. Downloading the MSL data and computing the time history of the sea level rate of rise (velocity), evaluated by either using a fixed time window (30 years, 60 years) or all the data collected up to a given time, has been done already in many papers, as for example [8]. From the time history of the velocity, it is possible to infer the acceleration, i.e. the time rate of change of the sea level velocity. Synthetic estimations of sea level accelerations may also be obtained comparing subsequent sea level rates of rise surveys as the one by PSMSL or the National Oceanic and Atmospheric Administration (NOAA) [13,14].
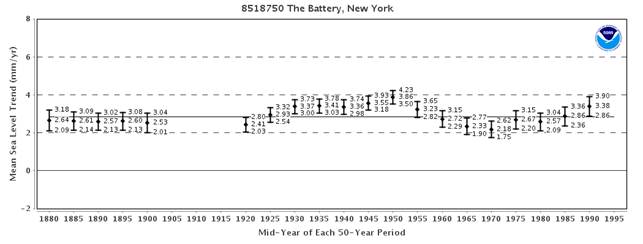
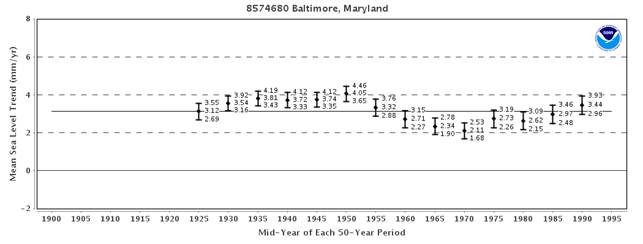
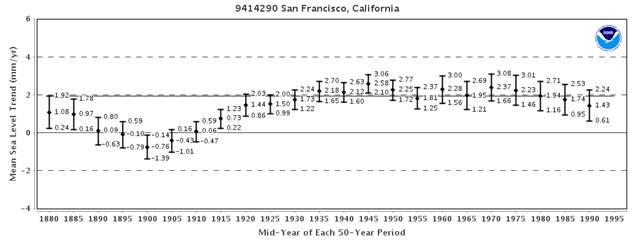
NOAA also provides [17] the time histories of the rates of rise of sea levels computed with a 50 years’ time window. As the sea level acceleration is the time rate of change of this sea level velocity, a mostly oscillatory pattern of the sea level velocity over the last few decades means there is no detectable sea level acceleration.
NOAA [17] proposes the computed variation of the 50-Year Mean Sea Level Trends. NOAA [17] provides the linear mean sea level trends calculated in overlapping 50-year increments for the 40 stations with sufficient historical data. The variability of each 50-year trend, with 95% confidence interval, is plotted against the mid-year of each 50-year period. The solid horizontal line represents the linear mean sea level trend using the entire period of record. The 50-year trend may also be referred to the end-year rather than the mid-year of each 50-year period representing the sea level velocity computed with a 50 years’ time window.
The computed sea level velocities are not increasing, but only oscillating, sometimes increasing and sometimes reducing. The images available for all the 40 tide gauge locations deemed of sufficient quality and length by NOAA have been downloaded from [17] and are proposed in the Appendix.
The oscillations of the sea level velocity reduce with more appropriate windows of 60-70 years, as the longest periodicity evidenced in the most part of the tide gauge records is quasi 60 years.
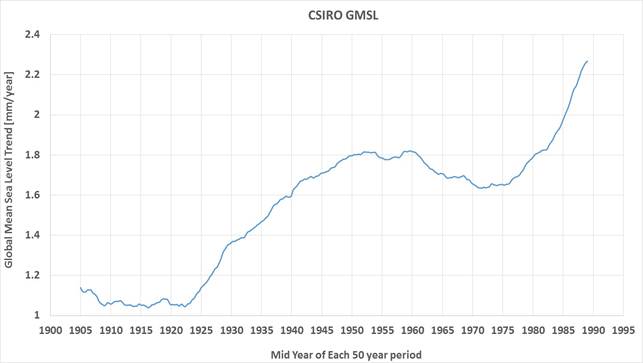
Figure 2 presents few of these distributions compared with the computed 50-Year Global Mean Sea Level (GMSL) Trends. The GMSL is a computational product by CSIRO quite popular in the climate change narrative. Then GMSL data is from [19]. The truly measured MSL at the individual tide gauges of the United States, similarly to what happens in all the other tide gauges of the world, have nothing in common with the CSIRO subjective reconstruction of the GMSL that is sharply accelerating in the last few decades while all the tide gauges that should support this global reconstruction are only oscillating. The sea levels could have been rising less in the 1800s, but there is certainly not enough information to fully understand. Then, they have been rising at about same speed from the beginning of the 1900s until now. The sharp acceleration of sea level rises since 1975 so popular in the global warming narrative is not confirmed by a single tide gauge of the world.

a
b
c

d
e
f
Figure 2. a, b, c, d, e) 50-Year Mean Sea Level Trends in 5 of the longest stations of the United States considered by NOAA more appropriate for quality and length (images from [17]). The remaining 35 stations are proposed in the appendix. f) 50-Year Trends of the CSIRO Global Mean Sea Level (data from [19]). The global warming narrative of accelerating sea levels is nowhere to be seen in the truly measured data for the United States, similarly to every other area of the world where there are tide gauges.
8. Causes of Floods in New Orleans
As Boyd, Pasquantonio, Rabalais & Eustis [3] are particularly concerned about New Orleans, it is not a novelty that this city is subsiding at extremely high rates, and the floods are certainly also the result of an improper planning and coastal and river management.
It has been recently shown as these subsidence rates are strongly spatially variable, somewhere very high and presently further increasing [18]. As it is shown in Figure 3. a, b, c, d (image reproduced modified after [18]), there are spots with up to +40-50 mm/years of subsidence, roughly 50 times the average relative sea-level rise of the 722 tide gauges of [13], or 100 times the average relative sea-level rise of the subset of 212 longest tide gauges of [13].
New Orleans is sinking at exceedingly variable rates due to a mixture of natural and anthropogenic processes. The highest rates of subsidence are upriver, around the industrial areas of Norco and Michoud, with up to 50 mm/year subsidence rate. Significant subsidence rates are also noted in New Orleans' 9th Ward, in Metairie, and at the Bonnet Carré Spillway east of Norco, where up to 40 mm/year subsidence rate are shown behind the levees structure and at neighbouring industrial facilities.
Ref. [18] cites as natural and anthropogenic processes contributing to this subsidence the withdrawal of water, oil and gas; the compaction of shallow sediments; faulting; the sinking of Earth's crust from weight of sediments; global glacial isostatic adjustment compensating for rise of land masses about the poles depressed by weight of ice sheets during the last glacial period.
In addition to subsidence and sea-level rise, other factors have to be brought in the picture to provide real solutions to floods. For example, another fact of concern is that the Mississippi River through Louisiana is overly channelized. All the water that enters the State is guided out to the Gulf preventing normal floods from replenishing the land, sometimes requiring that the Comite and Amite Rivers must flow backward.
A proper management of land, ocean and rivers and better urban planning is possibly a superior solution for New Orleans than the one-cause-fits-all approach of global warming prevention.
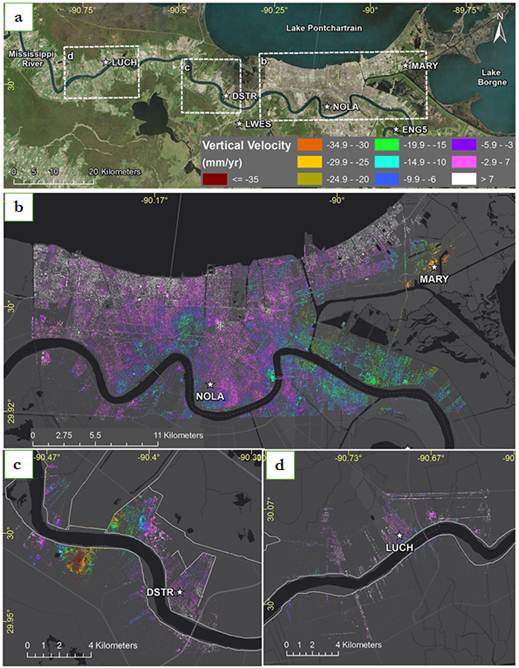
Figure 3. a, b, c, d) subsidence rates in New Orleans (image reproduced modified after [18]). New Orleans is sinking at exceedingly variable rates due to a mixture of natural and anthropogenic processes. The highest rates of subsidence were upriver, around the industrial areas of Norco and Michoud, with up to 50 mm/year subsidence rate. Significant subsidence rates were also noted in New Orleans' 9th Ward, in Metairie, and at the Bonnet Carré Spillway east of Norco, where up to 40 mm/year subsidence rate are shown behind the levees structure and at neighbouring industrial facilities.
9. Conclusions
There has been nothing measured since the last predictions of the Intergovernmental Panel on Climate Change (IPCC) Assessment Report (AR) 5 that motivates extreme aggravations of the sea-level rise claims. Actually, the local measurements at the tide gauges do not support the assumption of global sea level driven by the global carbon dioxide emission. Without any clear sign of sea level acceleration at the worldwide tide gauges, the most likely sea-level rise scenario is the prosecution of the trend, on average slow rising and acceleration free, that has been measured over the last decades. This is well below the less alarmist prediction of the IPCC AR5.
There is a growing discrepancy in between climate model predictions and true tide gauge measurements. As the sea levels are not following the global carbon dioxide emission, but strongly varies across the globe, there is a need of a proper localized rather than global solution for sea-level rise. For the specific of the United States, the average relative sea-level rate of rise (SLR) is constant at about +1.7 mm/year. This translates in less than 20 centimetres sea-level rise by 2,100. This relative rate of rise is mostly driven by subsidence. Those areas most prone to floods as New Orleans are experiencing extreme subsidence rates. It is concluded as localized solutions as proper management of land, ocean and rivers and better planning are superior to the one-measure-fits-all approach of global warming prevention.
10. Conflict of Interest
The author declares that there is no conflict of interest regarding the publication of this article.
Appendix - NOAA 50-Year Mean Sea Level Trends
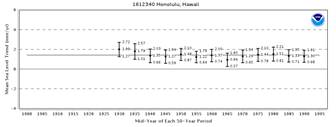
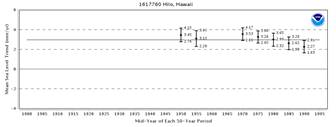
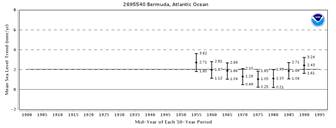
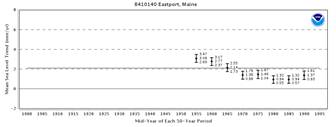
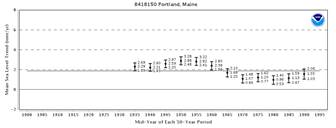
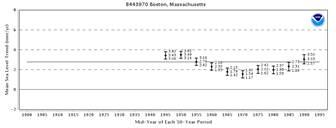
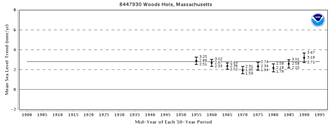
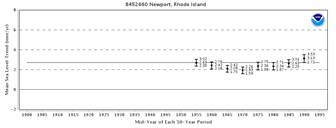
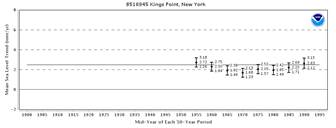

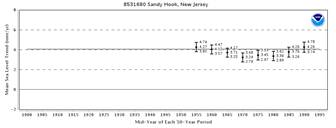
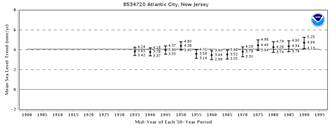
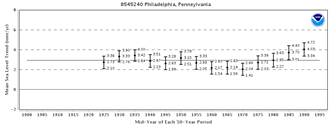
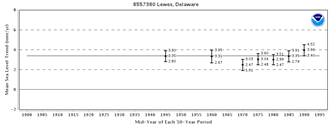


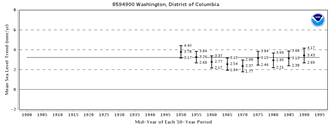
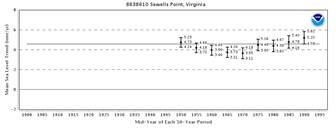
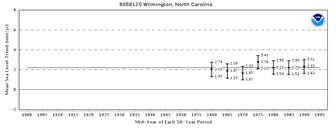
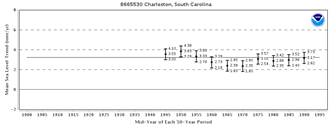
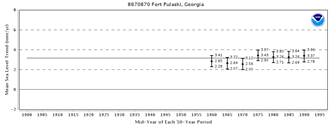
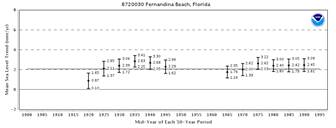
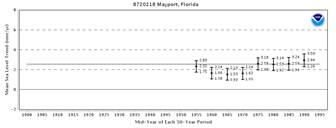
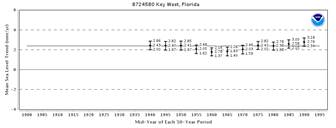
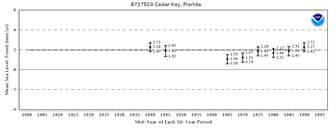
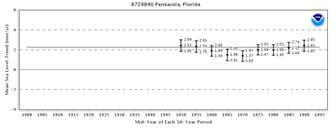
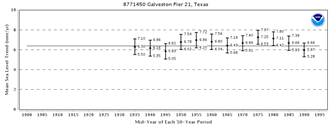
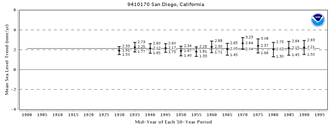
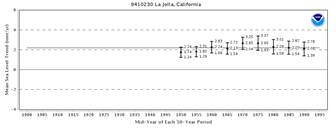
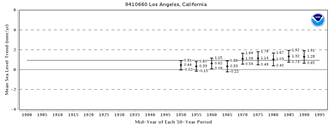
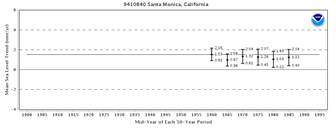
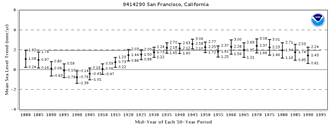
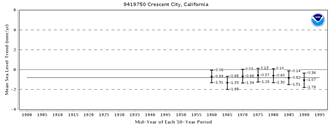
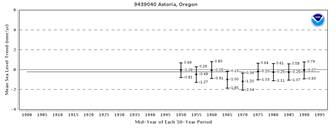
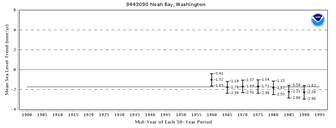
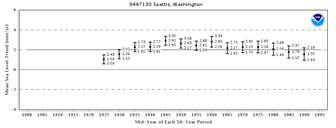
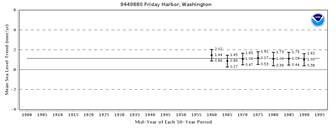
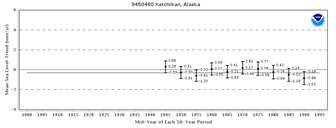
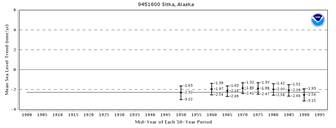
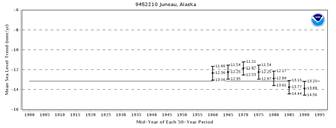
Figure A1. 50-Year Mean Sea Level Trends in the remaining 40 longest stations of the United States considered by NOAA more appropriate for quality and length (images from [17]).
References
- https://www.ipcc.ch/pdf/assessment-report/ar5/wg1/WG1AR5_Chapter13_FINAL.pdf
- B. H. Strauss, S. Kulp & A. Levermann (2015), Carbon choices determine United States cities committed to futures below sea-level, PNAS, 112 (44):13508-13513.
- E. Boyd, V. Pasquantonio, F. Rabalais & S. Eustis (2016), Although critical, carbon choices alone do not determine the fate of coastal cities, PNAS, 113 (10):E1329, 2016.
- B. H. Strauss, S. Kulp & A. Levermann (2016), Reply to Boyd et al.: Large long-term sea-level projections do not mean giving up on coastal cities, PNAS, 113 (10) E1330.
- Hannah, J. and Bell, R.G. (2012), Regional sea-level trends in New Zealand. Journal of Geophysical Research, 117:C01004-C01004.
- Houston, J.R. and Dean, R.G. (2012), Comparisons at tide-gauge locations of glacial isostatic adjustment predictions with global positioning system measurements. Journal of Coastal Research, 28:739-744.
- Mörner, N-.A. (2013), Sea-level changes past records and future expectations. Energy & Environment, 24:509-536.
- A. Parker, M. Saad Saleem and M. Lawson (2013), Sea-Level Trend Analysis for Coastal Management, Ocean & Coastal Management, 73:63-81.
- Watson, P.J. (2011), Is there evidence yet of acceleration in mean sea-level rise around mainland Australia? Journal of Coastal Research 27:368-377.
- A. Parker and C.D. Ollier (2016), COASTAL PLANNING SHOULD BE BASED ON PROVEN SEA-LEVEL DATA, Ocean and Coastal Management. Doi:10.1016/j.ocecoaman.2016.02.005.
- http://www.argo.ucsd.edu/
- https://nsidc.org/data/seaice_index/
- http://www.psmsl.org/products/trends/trends.txt
- http://tidesandcurrents.noaa.gov/sltrends/mslUSTrendsTable.htm
- http://www.psmsl.org/products/trends/
- http://www.sonel.org/-Vertical-land-movement-estimate-.html?lang=en
- http://tidesandcurrents.noaa.gov/sltrends/sltrends_us.htm
- C. E. Jones, K. An, R. G. Blom, J. D. Kent, E. R. Ivins & D. Bekaert (2016), Anthropogenic and geologic influences on subsidence in the vicinity of New Orleans, Louisiana, Journal of Geophysical Research: Solid Earth, DOI: 10.1002/2015JB012636.
- https://www.cmar.csiro.au/sealevel/GMSL_SG_2011_up.html


