
American Journal of Geophysics, Geochemistry and Geosystems, Vol. 2, No. 3, June 2016 Publish Date: Jul. 27, 2016 Pages: 23-30
Role of Geological Structures and Lithology in the Quantitative and Qualitative Changes of Takestan Aquifer
Naser Ebadati*
Geology Department, Science Faculty, Islamshahr Branch, Islamic Azad University, Islamshahr, Iran
Abstract
Takestan region constitutes part of the feeding and underground waters intake to Qazvin plain aquifer and such waters gradually change quantitatively and qualitatively through time along the path. The aim of this study is determining the interactive effects of water sources and geological structures, lithology and the resulting qualitative changes as well as evaluating the role of structural factors in quantitative changes of the area water sources. For this purpose, to assess the underground water sources and range of groundwater tables the existing 144 exploratory boreholes in the understudy area range were used and physical and chemical analyses were performed through sampling from the wells in 5 station and the changes in anions, cations, TDS, EC and TH values for either one of the parts were obtained. Based on the results of surface waters and groundwater tables' quality analysis as well as examining the geological maps, this paper deals with the analyzing of the relationship between water features and structural-geological changes of the under study area. There is a significant relationship between lithology features, structural geology of the basin and quantitative-qualitative changes of water sources in the area.
Keywords
Takestan, Aquifer, Hydrogeology, Quality Changes
Received: June 5, 2016
Accepted: June 14, 2016
Published online: July 27, 2016
@ 2016 The Authors. Published by American Institute of Science. This Open Access article is under the CC BY license. http://creativecommons.org/licenses/by/4.0/
Contents
1. Introduction 2. Material and Method 2.1. The Exploitation Status of Water Sources Underground in the Study Area 2.2. Effect of Geologic Formations in Development of Water Sources in the Region 2.3. Hydrodynamic Coefficients Aquifer 2.4. Physico-Chemical Investigation of the Water Sources 3. Result and Discussion 4. Conclusion Acknowledgments
1. Introduction
In Takestan region (west of Qazvin province) the low precipitation volume and high evaporation in this plain besides more than 50% shortage of precipitation and other adverse hydrogeological conditions has caused the high water and important rivers of the area to stop flow. The exploitation level in the area is higher than the feeding rate and causing falling down of the underground water level and consequently shortage of the water sources' budget in area [1, 5]. Harzandat plain area located adjacent to Takestan and Qazvin plain studied the effect of geological formations on the quality of groundwater sources and concluded that the plain’s underground water table has been constituted from fine particle sediments like silt and clay accompanied by sand and gravel that are materials with law permeability. Therefore this has caused low velocity flow of the underground water and extended retention time of underground water inside the table, ultimately resulting in declining of water quality under the influence of marl lime units and red conglomerates with marl interlayers [3, 4].
Askari (2009) used and geographical information system (GIS) and geo statistical method to study the local changes of the underground water quality of Qazvin plain and proposed that Qazvin plain is almost bowl like in shape and the underground and surface waters are entered from all directions and ultimately in eastern part where lies the weakest area of the basin, the water passes through a saline pass way, so that it changes considerably when reaching Qazvin plain [5]. Abdinam (2004) analyzed the salinity of Qazvin plain soil in Takestan region through preparing the soil salinity map using developing correlation between the satellite data and numerical values. [1] Haqighi (2006) studied the surface and underground waters of Takestan plain region and concluded that dramatic drop in the level of the groundwater table in Takestan plain and construction of a series of reservoirs in Qazvin plain during the recent years and decline of the precipitation has caused severe reduction of the rivers basins [11]. Azizi (2004) studied the severity of drought and the relationship between the climatic and hydrogeological droughts using precipitation and groundwater's data in Takestan region of Qazvin plain and obtained the following results: The number of precipitation negative anomalies during the study period has been more than the positive ones and the effect of human activities in the negative anomalies of the area ground waters is highly impressive; the drought of the ground waters occurs with a delay of about two to three month compared with the climatic droughts. On average, during the study period the underground water level has dropped for about 25 cm each year [7]. The special topographic status and permeability of the most streams and channels' pathways plays a major role in wasting considerable amounts of water; long path and failure in dredging of the streams and growing of weeds in their path would cause slowness of flow of water, enhancing evaporation and sweating and ultimately higher wasting of the water [16]. According to the description mentioned in this paper The aim is determining the interactive effects of water sources and geological structures, lithology and the resulting qualitative changes as well as evaluating the role of structural factors in quantitative changes of the area water sources.
2. Material and Method
Images the drainage basin range was determined and accordingly the geological formations and existing faults and outcrops of the study area were investigated [1, 14] and evaluated. To determine the initially through geomorphological analysis and field observations as well as using satellite wells and groundwater sources' locations and the groundwater tables' range a total of 144 exploratory boreholes existing in the area dug by Qazvin Water Sources Organization were used and the findings were used for preparing the relevant maps [9]. In the next stage sampling was made from the wells and surface waters of the under study area in 5 stations and the samples underwent experimental analysis to determine the qualitative changes of the water in terms of drinking, agricultural and industrial consumptions. For determining the relationship between the formations and the structural factors in the quantitative and qualitative changes of the water, the statistical data analysis was also performed besides the structural analysis, to be dealt with in the following sections.
2.1. The Exploitation Status of Water Sources Underground in the Study Area
According to the retrieved statistics, the ‘wells’ are the only groundwater sources used in the study area for various consumptions and the springs or aqueducts are not used. The consumptions of the wells' waters are often the agricultural or potation uses. The last statistics of the water sources in the study area belongs to the year 2002. So we will discuss the study area groundwater sources in the following section [18].
In the under study area based on the number of 144 wells have been recorded. The annual discharge from the area wells amounts to about 69.12 m/cu. m. The highest yielding well in the area yielded 82 l/sec. of water that was used mainly for the irrigation of grape orchards and agricultural consumptions [18]. In the year 2011 some 134 deep and 10 semi-deep wells have been identified in the area. The depth of the regional wells reached to 12 to 170 m with an average of 83 m in depth. The minimum, maximum and average depth of the wells was 12, 170 and 83 meters respectively (Fig. 1). The wells with 70 to 100 m depth and the wells less than 50m in depth have the highest and lowest frequency in the area respectively [12, 22]. The yield of the understudy area wells based on the year 2010-2011 statistics lies somewhere between minimum 0.1 l/sec. and maximum 80 l/sec. with an average yield of 20.44 l/sec. The average yield of deep and semi-deep wells is 21.6 and 0.54 l/sec. respectively. Figure 2 show water transmissibility in aquifer. Considering the above graph the wells with the yield 0.1 to 10 have the highest frequency and the wells with a yield higher than 60 l/sec. have the lowest frequency. It’s worth mentioning that the yield information has been given for 109 wells in this statistics [12].
In these wells the annual discharge volume is variable between 594 m3 and 1.11mill/m3. The annual average water discharge of all the wells is 0.3 m/m3. In general the annual discharge of more than 1mill/m3 per year was observed only in 1 well amongst all the wells in the under study area. On the whole annually 34.13 mill/m3 of groundwater in the area is discharged by authorized exploitation wells. The highest share from this volume with a discharge 26.5 mill/m3 belongs to the agricultural sector and the next highest discharge 7.09 mill/m3relates to the drinking consumptions [18,22].
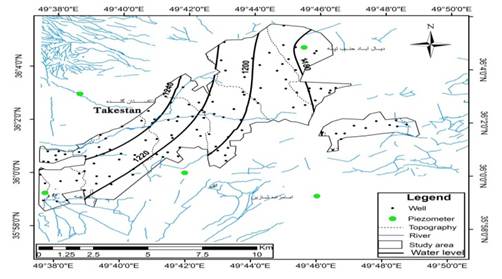
Fig. 1. Map of contour line static water table and sampling wells position.
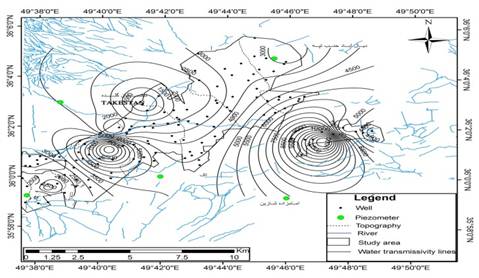
Fig. 2. Map of contour line water transmissibility in aquifer.
2.2. Effect of Geologic Formations in Development of Water Sources in the Region
Generally the geological formations based on the expansion of formations with different lithology and specific physical and karstic features like permeability, porosity, shear fractures, dissolution cavities, their thickness and distribution level in the area can be classified in 3 groups of impermeable, semi-permeable and permeable categories. Hydro geologically the under study area is part of Qazvin plain which has been formed due to a tectonic geraben and has been filled with the materials conveyed from the adjacent heights by the flowing waters. Various sedimentation systems and numerous rivers and floodways have cause development of a giant aquifer in the area featuring variety in terms of the nature and shape of the sediments as well as the water yielding power of the groundwater tables so that in the foothills, the heights and alluvial fans the tables have a free state and it can be said that plain has only one big table, but the more the plain expands towards the center and east the tables are separated from each other due to the existence of clay stratums and the water yielding power of the table declines. A survey of geophysical studies and exploratory excavations shows that in the central plain and from southeast towards northwest -along the hills and highlands of Eshtehard to the north of Takestan- the bed rock has risen in the form of an anticline and has developed two synclines in northwestern and southern parts [2,10]. The northern syncline is fed by the northern heights rivers and floodway while western rivers like Abhar-roud and Khar-roud as well as the southern floodways feed the southern syncline and both synclines end up in Miocene sediments around the swampland. This tectonic set has created Takestan plain aquifer which has a geraben state with its deepest part lying in the central plain around Qazvin- Boein-Zahra road, near Kahkin and Esmatabad [6, 17 and 21].
In the understudy area, the alluvial deposits due to their broad spread and suitable permeability in the foothills and the plain margins have accommodated the larger part of the groundwater sources. Generally the flow of water is drained from the lime or feeds the nearby alluviums. The plain is related to Hashtgerd plain aquifer in respect with the groundwater sources and in fact hydro geologically Hashtgerd and Qazvin complexes are regarded one hydrogeological unit and have one common output pass way in Eshtehard highlands that leave the area in spillway form, so that the swamp behind Eshtehard highlands is fed by the surface waters coming from Kordan to Haji-Arab Rivers. To determine the grading state and the aquifer type in the under study area the geophysical studies previously carried out in Qazvin Plain has been used. Based on these studies Qazvin aquifer has differences in some parts from the sedimentology perspective [4,8].
2.3. Hydrodynamic Coefficients Aquifer
In Takestan plain a number of 104 wells have been tested using pumping test and based on the results the coefficient of map for aquifer of the under study area has been plotted (Fig. 2). The analysis of the above map indicated that the transmissibility coefficient in the area is variable between 500-1200 m3/day. Also the average coefficient of storage in the area aquifer is somewhere between 8 and 10. Also in order to determine the aquifer's groundwater level status the measured data of the water level accumulated by the piezometers around the area was used and the groundwater level map in months April and September 2014 was prepared. Considering the above map, the groundwater flow direction and the hydrological slop of the aquifer is from north and northwest areas towards the east and southeast areas. This indicates that the feeding role of the northern formations is limited. In the under study area the co-potential numbers of groundwater level varies from 1240 m in the north and northwest areas to below 1180 m in the east and southeastern regions. In order to analyze the trend of groundwater level fluctuations in Takestan area the hydrograph of 20 piezometers pertaining to March-April 1999 to August- September 2010 was plotted, all showing the drop of the underground water level [12,22].
2.4. Physico-Chemical Investigation of the Water Sources
Electrical conductivity (EC): To evaluate the saline status of the area aquifer the Electrical conductivity fields was provided. Based on the change trends, generally the EC level is increased form west to east and the average level is 1600 EC Micro mhos/cm. Considering the determined EC level and the interpolation performed for the area range over ally the results are indicative of the increase in the amount of EC from the west to the east, along with Abhar-roud direction. Since the EC level is related to the rate of ions dissolved in water, the present study considerations in this regard are indicative of the increase in the rate of surface waters' ions due to the passage of water on the mainly evaporative formations and their dissolution (Fig. 3).
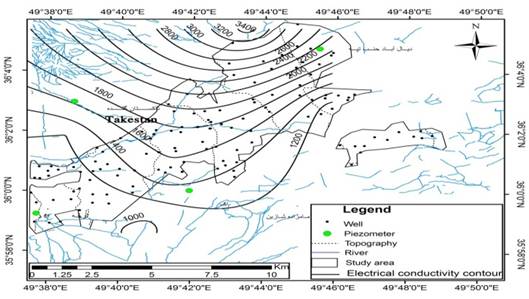
Fig. 3. Map of contour line and frequency of EC in the groundwater.
Water acidity (pH): To evaluate the acidity of the under study area the acidity zonation ranges was plotted (Fig.4). Approximately the pH of the ground waters in the under study area was about 7 [23,24].
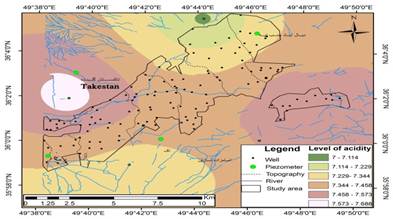
Fig. 4. Map of contour line and frequency of pHin the groundwater.
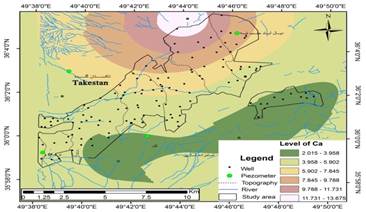
Fig. 5. Map of contour line and frequency of Cain the groundwater.
Calcium: On the whole, the Ca+2 ions in the under study area is increasing from south and southwest towards north and northeast.
Sulfate: So4-2 is one of the main Anions in the water the main origin of which is the oxidation and hydration of metal sulfides like iron, nickel, copper, zinc and lead that enter the groundwater sources after dissolution in the atmospheric waters [11,17] Figure 6 shows the zonation fields of So4-2 in the area groundwater prepared. The above map is indicative of the high values of Sulfate in north eastern of the range.
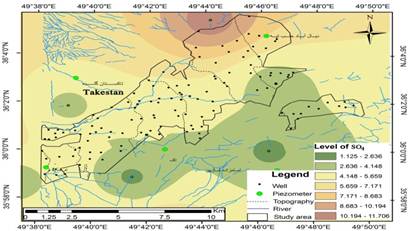
Fig. 6. Map of contour line and frequency of SO4in the groundwater.
The decrease in the temperature or increase in the pressure causes the increase in the solubility of Carbon dioxide in the water. The dissolved Carbon dioxide takes different forms depending on the pH value of the water:
In pH values less than 4.5 this material is seen as Carbonic acid (H2CO3) in pH values of 4.5 to 8.2 it takes the form of HCO3 CO2 equilibrium and in pH values above 8.2 it appears in the form of carbonate and bicarbonate [23]. Considering the zonation fields of Bicarbonate the western parts indicate the lowest and the eastern margins of the plain represent the highest values.
Increasing the Cl- amount initially gives undesirable taste to the water and in higher concentrations has corrosive effects on the water supply facilities and household appliances [13,15]. Knowing the amount of Cl- ion in the groundwater makes it possible to determine the status of the formations of the basin, the alluvial components, the desert and evaporative area ranges, output pass ways and finally the areas feeding from the surface waters. The Cl- as the influential ion on the electric conductivity has direct relationship with EC [20]. In order to examine the periodic changes of the Chloride ion in the area, the zonation fields of the Cl- was plotted. On the whole Cl- level is increasing in the under study area from the north to the south (Fig.8).
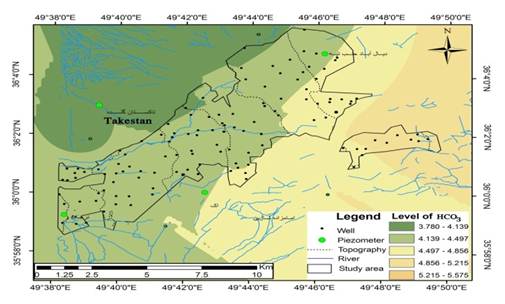
Fig. 7. Map of contour line and frequency of HCO3 in the groundwater.
Fig. 8. Map of contour line and frequency of Cl- in the groundwater.
3. Result and Discussion
Assessment of the Ground Water Sources Quality for Potation Purposes
The overall amount of the soluble solid materials or total dry solids (TDS) is one of the main parameters of in classification of the waters concerning different consumptions like potation, etc. [20]. Also total hardness (TH) relates to specific solvents which are soluble in the water and increase the water weight; these solvents mainly include cations such as calcium, magnesium, strontium and silicate anions and soluble nitrate that are present in the water.
pH: To evaluate the acidity of the under study area the map of co-acidity ranges was plotted and shows that the average pH for the ground waters of the understudy area is about 7. However since the pH has relationship with bicarbonate ion, the zonation fields of Bicarbonate of the area ground waters show that in the western parts are having the least content of this material and the highest amount of bicarbonate can be seen in the plain eastern margins. This process is due to the hydraulic slop from the east to the west and dissolution of carbonated units in the ground waters with an increase in bicarbonate content from the western parts to the east.
Ca+2: In general the Calcium ion content in the under study area is increasing from the south and southwestern parts towards the north and northeast parts. The Ca+2 content in the initial section of Abhar-roud River is increasing due to dissolution of evaporative units (especially limestone) in the groundwater and decreasing gradually toward the exit plain.
SO4-2: The zonation fields of SO4-2 in the groundwater of the under study area shows that higher contents of SO4-2 exist in the northeast parts compared with the southern parts, the reason of which can be attributed to the decomposition of sulfide containing minerals from pyroclastic formations in the northern margins of the plain and their entrance into the groundwater.
Salinity changes (Cl-): Knowing the amount of Chloride ion it would be possible to a large extent to acquire knowledge of the basin's formations, alluvium components, desert areas and evaporative ranging, exit pass ways and finally the feeding areas of surface waters [19]. To investigate the Chloride ion time changes in the area, the zonation fields of Cl- was plotted. The Cl- content volume increases from west to the east. This can be due to the dissolution of the evaporative stratums in the ground waters.
4. Conclusion
In the highlands of the area the groundwater flows northward the reason of which can be due to the existence of faults with thrust mechanism with northward slope (the branching of north Qazvin fault) which leads the flow direction towards the north Also the transmissivity of groundwater in the mountainous regions is higher due to the performance of the faults and expansion of shear fractures and cavities compared with the concentrated stratums; this shows the hydraulic relationship as the water sources playing role in feeding of the aquifer.
The groundwater flows from the highlands towards the lowlands and during motion, they dissolve the Oligocene evaporative stratums and consequently they increase the amount of solvent ions and salinity of the water. The increase in the EC value from the west toward the east is indicative of the water flowing on the mainly evaporative formations and their dissolution.
The acidity of under study area is about 7 but in general the pH value is indicative of the increase in Bicarbonate value from the west towards east in the groundwater of the area.
The Ca+2 rates in the east has increased and towards the exit of the plain aquifer it decreases due to the dissolution of limestone units into the groundwater along the flow direction. The increase in the SO4-2 rate in groundwater in northeast of the area is caused by the decomposition of Sulfide containing minerals and the Cl- rate changes is also increased in west-east direction which is due to the dissolution of evaporative stratums in the groundwater.
Acknowledgments
We would like to express our sincere thanks to the respected management of Gazvin province Regional Water organization for facilitating the ground for this study and compilation of this research.
References
- Abdinam A., (2004); Mapping soil sampling survey using satellite data with numerical values of soil salinity in the plain of Qazvin.
- Alberti, A.A., Comin-Chiaramonti, P., Dibattistini, G., Nicolletti, M., Petrocciani, C., Siniqoi, S., (1976); Geochronology of the eastern Azerbaijan volcanic plateau (north-west Iran), Rc. Soc. Ital. mainer. Petr, Vol. 32, pp. 579-589.
- Aganabati, A. (2004); Geological of Iran, published Geological survey of Iran, edition 1,556p.
- Annells, R.N., Arthurton, R.S., Bazely, R.A., Davis, R.G., 1975. Explanatory text of the Qazvin and Rasht quadrangles map (1:250000), Geological Survey of Iran.
- Askari.,A. Masaedi. A (2009); Spatial analysis of ground water quality by geostatistical analysis of geographic information systems in Qazvin Plain study,
- Asiabanha, A. (1991); petrology and geochemistry of the volcanic rocks of Mulla Ali, North West Qazvin, Master's thesis, Tehran University, 152 p.
- Azizi G., (2003); Regarding the recent drought and groundwater resources in the plain of Qazvin, geographical research.Vol. 46, pp131-143.
- Berberian, M.,(1983); southern Caspian: A compressional depression floored by a trapped, 1983.modified oceanic crust, Canadian Journal of Earth Science, Vol. 20, pp.163-183.
- Dehghani, AA. Asgari, M. Masaedi, A.,(2009); Comparison of three methods of artificial neural networks, fuzzy inference system, neural adaptive and geostatistical interpolation groundwater level, A Case Study of Qazvin, Iranian journal Agricultural Sciences and Natural Resources, Vol.5,No. 16, pp.517-528.
- Ebadati, N., Sepahvandi, S. (2015); Role of geological structures and lithology in the quantitative and qualitative changes of Eshtehard aquifers, Iranian journal of Echo hydrology, Vol.2, No.1, pp.117-128.
- Hagigi, S., lashkari, M., (2006). Analysis of surface water and groundwater in the plain of the vineyards, the second Regional Conference on Applied Geology and Environment, proceeding, Islamic Azad University Islamshahr branch, P. 23.
- Jafari, Z., (2015); Role of geological structures and lithology in the quantitative and qualitative changes of Takestan aquifer. Master theses, Islamic Azad University, science and research branch, Tehran, 121p.
- Kanakoudis V., Tsitsifli, S. Samaras P., Zouboulis A. (2015); Erratum to: Water Pipe Networks Performance Assessment: Benchmarking Eight Cases Across the EU Mediterranean Basin; Water Quall Expo Health 7:109-DOI 10.1007/s12403-014-0124-8.
- Lashkari, M., Lashkaripour, G.,(2011); Quality assessment of Iranshahr groundwater and water quality effects of geological formation, Proceedings, 3th conference of Earth Sciences, Geological Survey of Iran, pp.1-7.
- Masoudi, M.; Patwardhan, A M. Gore, S D.,(2006); A new methodology for producing of risk maps of soil salinity, Case study: Payab Basin, Iran, Jour.. Appl. Sci. Environ., Vol.10, No.3, pp. 9–13.
- Nabeel M. Gazzaz, Kamil Yusoff,M. Zaharin Aris,A. Juahir, H. Firuz Ramli, M.(2012); Artificial neural network modeling of the water quality index for Kinta River(Malaysia) using water quality variables as predictors, Marine pollution bulletin,Vol.64,No.11 pp:2409-2420.
- Peyrovan, H. (2001); geochemical study of hydrothermal alteration zones of magmatic rocks Tarom and its environmental impacts, petrology Ph.D. thesis, Islamic Azad University, Science and Research Branch of Tehran,134p.
- Qazvin Province Regional Water Organization: QPRWO (2011); According to the chemical characteristics of ground water (hydro geochemistry) study area Takestan. Office basic studies, studies report of water balance of the Takestan, Vol.1, 86p.
- Sarani, N. Soltani, J. Sarani,S. and Moasheri, A., (2012); Comparison of artificial neural network and multivariate linear regression model to predict sodium adsorption ratio (Case Study: Sistan River, Iran), International Conference on Chemical, Ecology and Environmental Sciences (ICEES'2012) march 17-18, Bangkok, proceeding, Vol.1 pp.130-134.
- Sedagat, M. (2003); Earth and water source (hydro geology), published of Payam Noor university (Iran), 385p.
- Taherkhan b.,(2010); Morpho tectonics and youth movements fault north of Qazvin, a master's thesis, Shahid Beheshti University,Iran, 105 p.
- Tooss Ab Consulting Engineers. (2009); Hydrogeology Report Water Resources of Qazvin, Volume III, Regional Water Qazvin Province Organization, 89 p.
- World health organization: WHO (1993); Study protocol for the world health organization project to develop a quality of life assessment instrument (WHOQOL), Division of mental health, Switzerland, special report, journal. Quality of life research, Vol.2, pp.153-159.
- W0rld health organization: WHO(2004); Guidelines for drink water W.H.O, wuliy, Vol. 102 and 103, WHO, GENEVA.


