
American Journal of Geophysics, Geochemistry and Geosystems, Vol. 1, No. 4, October 2015 Publish Date: Aug. 12, 2015 Pages: 149-154
Laboratory Method for Estimating Solute Transport Parameters of Unsaturated Soils
Kanzari S.1, *, Hachicha M.1, Bouhlila R.2
1National Research Institute for Rural Engineering, Water and Forestry, INRGREF, University of Carthage, Ariana, Tunisia
2Laboratory of Modeling in Hydraulics and Environment, National Engineering School of Tunis, Tunis, Tunisia
Abstract
Modeling the contaminant transport process in soils requires the solute transport parameters. Displacement experiments were carried out on soil columns (Sand – Silt – Clay) by injecting a solution of 0.8 M KCl in a steady state. Breakthrough curves are symmetrical, characteristics of an equilibrium solute transport. The hydrodynamic dispersion coefficients were estimated by optimizing the measured breakthrough curves with the analytical solution of the advection-dispersion equation (EAD) by the software CXTFIT. The validations of the results were performed by a direct simulation with Hydrus-1D model. The estimation results were assessed by calculating the mean square error RMSE, the average geometric error GMER and the non-parametric Mann-Whitney test. Statistical analysis showed the success of the used method to estimate the solute transport parameters of the studied soils.
Keywords
Soil, Displacement Experiment, Parameter Estimation, CXTFIT, Hydrus-1D
Received: July 8, 2015
Accepted: August 5, 2015
Published online: August 12, 2015
@ 2015 The Authors. Published by American Institute of Science. This Open Access article is under the CC BY-NC license. http://creativecommons.org/licenses/by-nc/4.0/
Contents
1. Introduction 2. Transport Problem 3. Materials and Methods 3.1. Soil Column Preparation 3.2. Parameters Estimation 3.3. Direct Simulation with Hydrus-1D 3.4. Statistical Analysis 4. Results and Discussion 4.1. Breakthrough Curves of the Three Soils 4.2. Relationship Between Dispersivity and Water Content 5. Conclusion
1. Introduction
Over the past few decades, the characterization of the solute transport parameters in the unsaturated zone has been the center of interest of researchers in environmental sciences. These parameters play a major role in the transport of contaminants in the soil. However, the characterization of water flow and solute transport in the soil is a complex operation that requires the coupling of mechanistic models with appropriate data of water content and solutes concentration variations (álvarez-benedí and munoz-carpena, 2005).
The mechanistic model describes the process of solute transport in the using the advection-dispersion equation (EAD). It in the case of a non-reactive transport, the transport parameters are the coefficient of hydrodynamic dispersion and the coefficient of molecular diffusion. In the absence of a slow water flow in the unsaturated soil, the coefficient of molecular dispersion can be neglected and the transport parameters are reduced to the coefficient of hydrodynamic dispersion. The estimation of this coefficient is quite difficult since there are no direct methods of measurement. In fact, indirect methods are used for the determination of this coefficient. In the most cases, these methods are experiments of solute displacement through soil columns in the laboratory. The dimensions of the soil columns mentioned in the literature vary between a few centimeters to 100 cm in diameter, and from 10 cm to over 3 m in height (Vanderborght and Vereecken, 2007). This gives an idea on the large number of experimental situations which can be covered from situations close to the laboratory scale to other more related to field scenarios. Several types of solute have been used like miscible substances, isotopic tracers and chemical tracers. These latter are the most easy to characterize, as the measurement of the electrical conductivity for the potassium chloride (KCl) by Mallants et al. (1994) and Goncalves et al. (2001).
The characterization of the solute concentration as a function of time is called the breakthrough curve which corresponds to an analytical solution of the advection-dispersion equation in the appropriate boundary conditions. By adopting an inverse solution of the EAD equation, the dispersion coefficient is thus estimated. The available analytical tools for the interpretation of the breakthrough curves are few in number. The main codes are: the software CATTI (Sauty et al., 1992), TRACI95 (Käss, 1998), QTRACER2 (Field, 2002), specialized in the karstic areas and CXTFIT (Torrid et al., 1999) available via the program STANMOD (Šimůnek et al., 1999), built for the laboratory experiments. These software programs have been developed with the operating systems MS-DOS (Li et al., 1999; Tang et al., 2010) which explains that some of them are no longer compatible with the latest operating systems such as Windows except in the case of CXTFIT (Torrid et al., 1999) and STANMOD (Šimůnek et al., 1999).
The objective of this paper is the characterization of chemical tracer (KCl) migration through a soil column and using the software CXTFIT 2.1 to adjust experimental data on analytical solutions of the EAD. The expected results will enable the estimation of the dispersion in unsaturated soils.
2. Transport Problem
The classical one-dimensional ADE for equilibrium transport during steady state in a homogeneous soil is given by:
![]() (1)
(1)
where z and t denote depth (L) and time (T), C is the solute concentration (ML-3), D is the dispersion coefficient (L2T-1), v is the average pore-water velocity (note that v = Jw/q with Jw as the Darcy or volumetric water flux density (LT-1) and q as the volumetric water content), and R is a retardation factor to describe the effect of linear equilibrium adsorption on transport. The latter factor is defined by:
![]() (2)
(2)
in which ![]() is the soil bulk density (ML-3) and Kd is the distribution coefficient quantifying the relative amounts of solute in the liquid and solid phases (M-1L3).
is the soil bulk density (ML-3) and Kd is the distribution coefficient quantifying the relative amounts of solute in the liquid and solid phases (M-1L3).
By making the following changes of variables: ![]() (number of pore volumes) and
(number of pore volumes) and ![]()
![]() (3)
(3)
Equation (3) admits analytical solutions for known initial and boundary conditions (van Genuchten and Parker, 1984; Leij et al., 1993).
For the case of a solute injection by pulse with a duration τ and using the following initial and boundary conditions (Parker and van Genuchten, 1984; Leij et al., 1993):
![]()
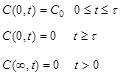 (4)
(4)
the solution is (Parker et van Genuchten, 1984):
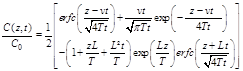 (5)
(5)
3. Materials and Methods
3.1. Soil Column Preparation
Three soils presented in Table 1 were sampled from a land parcel (35°15’47.58’’N; 10°4’17.16’’E in the village of Bouhajla (Central Tunisia). The soil samples were crushed and then placed in small clear plastic column (5.5 cm diameter / 10 cm long). Vertical soil columns were saturated slowly from the top (Figure 1). Steady-state flow conditions were established by maintaining a 3 cm layer of solute-free water on top of the soil. Subsequently, the water supply was interrupted. Immediately after all ponded water had infiltrated, a 50 ml pulse of a 0.8M KCl solution was applied. The initial time for the breakthrough curve (T = 0 in the initial condition) was determined by the moment when the solution was first spread uniformly over the soil surface. As soon as all the applied solution infiltrated the soil, solute-free water was again added to the soil surface to establish a 3 cm water level on top of the sample. Effluent samples of approximately 100 cm3 were collected. The Cl- concentration of the effluent samples was determined potentiometrically. For all 3 soils a chloride breakthrough curves BTC was obtained with the dimensionless concentration leached through the soil column as a function of time.
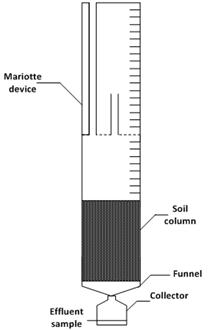
Figure 1. Schematic diagram of soil column experiment.
Table 1. Soil particle size analysis of the three soils.
| Soil | Clay (g kg-1) | Silt (g kg-1) | Sand (g kg-1) | Texture (USDA*) |
| 1 | 9.5 | 4.5 | 85 | Sand |
| 2 | 12.5 | 30.5 | 57 | Silt |
| 3 | 35 | 5 | 60 | Clay |
* Scheme: United States Dept. of Agriculture
3.2. Parameters Estimation
Transport parameters were then obtained with the non-linear parameter estimation code CXTFIT 2.1 of Toride et al. (1999) by fitting solutions of the CDE to observed breakthrough data. The software is based on the least squares method for the parameters optimization. The retardation factor (R) occurs only for reactive solutes. For non-reactive (ideal tracer), R is equal to 1. The only parameter of this equation is then to determine the dispersivity (l).
![]() (6)
(6)
3.3. Direct Simulation with Hydrus-1D
The Hydrus-1d model (Šimůnek et al., 2005) simulates one-dimensional water flow and solute transport in incompressible, porous, variably saturated media, in steady or transient regime, for a known metric system and various time steps. Hydrus-1d solves a modified version of the Richards (1931) equation in order to complete water movement modeling and the EDA equation for solute transport. KCl displacement experiment in a steady hydrodynamic regime have been the subject of a direct numerical simulation using the Hydrus-1D model in order to validate the estimated values of dispersivity. The water content values for each soil type: sand, silt and clay are, respectively, 0.253, 0.394 and 0.411 cm3.cm-3. Table 2 summarizes the geometric information of the domain, the hydrodynamic parameters and boundary conditions used as model input parameters for the three soils. Solute transport parameters are specified in the results section.
Table 2. Hydrus-1D Input Parameters.
| Parameters | Values | ||
| Domain information | |||
| Length | 10 cm | ||
| Layer | 1 | ||
| Observation nods | 1 at 10 cm | ||
| Times Information | |||
| Sand | Silt | Clay | |
| Duration | 110 mn | 100 mn | 400 mn |
| Output data | 1 at the end of each simulation | ||
| Hydrodynamic Properties | |||
| Sand | Silt | Clay | |
| qr (cm3.cm-3) | 0.01678 | 0.0093 | 0.07620 |
| qs (cm3.cm-3) | 0.25305 | 0.39429 | 0.69635 |
| a (cm-1) | 0.0104 | 0.00854 | 0.00774 |
| n (-) | 2.62368 | 1.71022 | 1.39895 |
| Ks (cm. j-1) | 129.67 | 62.98 | 15.04 |
| Boundary Conditions | |||
| Water Flow | |||
| Upper | Constant Water Content | ||
| Lower | Neumann | ||
| Solute Transport | |||
| Upper | Dirichlet | ||
| Lower | Neumann | ||
3.4. Statistical Analysis
To evaluate the measured dispersivities values by the proposed laboratory method, two statistical parameters were used: the root mean square error (RMSE) and the geometric mean error ratio (GMER). These statistical parameters are calculated as follows:
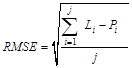 (7)
(7)
![]() (8)
(8)
where ![]() is the value measured by the laboratory method,
is the value measured by the laboratory method, ![]() is the value of the direct simulation and
is the value of the direct simulation and ![]() is the number of observations. The RMSE and the GMER equal to 0 and to 1, respectively, correspond to an exact match between observed and fitted data. The GMER value less or greater to 1 indicates that the corresponding model underestimates or overestimates fitted data. The smaller (closer to 0) the RMSE value was, the better the model was.
is the number of observations. The RMSE and the GMER equal to 0 and to 1, respectively, correspond to an exact match between observed and fitted data. The GMER value less or greater to 1 indicates that the corresponding model underestimates or overestimates fitted data. The smaller (closer to 0) the RMSE value was, the better the model was.
4. Results and Discussion
4.1. Breakthrough Curves of the Three Soils
The measured breakthrough curves by the displacement experiments, the breakthrough curves adjusted by CXTFIT and simulated curves with Hydrus-1D are shown in Figure 2 for all three types of soil. The obtained curves are regular and symmetrical. They therefore exhibit typical solute transport properties in soils without an immobile phase that could affect the migration of the solutes (Goncalves et al., 2001).
The three breakthrough curves present the same behavior. The peak of concentration (C/C0) appears to 0.5 for clay soil, 0.8 for sandy soil and 0.98 for the silty soil. Within three breakthrough curves, there is coherence between the ascent and descent with different times. Nevertheless, there is a slight difference of the rise in the clay soil which can be explained by the soil enrichment by small particles that retain the solutes and slows down their movement.
The estimation procedure with CXTFIT was used to estimate the values of the transport parameters of the advection-dispersion model. The results of these calculations are presented in Table 3.
A good agreement was found between the measured values and those which are adjusted by CXTFIT. The values of the correlation coefficient vary between 0.83 and 0.89. GMER values are less than 1 which means that the used laboratory method has a tendency to underestimate the breakthrough curve compared to direct simulation by Hydrus-1D (Table 4). The calculated values of the Mann-Whitney test of the three soils: sand, silt and clay, respectively, 0.465, 0.517 and 0.758 are above 0.05. Therefore, there is no significant difference between the estimation of solute transport parameters and numerical simulation.
The obtained results are confirmed in the literature. In fact, according to studies conducted in the laboratory to estimate dispersivity, Wierenga and Van Genuchten (1989) and Costa and Prunty (2006), suggested in unsaturated soils, it depends on the traveled distance. Bycons, Khan and Jury (1990) and Kasteel et al. (2009), found no clear relationship between the dispersivity and the measurement range. Referring to this work, the dispersivity values found at sandy loam soil in unsaturated conditions vary between 1 and 5 cm. These results are also confirmed by Vanderborght and Vereecken (2007) in their literature review that encompassed most dispersivities values according to soil texture and scale experiments
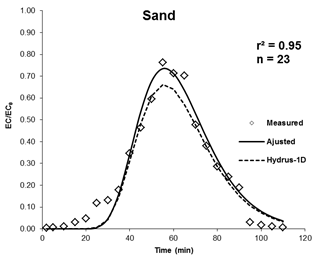
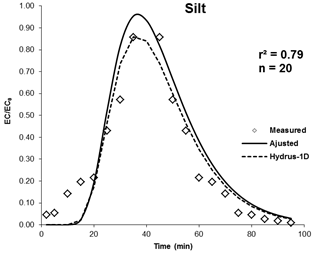
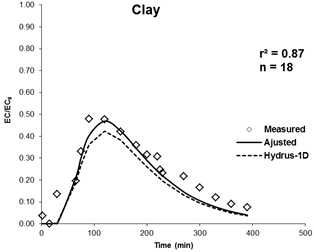
Figure 2. Measured breakthrough curves by the displacement experiments, the breakthrough curves adjusted by CXTFIT and simulated curves with Hydrus-1D.
Table 3. Estimated solute transport parameters for the three soils.
| Soil | n (cm.min-1) | D (cm².min-1) | R² | q (cm3.cm-3) | Jw (cm.min-1) | l (cm) |
| Sand | 17.00 | 10.96 | 0.82 | 0.12 | 2.04 | 2.64 |
| Silt | 16.16 | 07.18 | 0.89 | 0.25 | 4.04 | 0.44 |
| Clay | 23.3 | 53.98 | 0.87 | 0.35 | 8.16 | 0.81 |
Table 4. RMSE and GMER values of the three soils.
| Soil | RMSE | GMER |
| Sand | 0.023 | 0.90 |
| Silt | 0.024 | 0.89 |
| Clay | 0.027 | 0.79 |
4.2. Relationship Between Dispersivity and Water Content
Several authors have attempted to find theoretical models to calculate the relationship between l and q for unsaturated soils in the laboratory (Yasuda, 1996; Padilla et al., 1999; Young et al., 2000; Nützmann et al., 2002; Toride et al., 2003; Costa and Prunty, 2006).
In our case and according to similar experiments under different water content state, the relation is (Figure 3):
![]() ; R² = 0.9 (9)
; R² = 0.9 (9)
The dispersivity decreases as the water content increases. Indeed, the measured moisture content is very close to the saturation conditions (Figure 3). Similar relationships were found by Smet and Wierenga (1984), Maraqa et al. (1997) and Padilla et al. (1999). However, it should be noted that the dispersivity can be totally independent of the water content as it was suggested by Yule and Gardner (1978) and Costa and Prunty (2006).
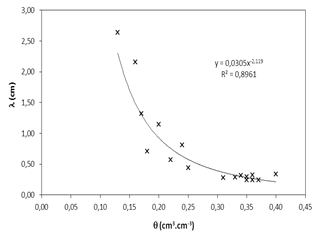
Figure 3. Relationship between dispersivity and water content.
5. Conclusion
Solute displacement experiments were carried out on three types of soils by applying a 0.8 M of KCl pulse. The breakthrough curves were symmetric characteristic for equilibrium transport in unsaturated soils. It allowed the estimation of solute transport parameters the relationship between dispersivity and water content. These data are essential for a possible modeling of water and solute dynamics in field conditions.
References
- álvarez-benedí J. et munoz-carpena R., 2005. Soil-Water solute process characterization: An Integrated Approach. CRC PRESS edition, 816 pp.
- Bégin L., Fortin J. et Caron J., 2003. Evaluation of the Fluoride Retardation Factor in Unsaturated and Undisturbed Soil Columns. Soil Science Society of America Journal, 67:1635–1646.
- Brooks R. J., and Corey A.T., 1964. Hydraulic properties of porous media, Hydrology Papers. 3, Colo. State Univ., Fort Collins, 37pp.
- Costa J. L et Prunty L., 2006. Solute transport in fine sandy loam soil under different flow rates. Agricultural Water Management, 83:111-118.
- DeSmet F. et Wierenga P.J., 1984. Solute transfer through columns pf glass beads. Water Resources Research, 20: 225–232.
- Field M., 2002. The QTRACER2 program for tracer-breakthrough curve analysis for tracer tests in karstic aquifers and other hydrologic systems. EPA/600/R-02/001
- Fonseca B., Teixeira A., Figueirdo H. et Tavares T., 2009. Modelling of the Cr(VI) transport in typical soils of the north of Portugal. Journal of Hazardous Materials, 167:756-762.
- Gonçalves M. C., Leij F.J. et Schaap M.G., 2001. Pedotransfer fucntions for solute transport parameters of Portuguese soils. European Journal of Soil Sciences, 12:563-574.
- Käss W., 1998. Tracing Technique in Geohydrology, A. A. Balkema, Rotterdam, Brookfield, Vt., 581 pp.
- Kasteel R., Putz T., Vanderbroght J. et Vereecken H., 2009. Solute spreading under transient conditions in a field soil. Vadose Zone Journal, 8:690-702.
- Khan A. U.-H. et Jury W.A., 1990. A laboratory study of the dispersion scale effect in column outflow experiments. Journal of Contaminant Hydrology, 5: 119-131.
- Leij F. J., Toride N. et van Genuchten M.Th., 1993. Analytical solutions for non-equilibrium solute transport in three-dimensional porous media. Journal of Hydrology, 151:193-228.
- Li L., Barry D. A., Morris J. et Stagnitti F., 1999. CXTANNEL: an improved program for estimating solute transport parameters. Environmental Modelling & Software, 14:607-611.
- Mallants D., Vanclooster M., Meddahi M. et Feyen J., 1994. Estimating solute transport in undisturbed soil columns using time-domain reflectometry. Journal of Contaminant Hydrology, 17:91-109.
- Maraqa M. A., Wallace R.B. et Voice T.C., 1997. Effects of degree of water saturation on dispersivity and immobile water in sandy soil columns. Journal of Contaminant Hydrology, 25: 199–218.
- Millington R. J., and Quirk. J.M., 1961. Permeability of porous solids. Transactions of the Faraday Society, 57: 1200-1207.
- Nützmann, G., Maciejewski S. et Joswig K., 2002. Estimation on water saturation dependence of dispersion in unsaturated porous media : experiments and modelling analysis. Advances in Water Resources, 25: 565-576.
- Padilla I. Y., Yeh T.C.J. et Conklin M.H., 1999. The effect of water content on solute transport in unsaturated porous media. Water Resources Research, 35(11): 3303-3313.
- Parker J. C. et van Genuchten M.Th., 1984. Flux-Averaged and Volume Averaged concentrations in continuum approaches to solute transport. Water Resources Research, 7:866-872.
- Radcliffe D.E. et Šimůnek J., 2010. Soil Physics with Hydrus – Modelling and Applications. CRC Press, 373pp.
- Richards L.A., 1931. Capillary conduction of liquids through porous mediums. Physics, 1: 518-533.
- Roger B. et Herbert Jr., 2011. Implications of non-equilibrium transport in heterogeneous reactive barrier systems: Evidence from laboratory denitrification experiments. Journal of Contaminant Hydrology, 123:30-39.
- Sauty J. P., Kinzelbach W. et Voss A., 1992. Computer Aided Tracer Test Interpretation (CATTI), program documentation, International Ground Water Modeling Center, Golden, Colorado, 64 pp.
- Šimůnek, J., van Genuchten M.Th., Sejna M., Toride N., et Leij F.J., 1999. The STANMOD computer software for evaluating solute transport in porous media using analytical solutions of convection-dispersion equation. Versions 1.0 and 2.0, IGWMC - TPS - 71, International Ground Water Modeling Center, Colorado School of Mines, Golden, Colorado, 32pp.
- Šimůnek J., Huang K., Sejna M. et van Genuchten M.T., 2005. The HYDRUS-1D software package for simulating the one-dimensional movement of water. heat. and multiple solutes in variably - saturated media. Internaional ground water modelling center Colorado School of Mines. Golden. Colorado, 162 pp.
- Tang G., Mayes M.A., Parker J.C. et Jardine P.M., 2010. CXTFIT/Excel-A modular adaptable code for parameter estimation, sensitivity analysis and uncertainty analysis for laboratory or field tracer experiments. Computers & Geosciences, 36:38-47.
- Toride N., Leij F. J. et van Genuchten M.Th., 1999. The CXTFIT code for estimating transport parameters from laboratory or field tracer experiment. Research Report N°137, US Salinity Laboratory, Riverside, California, 119pp.
- Toride N., Inoue M. et Leij F.J., 2003. Hydrodynamic dispersion in an unsaturated dune sand. Soil Science Society of America Journal, 67:703-712.
- Vanclooster M., Mallants D., Diels J. et Feyen J, 1993.Determining local-solute transport parameters using time domain reflectometry (TDR). Journal of Hydrology, 148:93-107.
- Vanderborght J. et Vereecken H., 2007. Review of dispersivities for transport in soils. Vadose Zone Journal, 6:29-52.
- Van Genuchten M.T., 1980. A closed-form equation for predicting the hydraulic conductivity of unsaturated soils. Soil Science Society of America Journal, 44: 892-898.
- Van Genuchten M.Th. et Parker J.C., 1984. Boundary conditions for displacements experiments through short laboratory soil column. Soil Science Society of America Journal, 48:703-708.
- Wierenga P.J., 1995. Water and solute transport and storage. In: L.G. Wilson, L.G. Everett et S.J. Cullen (Editors), Handbook of Vadose Zone Characterisation and Monitoring. Lewis Publishers, London, 41-59.
- Wierenga P. J. et Van Genuchten M. Th., 1989. Solute transport through small and large unsaturated soil columns". Ground Water, 27(1): 35-42.
- Yasuda H., 1996. Soil heterogeneity effects on water and solute transport. Department of Water Resources Engineering. Lund Istitute of Technology, Lund University, Sweden, Report N°1016. 37 pp.
- Young D. F. et Ball W.P., 2000. Column experimental design requirements for estimating model parameters from temporal under nonequilibrium conditions. Advances in Water Resources, 23:449-460
- Yule, D. F. et Gardner, W.R., 1978. Longitudinal and transverse dispersion coefficient in unsaturated plain field sand. Water Resources Research, 14: 582–588.


