
American Journal of Geophysics, Geochemistry and Geosystems, Vol. 1, No. 3, August 2015 Publish Date: Jul. 21, 2015 Pages: 92-99
Hydrogeology Investigation and Water Level Fluctuation in Hard Rock of the Man River Basin, Akola and Buldhana Districts, Maharashtra, India
Khadri S. F. R.*, Kanak Moharir
Department of Geology, Sant Gadge Baba Amravati University, Amravati, India
Abstract
Ground water level fluctuation space to space (Spatial) and time to time (Temporal) is a major problem in India and the assessment of spatiotemporal characteristics water level fluctuation trend is very important in the point of view of future development. An RS technique can properly enhance hydrogeological surveys. Moreover, to have an intimate understanding of the changes in water level fluctuations, it is also important to relate them to the surrounding geomorphic, structural, climatic and geologic factors. This research serves two fold. The first one is to operationalize the use of RS and Geographic Information Systems (GIS) techniques to assess the change of water surface area in Man River Basin in Akola and Buldhana Districts. The second is to present and interpret the available statistical data on water level fluctuations. The area receives major part of the rainfall (about 45%) during South-West-monsoon period there are eleven rain gauge stations in the area which have rainfall recorded for more than 50 years. The normal rainfall for study area is 800 – 1200 mm. (source IMD). The seasonal fluctuation shows a rise in water level, which ranges from 3.5 to 16 m bgl. The water level is deeper in topographically elevated regions and shallower in plain surface terrain.
Keywords
Hydrogeology, GIS, Interpolation, Groundwater Level Fluctuations
Received: June 25, 2015
Accepted: July 3, 2015
Published online: July 20, 2015
@ 2015 The Authors. Published by American Institute of Science. This Open Access article is under the CC BY-NC license. http://creativecommons.org/licenses/by-nc/4.0/
1. Introduction
Rapid industrial development, urbanization and increase in agricultural production have led to freshwater shortages in many parts of the world. To proper supply of water for various purposes like agricultural, domestic and industrial, a greater emphasis is being laid for a planned and optimal utilization of water resources. The water requirement for agriculture, municipal and industries is larger than the annual recharge. This may lead to depletion of ground water. On other hand, continuous withdrawals from groundwater reservoir in excess of replenish able recharge may result in lowering of water table. Surface hydrological indications are one of the promising scientific tools for assessment and management of water resources. Drainage morphometric analyses are a prerequisite for selection of water recharge site, watershed modeling, runoff modeling, watershed delineation, groundwater prospect mapping and geotechnical investigation. (Magesh et al., 2011; Thomas et al., 2012; Khadri Chaitanya Pande SFR, Moharir K (2013);Khadri, S. F. R. and Kanak N. Moharir (2014) In this study area of the data gathered from GPS surveys and from environmental remote sensing systems can be fused within a GIS for a successful characterization and assessment of watershed functions and conditions.
The hydrogeological investigations are important facets of any groundwater management strategy. The groundwater potential of an area depends on the geological and geomorphologic setup, rainfall pattern, aquifer type, groundwater flow pattern, boundary conditions, aquifer properties, etc. (Selvam et. al. 2012, Rangarajan 2009). Hydrogeological investigations indicate the status of groundwater availability in the watershed based on which management strategies can be evolved for effective and efficient use of water resources. Thus, the top layer of the ground in the Man River Basin forms a potential zone for groundwater storage. The people dwelling in the Man River Basin depend heavily on this groundwater for their domestic and agricultural requirements. Thus, scientific understanding about the occurrence, distribution, movement and sustainability of this dynamic natural resource becomes important.
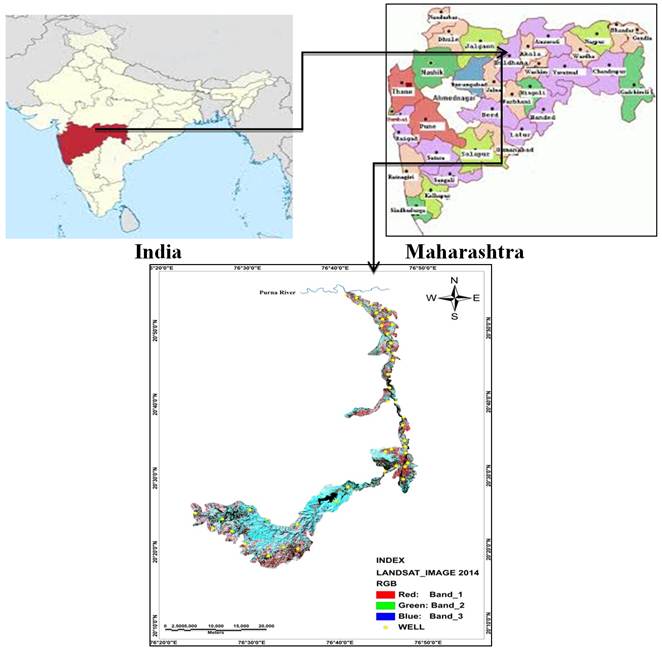
Fig. 1. Location map of Man River basin.
2. Study Area
The present study area of Man River basin is situated in Akola Buldhana district of Maharashtra between 20°54′59" N latitude and 76° 41’23’’ E longitude covered by survey of India Toposheets no. 55 D/7, 55 D/9, 55 D/11, 55 D/13, 55 D/14 and 55 D/15 on 1:50,000 scale. The total area covered by Man River Basins 447.80 Sq. Kms. Despite widespread acceptance of the impact hypothesis, the lack of a high-resolution eruption timeline for the Deccan basalts has prevented full assessment of their relationship to the mass extinction. However, recent research carried out by Blair Schoene et al., (2015) through Uranium-Lead (U-Pb) Zircon geochronology to Deccan rocks has showed that the main phase of Deccan eruptions initiated ~250,000 years before the Cretaceous-Paleogene boundary and that >1.1 million cubic kilometres of basalt erupted in ~750,000 years and their results are consistent with the hypothesis that the Deccan Traps contributed to the latest Cretaceous environmental change and biologic turnover that culminated in the marine and terrestrial mass extinctions.
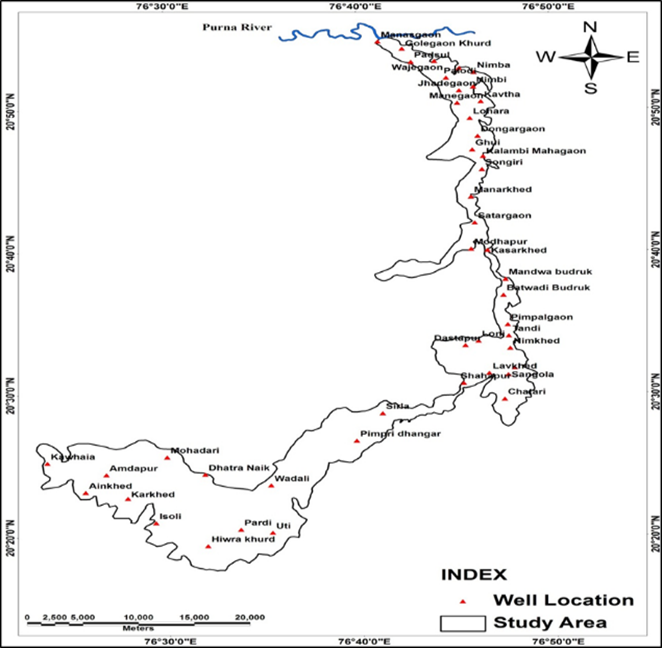
Fig. 2. Well Location map of study area.
3. Materials and Methods
In the study area of 45 observation wells were established to monitor variation in groundwater levels in the Man River Basin. The GARMIN GPS was used to locate the exact coordinates of the sample collection to continuous monitoring purposes. Groundwater samples were collected from 25 dug well and 20 bore well mostly used for domestic and agricultural purposes during pre and post-monsoon in the year of 2013. Dug wells are prevalent in the terrain of the Man River Basin. The groundwater levels were measured on seasonal basis from 2013 Pre and Post were monitored for groundwater fluctuation for seasons of the year 2013. Details regarding the well location, dimensions, depth to static water level, etc. were collected and tabulated for each well. The locations of the observation wells were then transferred on to the base map in a GIS environment. The locations of the wells are shown in Fig. 2. The data regarding well locations and dimensions has been given in Table 1.
Then the groundwater ancillary data and the spatial data (co-ordinates) which were collected with the help of GPS were joined in the Arc GIS 10.00 software. After linking the spatial and non-spatial data the groundwater quality point layer was generated for further analysis. Later on the other analysis was carried out using the IDW (Inverse Distance Weighted) in Geographic information system environment using the Arc GIS 10.00 software. Interpolation creates a continuous (or prediction) surface from sampled point values. it makes predictions from sample measurements for all locations in a raster dataset whether or not a measurement has been taken at the location. In the present data analysis we used IDW (Inverse distance weighted) interpolation technique.
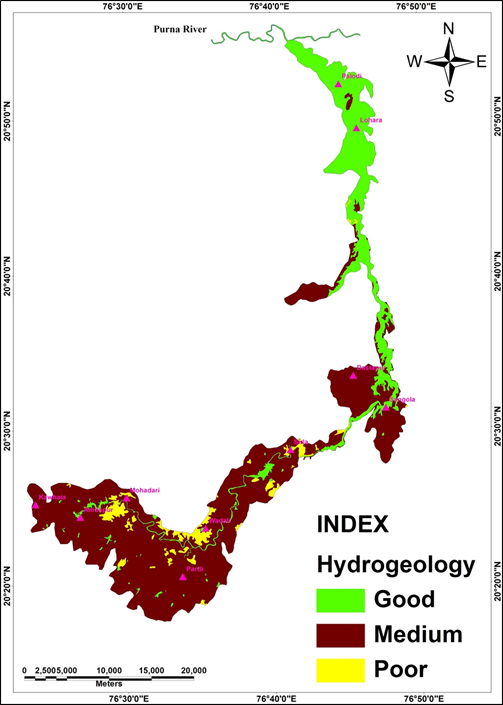
Fig. 3. Map showing favourable water bearing zones of the Man River Basin
4. Results and Discussion
4.1. Hydrogeology
The hydrogeology of the Man River Basin is studied on the basis of pre and post monsoon field survey conducted for the year 2013 during first week of June and last week of December, near about 45 wells for each season (Fig.2; Table 1) were analysed to check the water level fluctuations and water bearing formations of the area. Deccan Basalt is the sole water bearing formation of the area followed by alluvium. Almost all wells were tapped in basaltic rock and fewer were in alluvial deposits. However in most of the region the wells in alluvium encountered the basaltic rock at the deeper level of the earth. The mode of groundwater has been studied by well inventory of the existing wells (Fig.3).
4.2. Occurrence of Groundwater
The important aquifers in the study area are basalt and alluvium. In the shallow aquifers groundwater occurs under water table conditions. Basalt, when weathered and fractured contain considerable amount of groundwater. Vesicular basalt is highly productive, but it never taps the full.
Section of well alone. Alluvium by far is the most productive horizon of the area. In the study area, inventories of 45 wells have carried out. The depth and diameter in basalt ranges from 4.50 to 17.9m.bgl; and 1.70to 6.10 m. bgl. respectively.
4.3. Depth of Water Level
During the pre, post-monsoon period (June and December 2013) Forty five observation wells was established, their location and water levels were monitored during post-monsoon period (December 2013) (Table1). The depth of water table ranges from 3.5 to 16 m. bgl. For pre monsoon period for June 2013 and 1.2 to 13 bgl for post monsoon period for December 2013. Groundwater level data has been collected from 45 observation wells in the study area. It is a well-established fact that the occurrence and movement of groundwater depends upon geology, landforms and the structure. If these factors are favourable then the aquifer condition holds good for good groundwater potentiality. A good aquifer is one which has been recharged during the period of monsoon when rain water gets infiltrated and recharged. This means that during the pre-monsoon period the aquifer used to have a deep water table condition compared to post monsoon period. The difference in water table can be calculated once the water table of both seasons recorded. Wells are found to be fairly distributed throughout the study area. From the water level data, existing 45 wells are considered for both pre and post monsoon seasons
Table 1. (Pre-Post) Water Level for Year 2013.
| WELL NO. | Village Name | Pre-Jun 2013 | Post-Dec. 2013 | Fluctuation |
| 1 | Hingaonnimba | 10.8 | 7.5 | 3.3 |
| 2 | Wajegaon | 12.12 | 9.8 | 2.32 |
| 3 | Nimba | 6.7 | 3.2 | 3.5 |
| 4 | Kavtha | 11.4 | 6.7 | 4.7 |
| 5 | Lohara | 6.7 | 5.4 | 1.3 |
| 6 | Dongargaon | 3.5 | 1.2 | 2.3 |
| 7 | Songiri | 10.6 | 6.9 | 3.7 |
| 8 | KalambiMahagaon | 8.9 | 7.7 | 1.2 |
| 9 | Manarkhed | 6.9 | 5.4 | 1.5 |
| 10 | Kasarkhed | 12 | 10.4 | 1.6 |
| 11 | Mandwabudruk | 16 | 12.8 | 3.2 |
| 12 | BatwadiBudruk | 15.15 | 10.3 | 4.85 |
| 13 | Sangola | 6.6 | 4.8 | 1.8 |
| 14 | Chatari | 8.18 | 6.5 | 1.68 |
| 15 | Pimpridhangar | 13.63 | 9.8 | 3.83 |
| 16 | Uti | 7.2 | 5.5 | 1.7 |
| 17 | Pardi | 10.5 | 8.4 | 2.1 |
| 18 | Hiwrakhurd | 10.2 | 7.6 | 2.6 |
| 19 | Isoli | 8.71 | 5.6 | 3.11 |
| 20 | Karkhed | 6.17 | 4.3 | 1.87 |
| 21 | Ainkhed | 7.3 | 3.2 | 4.1 |
| 22 | Amdapur | 8.9 | 6.4 | 2.5 |
| 23 | Kawhaia | 7.6 | 4.3 | 3.3 |
| 24 | Mohadari | 7 | 5.1 | 1.9 |
| 25 | DhatraNaik | 8.7 | 4.1 | 4.6 |
| 26 | Wadali | 8.6 | 5.3 | 3.3 |
| 27 | Sirla | 7.1 | 5.2 | 1.9 |
| 28 | Shahapur | 5.2 | 3.1 | 2.1 |
| 29 | Dastapur | 8.62 | 6.2 | 2.42 |
| 30 | Loni | 12.15 | 10.2 | 1.95 |
| 31 | Lavkhed | 6.4 | 4.1 | 2.3 |
| 32 | TulangaKhurd | 6.1 | 2.1 | 4 |
| 33 | Tandi | 8.6 | 6.4 | 2.2 |
| 34 | Pimpalgaon | 15 | 10.3 | 4.7 |
| 35 | Modhapur | 9.5 | 4.5 | 5 |
| 36 | Satargaon | 5.8 | 3.2 | 2.6 |
| 37 | Ghui | 15 | 11 | 4 |
| 38 | Manegaon | 9.1 | 6.5 | 2.6 |
| 39 | Jhadegaon | 9.1 | 7.6 | 1.5 |
| 40 | Palodi | 9.4 | 8.5 | 0.9 |
| 41 | Padsul | 12.4 | 9.9 | 2.5 |
| 42 | GolegaonKhurd | 10.3 | 8.7 | 1.6 |
| 43 | Manasgaon | 9.75 | 8.9 | 0.85 |
| 44 | Nimbi | 4.9 | 1.2 | 3.7 |
| 45 | Nimkhed | 9.6 | 6.5 | 3.1 |
4.4. Groundwater Level Fluctuations
Ground water level fluctuation is mainly depends on the difference in water level of pre-monsoon and post-monsoon periods, which can be directly related to recharge and discharge of groundwater. The pre and post monsoon water level fluctuation were calculated on the basis of 45 wells in the area. The result indicates four distinct zones viz low water level. There are various methods in use for the quantitative evaluation of groundwater recharge e.g i.
Groundwater level fluctuation and specific yield method ii. Soil moisture balance, method iii. Rainfall infiltration method. Measurement of groundwater recharge requires proper understanding of the recharge and discharge prices and interrelationship with geological, geomorphologic, soil and land use. In the present study the groundwater level fluctuation and specific yield method is used for the quantitative estimate of groundwater recharge zone in the Man River Basin In the case of conventional methods like rainfall infiltration method or water level fluctuation method average values of rainfall or water level fluctuation is taken for a part of the land.
Water table fluctuations map is prepared using the difference in level of pre and post monsoon water level data. Water level fluctuation map is prepared using spatial analysis of Arc GIS software (Fig.6). Physical, chemical and biological features in reservoirs are influenced by seasonal surface-level fluctuations, which are significantly associated with anthropogenic utilization. From the above map I could find the cone of depression or abstraction is more in south central part of the study area due to abstraction in Man river basin channel. As a result ground water flow is towards the north direction. Generally water table has a configuration similar to that of land surface; however, depths to water levels are deeper in upland
recharge area rather than in the area adjacent to the river valley and discharge areas. The spatial variability in the components of recharge is considered. In case of Remote sensing and GIS based method spatial distribution of the variable are taken into accounts, thus preparing an information is required for estimation on recharge.

Fig. 4. Water Levels for Year June 2013(Pre-monsoon).
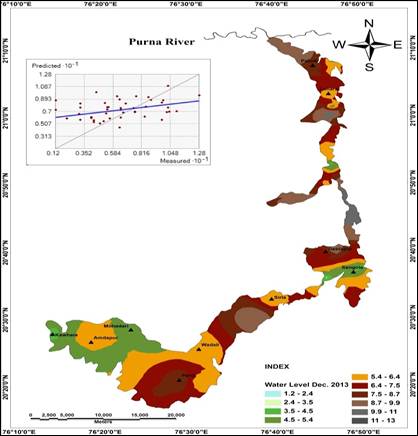
Fig. 5. Water Levels for Year December 2013(Post-monsoon).
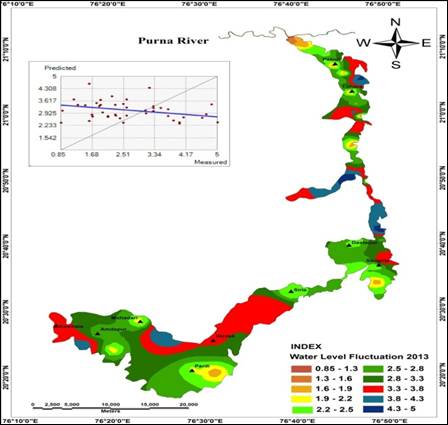
Fig. 6. Water Levels Fluctuation Map 2013 (pre-post monsoon).
5. Conclusion
Groundwater is most important precious resource of ecological system. Recently there has been overall development in various fields such as agriculture, industry and urbanization in India. This has lead to increase in the dement of water supply which is met mostly from exploitation of groundwater creating a water stress condition. Groundwater identification program needs a large volume of data from various sources. As demonstrated successfully in this study that integrated remote sensing and GIS can provide the appropriate platform for convergent analysis of large volume of multidisciplinary data and decision making for groundwater studies. IRS-1C satellite imageries provide information related to geology, geomorphology, and land use will be helpful in knowing the nature and water potentiality of different geomorphic unit. The following conclusion are drawn from the above study, i. In the present study area an integrated remote sensing and GIS based methodology has been developed and demonstrated for evaluation of groundwater resources. ii. Recently the areas nearer to the place are newly created settlements area and small scale industries. From the current study it has been found that Inverse distance weighted interpolation technique is the best way of determining the water level fluctuation, As in this technique the chances of error are minimized to a great extent and chances of deviation of original value are extremely low. A procedure that integrates the traditional groundwater sampling analysis methods and GIS capabilities combined with conditional overlaying techniques was adapted in order to locate the suitable areas at the Man River groundwater for drinking purposes. The seasonal fluctuations of ground water level between the pre and post monsoon period for the years of 2013 is 0.85 to 5m.bgl. Most of the study area is characterized by moderate to moderately high water level fluctuation. The low water level fluctuation is more prominent in the region which is controlled by recharge of groundwater by surface irrigation. Whereas high level extraction of groundwater during non-monsoon period for irrigation purpose causes fluctuation. The high water level fluctuations are observed in Kawath, Pimpalgaon, of the basin while the medium water level fluctuations are observed in maximum part of the basin. The low water level fluctuations are observed in the Manegaon village of the basin for the year 2013. The water level fluctuation of the study area compounds is considered for components of recharge. v. Owing to its synoptic coverage, high resolution, temporal data availability, satellite remote sensing techniques followed by GIS analysis and image processing techniques give desirable results for making opposite plans for resources assessment in general and groundwater targeting.
References
- Blair Schoene, Kyle M. Samperton, Michael P. Eddy, Gerta Keller, Thierry Adatte, Samuel Bowring, Syed F.R. Khadri and Brian Gertsch, 2015, U-Pb geochronology of the Deccan Traps and relation to the end-Cretaceous mass extinction, Science, Five year Impact Factor: 34.40, ISSN No:0036-8075, American Association for the advancement of Science (USA), Vol. 347 no. 6218 pp. 182-184, along with 33 pages additional supplementary material published by Science,DOI:10.1126/science.aaa0118.
- Jha, A. P., Krompinger, J., &Baime, M. J. (2007). Mindfulness traininmodifies subsystems of attention. Cognitive, Affective, & Behavioral Neuroscience, 7, 109 –119.
- Khadri Chaitanya Pande SFR, Moharir K (2013) Groundwater quality mapping of PTU-1 watershed in Akola district of Maharashtra India using geographic information system techniques. Int J SciEng Res, Vol 4, No 9, September
- Khadri, S. F. R. and Kanak N. Moharir (2014) Groundwater quality monitoring for PTR-1 watershed inAkola district, Maharashtra, India using geographicInformation system and remote sensing techniques. IJPRET, 2014; Volume 2 (9): 156-
- Khadri, S. F. R. and Kanak N. Moharir (2014) spatial analysis of groundwater quality for Man river basin in Akola and Buldhana District of Maharashtra using GIS. Golden Research Thoughts Volume-3 Issue-12 June-2014
- Khadri, S. F. R. and Kanak N. Moharir (2015) Irrigation mapping of Man River Basin of Akola and Buldhana District, (MH) using Spatial Interpolation techniques. International Journal on Recent and Innovation Trends in Computing and Communication Volume: 3 Issue: 2.
- N.S. Magesh, N. Chandrasekar, J.P. Soundranayagam (2011) Morphometric evaluation of Papanasam and Manimuthar watersheds, parts of Western Ghats, Environmental Earth Science, 64 (2011), pp. 373–381Tirunelveli district, Tamil Nadu India: a GIS approach.
- Selvam, S. Sivasubramanian, P.(2012) Groundwater potential zone identification using geoelectrical survey: A case study from Medak district, Andhra Pradesh, India, International Journal of Geomatics and Geosciences, 3, 55-62
- Singh et al., 2013; Singh S, et al. (2013) Aldehyde dehydrogenases in cellular responses to oxidative/electrophilic stress. Free RadicBiol Med 56:89-101
- Rangarajan, R. Mondal, N,C, Singh, V.S. Singh, S.V.(2009) Estimation of natural recharge and its relation with aquifer parameters in and around Tuticorin town, Tamil Nadu. India, Curr Sci, 97, 217–226.
- Thomas et al., 2012A Global Pattern of Thermal Adaptation in Marine Phytoplankton Published Online October 25 2012 Science 23 November 2012: Vol. 338 no. 6110 pp.


