
American Journal of Geophysics, Geochemistry and Geosystems, Vol. 1, No. 3, August 2015 Publish Date: Jul. 16, 2015 Pages: 77-86
Pore Pressure Prediction Using Offset Well Logs: Insight from Onshore Niger Delta, Nigeria
G. Z. Ugwu*
Department of Industrial Physics, Enugu State University of Science and Technology, Enugu, Nigeria
Abstract
Pore pressure predictions for an onshore Niger Delta area were made using offset well logs. Mild – to – moderate overpressure regime was estimated in the area. Onset of mild overpressure (<0.6 psi/ft) in the area is at about 6600 – 11500ftss. The pressure increases with depth to become moderately overpressured (< 0.8 psi/ft) throughout the depth extent of about 12200 – 15700ftss.
Keywords
Pore Pressure Predictions, Well Logs, Overpressure, Niger Delta
Received:June 19, 2015
Accepted: June 29, 2015
Published online: July 15, 2015
@ 2015 The Authors. Published by American Institute of Science. This Open Access article is under the CC BY-NC license. http://creativecommons.org/licenses/by-nc/4.0/
1. Introduction
In an overpressured region such as the Niger Delta, knowledge of the formation pore pressure regime is critical for safe and economic drilling operations. Costly problems associated with drilling through overpressured zone include wellbore stability problems, well kicks and blowouts, lost circulations, etc. Understanding the pore pressure regime of the area will help to ensure a better volume and risk assessment of the trap integrity. The well design and field development plan can also be better constrained. The Niger Delta formation has been reported by several authors to be overpressured (Nwozor et al, 2013; Opara et al, 2013). Several well incidents such as blowouts, lost wells and mud losses have also been reported (personal communications) in some parts of the onshore Niger Delta where some wells have penetrated deep overpressured zones.
Since the classic paper of Hottman and Johnson (1965), the literature has been populated with works on pore pressure predictions. In most cases where pore pressure predictions are required, data from offset wells are used to construct the normal compaction trend (NCT) in a well-based pore pressure prediction. In this paper, wireline measurements of pore pressure indicators such as porosity, density, sonic velocity and resistivity obtained from the offset wells are used to estimate the pore pressure regime of an onshore area of the Niger Delta. The pressure predictions obtained will be useful in drilling operations at any other nearby location with the same geology.
2. Geologic Setting
The Niger Delta is a major geological feature of significant petroleum exploration and production in Nigeria, ranking amongst the world’s most prolific petroleum producing Tertiary deltas. The onshore Niger Delta is situated on the continental margin of the Gulf of Guinea on the West Coast of Africa and lies between latitude 40 and 60N and longitude 403l and 80E. The geology of the Niger Delta has been extensively studied by several authors and is now well documented (Reyment, 1965; Short and Stauble, 1967; Murat, 1972; Doust and Omatsola, 1990). The Niger Delta is bounded in the north by the Benin flank; an east-northeast trending hinge line south of the West African basement massif. The northeastern boundary is defined by the outcrops of the Cretaceous Abakaliki anticlines, extending further to the southeast as the Afikpo syncline and Calabar flank. The Niger Delta basin consists of three main lithostatic formations namely, the topmost Benin Formation which consists of massive continental fluviatile gravels and sands; the Agbada Formation which represents a deltaic facies and the Akata Formation which consists mainly of marine shales. The Akata shale which is significantly overpressured is believed to be the main source rock of the hydrocarbons, usually trapped in faulted rollover anticlines associated with growth faults. In the last 55 Ma, the Niger Delta which is predominantly composed of regressive clastic sequence has prograded southwards, forming some depobelts (Figure 1)
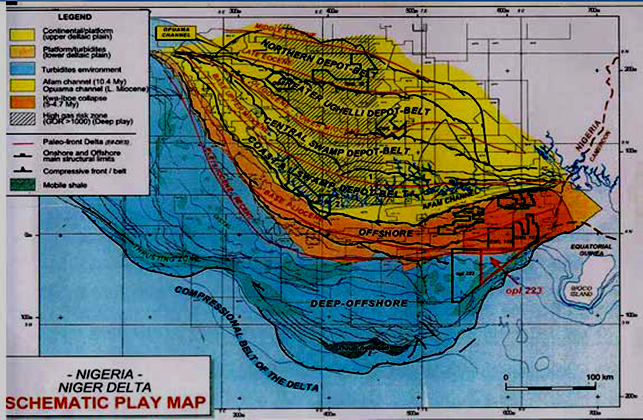
Figure 1. Sectional map of Niger Delta showing the depobelts (Nwozor et al, 2013).
3. Materials and Methods
All the pore pressure prediction methods are based on the premise that pore pressure influences compaction dependent shale properties such as porosity, density, sonic velocity and resistivity. Of all the various possible methods, the effective stress method has remained the most preferred standard in use. Hence most pore pressure predictions are based on Terzaghi (1943) which expresses the relationship between the overburden stress S, pore pressure P and the effective stress, s. Terzaghi’s relation extended to solid rocks can be written as:
P = S - s (1)
The overburden stress is the pressure due to the combined weight of the rock matrix and the fluids in the pore space overlying the formation of interest at a given depth. The overburden stress S can be expressed as integral of density:
![]() (2)
(2)
Where g is the acceleration due to gravity and r(z) is the bulk density which can be obtained from the density log, if available.
The overburden stress at any depth is determined from the lithostatic gradient and the effective stress can be obtained from the response to changes in the shale porosity. In a normally compacted shale, the effective stress increases as the porosity decreases. Thus by defining a normal compaction trend (NCT) within the shale, one can compare between the porosity expected if the thick shale sequence is normally pressured and compacted, and the measured porosity from the well at the depth of interest.
Pore pressure predictions using offset well data begins with the construction of the NCT. The assumption is that in the shallow section, the sediments are normally pressured. Therefore the data from the shallow section can be used to create the NCT and extrapolated to depth using geologically reasonable values. A departure from the normal compaction curve, having porosities higher than indicated by NCT at the same depth is the beginning of overpressure.
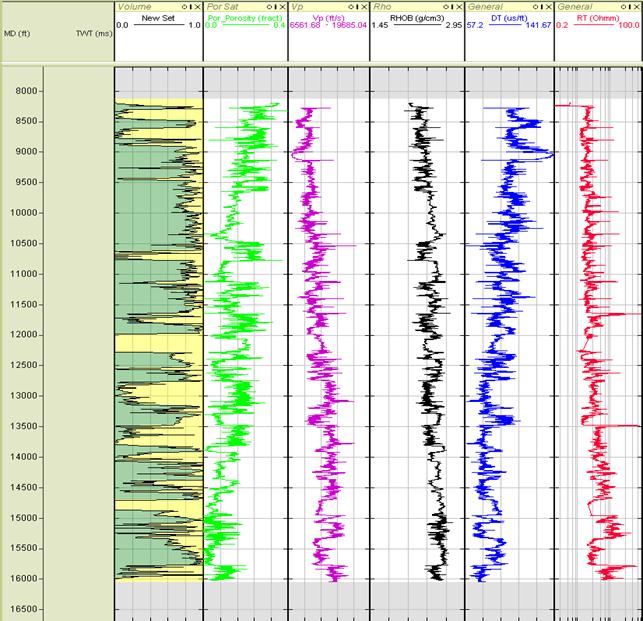
Figure 2. Key wireline logs and volume set of Well C.
4. Pore Pressure Prediction Models
Different models (algorithms) exist for pore pressure prediction. In all the methods, the general approach is based on the comparison of the measured pore pressure indicators in the abnormal pressure zone with those observed in the normal pressure zone. However, in this work, the Eaton’s model, Bowers’ model and the Tau model were employed.
4.1. Eaton’s Model
The Eaton’s model (Eaton, 1975) is one of the most commonly used approaches for relating shale porosity to pore pressure, especially in the industry (Yoshida et al, 1996). The Eaton’s model in accordance with Terzaghi (1943) gives a direct transform of sonic interval times into pore pressure, Pp:
![]() (3)
(3)
Where rob is the overburden pressure, rhd is the hydrostatic pressure, DTnormis the sonic interval transit or slowness at depth on the normal compaction trend and DT is the observed sonic interval transit time at the depth of interest. The default value of the exponent n in equation 3 is 3 but may be varied to calibrate to local data
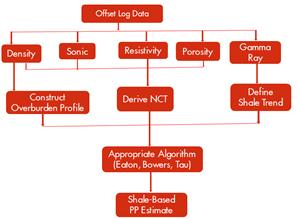
Figure 3. Offset well-based pore pressure prediction workflow.
4.2. Bowers’ Model
Bowers’ (1995) proposed that the compressional velocity Vp and the effective stress s have a power relation in the loading stage of the form:
Vp= Vml+A sB or
![]() (4)
(4)
Where Vml is the compressional velocity at the mudline (about 5000 ft/s). The parameters A and B are calibrated with offset velocity versus vertical effective stress data.
Equation 4 is then substituted in equation 1 (Terzaghi, 1943) to obtain the pore pressure:
P=S - ![]() (5)
(5)
5. Tau Model
The Tau variable was introduced into the effective stress equation in a transit time dependent pore pressure prediction method (Lopez et al, 2004; Zhang and Wieseneck, 2011). This is an empirical relationship linking velocity to vertical effective stress:
s=A![]() (6)
(6)
Where A and B are fitting constants derived from local data and the Tau variable, ![]() is the scaled sonic which can be defined as:
is the scaled sonic which can be defined as:
![]()
Where Dt is the transit time from either sonic log or seismic velocity, C and D are constants related to the mudline and matrix transit time respectively.
The pore pressure calculation of Terzaghi (1943), using the Tau model then becomes
![]() (7)
(7)
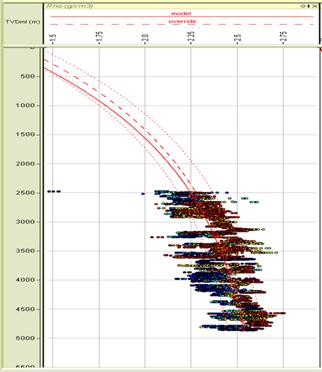
Figure 4. Overburden profile of Well C.
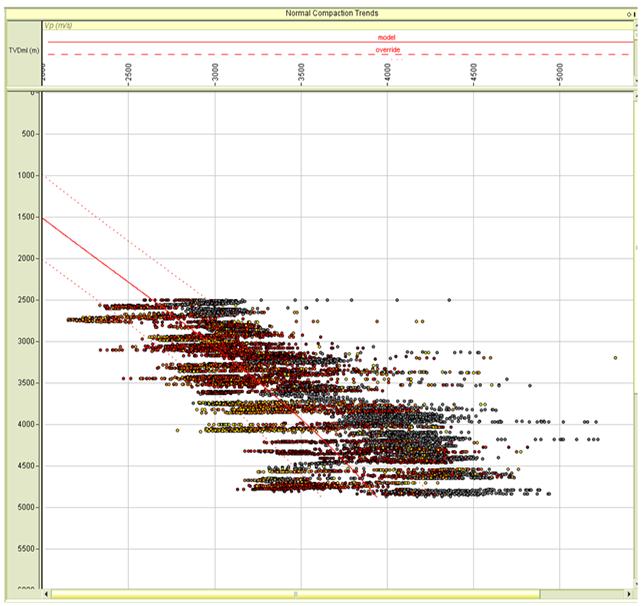
Figure 5. Normal compaction trend of Well C.
6. Pore Pressure Prediction
To predict the pore pressure at the study area, well logs from three offset wells, namely Well A, Well B and Well C, were used. Key logs in the wells include density, sonic, resistivity, porosity and gamma ray (Figure 2). Figure 3 shows the workflow for the offset well-based pore pressure prediction used in this study. The software used was RokDoc 5.1 (www.ikonscience.com). Using the well logs, the overburden profile, normal compaction trend and shale trend were generated as shown in Figures 4, 5, and 6 respectively for Well C. These data were applied in the pore pressure prediction models of Eaton, Bowers and Tau (equations 3, 5 and 7) to estimate the formation pore pressure of the area.
7. Results and Discussion
Figures 7, 8 and 9 show the pore pressure predictions obtained from wells A, B, and C respectively. The predictions were obtained employing the Bowers, Eaton and Tau model of equations 3, 5 and 7 respectively. Overall, the results showed that the area is overpressured, ranging from mild-to-moderate overpressure. The onset of mild overpressure (<0.6psi/ft) lies within the depth range of about 6,600 ftss in Well A and about 11,500ftss in Wells B and C. The formation pressure increases with depth to become moderately overpressured (<0.80 psi/ft) throughout the depth extents of the three wells. In all the wells, predictions obtained using the Bowers and Tau models showed better agreement with measured pressure data (RFT and MDT) than those obtained using Eaton’s exponent model. The Eaton’s exponent model slightly underpredicted the pore pressure of the area. This is in agreement with the result obtained by Ugwu (2015) in the same area using seismic data.
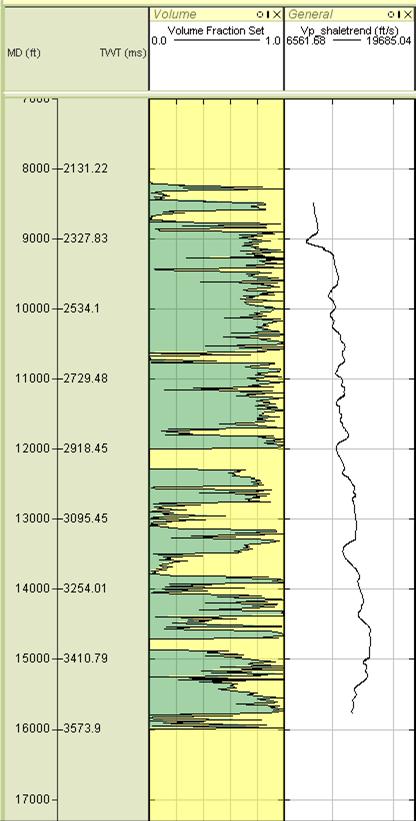
Figure 6. Shale trend of Well C.
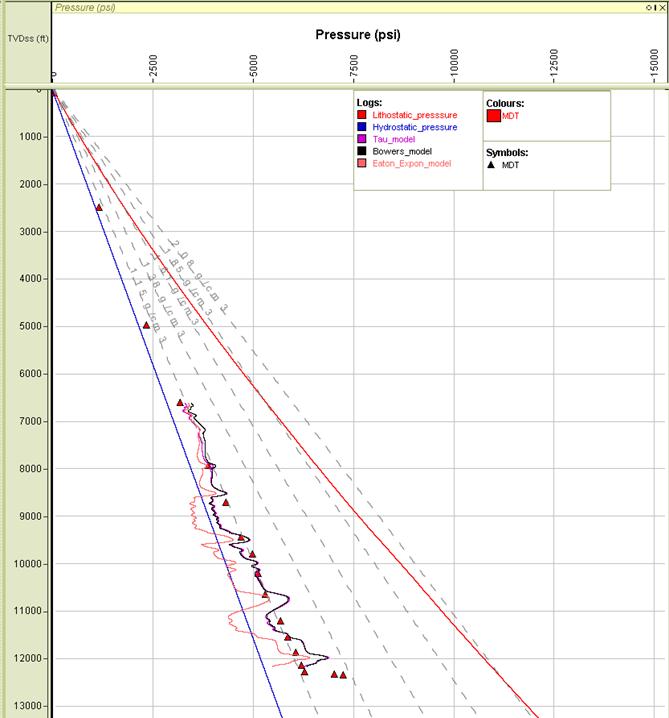
Figure 7. Well A pore pressure prediction
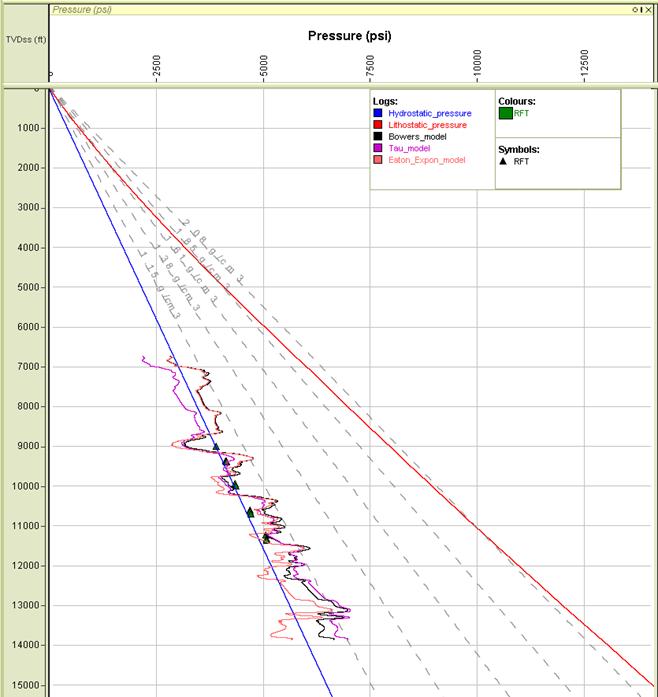
Figure 8. Well B pore pressure prediction.
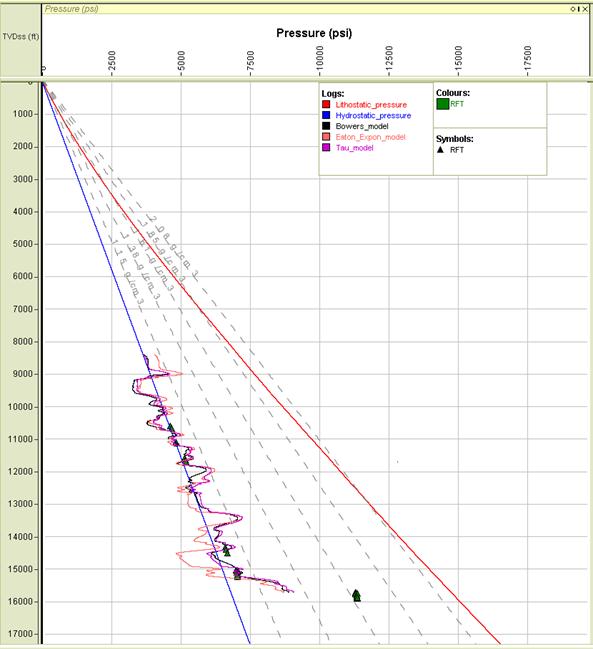
Figure 9. Well C pore pressure prediction.
8. Conclusion
Pore pressure predictions for an onshore Niger Delta area were made using offset well logs. The result showed that the area is overpressured, ranging from mild- to - moderate overpressure. In all the three wells used, better pressure estimates (more in agreement with the measured pressure data) were obtained using Bowers and Tau models than using the Eaton’s exponent model. The Eaton’s exponent model underpredicted the formation pressure of the area in all the Wells used and could be the least appropriate model for pore pressure prediction of the formation.
References
- Bowers GL (1995). Pore pressure estimation from velocity data; accounting for overpressure mechanisms besides undercompaction, SPE Drilling and completions.
- Doust H, Omatsola E (1990). Niger Delta, in: Divergent/Passive Margin basin, Edwards JD, Santogrossi PA (eds.), AAPG Memoir 45, 239-248.
- Eaton BA (1975). The equation for geopressure prediction from well logs, Soc. Petr. Engineers, Paper SPE 5544.
- Hottman CE, Johnson RK (1965). Estimation of formation pressures from log derived shale properties, Journ. Pet. Techn., 6, 717-722.
- Lopez JI, Rappold PM, Ugueto GA, Wieseneck JB, Vu K (2004). Integrated shared earth model: 3D pore pressure and uncertainty analysis. The Leading Edge, 52-59.
- Murat RC (1972). Stratigraphy and paleography of the Cretaceous and Lower Tertiary in Southern Nigeria in: Dessauvagie TFJ, Whiteman AJ (eds.), African Geology, Ibadan University Press, 251 – 265.
- Nwozor KR, Omudu MI, Ozumba BM, Egbuachor CJ, Onwuemesi AG, Anike OL (2013). Quantitative evidence of secondary mechanisms of overpressure generation: Insights from parts of Onshore Niger Delta, Nigeria, petr. Techn. Dev. Jour., 3(1), 64-83.
- Opara AI, Onuoha KM, Anowai C, Onu NN, Mbah RO (2013). Geopressure and trap integrity predictions from 3-D seismic data: Case Study of the Greater Ughelli Depobelt, Niger Delta. Oil and Gas Science and Technology – Rev. IFP Energies nouvelles, 68(2), 383-396.
- Reyment RA (1965). Aspects of Geology of Nigeria, Ibadan University Press. Bull. Geol. Surv. Nigeria, 1, 95p.
- RokDoc 5.1 www.ikonscience.com.
- Short KC, Stauble AJ (1967). Outline of the Geology of the Niger DeltaAss. Petr. Geol. Bull. 54, 170-171.
- Terzaghi K (1943). Theoretical soil mechanics, John Wiley and Sons, Inc.
- Ugwu GZ (In Press). Pore pressure prediction using seismic data:insight from onshore Niger Delta. Jour. Geol. Min. Res.
- Yoshida C, Ikeda S, Eaton BA (1996). An investigative study of recenttechnologies for prediction, detection and evaluation ofabnormal formation pressure and fracture pressure in North andSouth America. IADC/SPE 36381.
- Zhang J, Wieseneck J (2011). Challenges and surprises of abnormalpore pressure in the shale gas formations. Paper SPE 145964presented at SPE Annual Technical Conference and Exhibition, Denver, Colorado, USA


