
American Journal of Geophysics, Geochemistry and Geosystems, Vol. 1, No. 3, August 2015 Publish Date: Jul. 16, 2015 Pages: 66-70
The "Artefacts" of Data Biases in Surface Temperatures are Hiding the Hiatus
A. Parker*
School of Engineering and Physical Science, James Cook University, Townsville, Australia
Abstract
As almost any trend can be built by continuous tampering of past information rather than simply keeping the computational procedure unaltered and updating the data sets with freshly measured data, the latest paper published by NOAA in Science that negates the "hiatus" in global warming since 1998 also admitted by the IPCC is not a surprise. However, this prompts serious questions about the political bias of high impact factor journals. My contribution shows the information from conflicting data sets of measured lower troposphere temperatures and reconstructed surface air temperatures continuously corrected.
Keywords
Surface Air Temperatures, Measurements, Reconstructions, Global Warming, Climate Change
Received:June 9, 2015
Accepted: June 27, 2015
Published online: July 15, 2015
@ 2015 The Authors. Published by American Institute of Science. This Open Access article is under the CC BY-NC license. http://creativecommons.org/licenses/by-nc/4.0/
1. Introduction
The claim by the authors of [1] in Science that "global trends are higher than reported by the IPCC, especially in recent decades, and that the central estimate for the rate of warming during the first 15 years of the 21st century is at least as great as the last half of the 20th century" is a dubious statement motivated with a flawed analysis that should not have passed unobserved by the reviewers of Science, however immediately trumpeted to the readers of Nature [2].
It is very well known that the temperatures (as many other climate parameters) are oscillating with inter-annual and multi-decadal periodicities about longer term trends that may also be natural oscillations [3-14]. It is also very well known that the surface temperature reconstructions since the end of the 1800s are based on computational procedures far from being settled, that build on individual temperature records of unequal length from carefully selected, poorly geographically distributed, thermometers often affected by Urban Heat Island formation [3-14]. In addition to the cherry picking of the supporting information of which temperature records should be considered and which records should be neglected and the use of computational procedures defined ad hoc to magnify warming trends everything but transparent, the revision for no legitimate reason of the supporting individual temperature records (example GISS v2 [15] vs. v3 [16]) should immediately be recognised as a good reason for not trusting the global temperature reconstructions. However, this is not the case, and the arbitrary revision of the past temperatures of [1] is only another proof of the essentially political nature of the alarms over the climate, damaging science, the environment and the well-being of the mankind.
2. Analysis of Global Temperature Data Sets
Since 1979, in addition to selected the thermometers, the lower troposphere temperature is also recorded by satellite missions, but while agreement in between the troublesome and biased reconstructions based on some thermometers and the satellite have been minimal during the upward phase of a multi-decadal oscillation that ended about the year 2000, differences are becoming more and more relevant over the downward phase of the same multi-decadal oscillation that started about the year 2000.
What is important to note for the temperature reconstructions, is that everything for the past changes continuously to magnify the present warming, i.e. the reconstructed global temperature data sets are subject to continuous corrections of past temperatures rather than simple updates of the global record because of novel measurements. The statement of [1] and [2] originates from one further step of arbitrary corrections, and the aim of this paper is to show not only the discrepancies in between reconstructed and measured temperature data sets, but also to show how the arbitrary corrections of the reconstructed temperatures have been working over the last decades, with temperatures drastically cooled down in the past and warmed up approaching the present for now reason.
There exist multiple measures of lower atmosphere temperature as UAH or RSS which indicate the existence of a "hiatus" that should have been used to question a biased reconstruction of global temperatures with unidirectional corrections always in the direction of magnifying the warming. There are also records of the manipulations in the global reconstructions of surface temperatures as HadCRUT, GISS or NCDC that demonstrate how the continuous warming is not the result of novel measurements of fresh temperatures that are warmer, but actually of the arbitrary cooling down of the past temperatures for no legitimate reason.
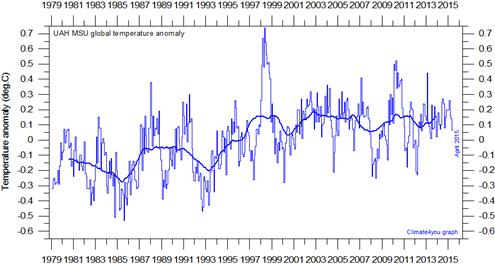
Figure 1. Monthly average global air temperature estimates since 1979. Satellite measured lower troposphere temperature since 1979 according to the University of Alabama at Huntsville (UAH). The thick line is the simple running 37 month average, nearly corresponding to a running 3 year average. The image is from [17], courtesy of Ole Humlum. Since 1998 there is no warming.
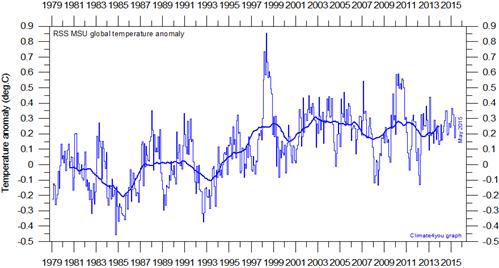
Figure 2. Monthly average global air temperature estimates since 1979. Satellite measured lower troposphere temperature since 1979 according to the Remote Sensing Systems (RSS). The thick line is the simple running 37 month average, nearly corresponding to a running 3 year average. The image is from [17], courtesy of Ole Humlum. Since 1998 there is no warming.
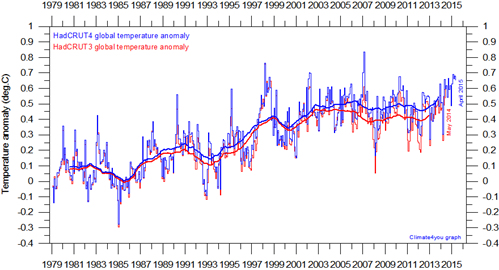
Figure 3. Monthly average global air temperature estimates since 1979. Reconstructed surface air temperature according to Hadley CRUT (HadCRUT). The thick line is the simple running 37 month average, nearly corresponding to a running 3 year average. The image is from [17], courtesy of Ole Humlum. Since 1998 there is a warming mostly created by arbitrarily cooling down the farther past and warming up the more recent past with the move from HadCRUT 3 to HadCRUT 4.
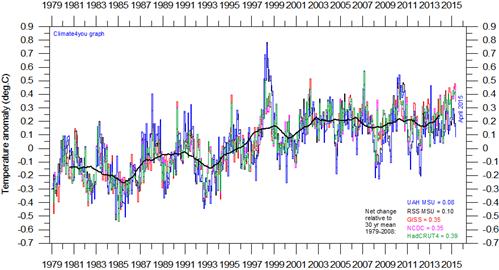
Figure 4.Summary comparison of the global air temperature estimates all normalised by comparing to the average value of 30 years from January 1979 to December 2008. The heavy black line represents the simple running 37 month mean of the average of all five temperature records. The numbers shown in the lower right corner represent the temperature anomaly relative to the above average. Image is from [3], courtesy of Ole Humlum. Since 2008, the reconstructions as GISS, NCDC and HadCRUT have produced four times the warming of the measurements of RSS and UAH.
Figures 1 and 2 present the monthly average satellite measured lower troposphere global temperature since 1979 according to the University of Alabama at Huntsville (UAH) and the Remote Sensing Systems (RSS) respectively. The images are from [17], courtesy of Ole Humlum.Since 1998 there is no warming in these data sets.
Figure 3 presents the reconstructed surface air temperature according to Hadley CRUT (HadCRUT). The thick line is the simple running 37 month average, nearly corresponding to a running 3 year average. The image is from [17], courtesy of Ole Humlum.While the satellite measurements of UAH and RSS show a clear "hiatus" in warming since January 1988, thanks to the continuous manipulation of the supporting data and the computational procedure, the HadCRUT result is suggesting a continuing warming even if at a lesser extent. In addition to the changes HadCRUT.4 vs. HadCRUT.3 all magnifying the warming trend, it has to be pointed out as the latest HadCRUT4 release (HadCRUT.4.3.0.0 of October 2, 2014) has further reduced the temperatures 1850-1875 and increased the temperatures 2005-2014 to produce the present continuing warming trend. This trend is therefore not based on what has been measured 1850 to present, but on what has been arbitrarily corrected in October 2014 of the measurements done 1850 to present. This correction has been operated very hard to say on the basis of which scientific argument. While there may certainly be many legitimate arguments to explain some differences in between satellite measurements and reconstruction, there is certainly no legitimacy in the continuously changing procedures or past data to manufacture one trend as evident in Figure 3.
Figure 4 presents the summary comparison of the global air temperature estimates all normalised by comparing to the average value of 30 years from January 1979 to December 2008. The heavy black line represents the simple running 37 month mean of the average of all five temperature records. The numbers shown in the lower right corner represent the temperature anomaly relative to the above average. The image is from [3], courtesy of Ole Humlum. Since 2008, the reconstructions as GISS, NCDC and HadCRUT have produced four times the warming of the measurements of RSS and UAH.
The statistical analysis of the different GISS reconstructions of global temperatures 1880 to 2008 downloaded monthly from May 2008 to May 2015 that is the novelty of this paper is then used to demonstrate the operation of the tampering of an information that should have been left unchanged. The monthly collection of the GISS time series is provided courtesy of Ole Humlum.
To understand how the corrections of the surface temperature reconstructions works, Figure 5 presents the statistic of all the monthly values of global average temperatures January 1880 to May 2008 proposed by GISS from May 2008 to May 2015. Every month shows the maximum positive and minimum negative difference vs. the average for all the different values proposed for the same temperature over the period of observation. The latest temperature is also shown.
Noticeably the past temperature January 1880 to May 2008 have been moved up and down from May 2008 to May 2015 with changes in positive and negative of even more than 0.1 degree C specifically designed to produce a trend. The latest manipulation visibly magnifies the warming trend January 1910 to May 2008 of +0.15 degrees C/century, but more than that it is hiding the "hiatus", that is the ultimate goal of the latest corrections.
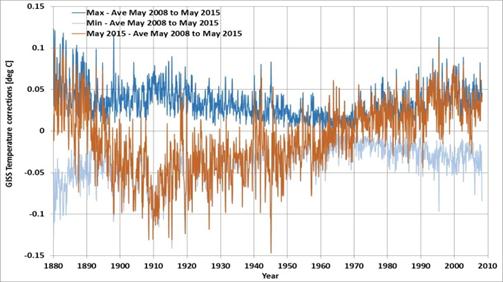
Figure 5. Statistic of the arbitrary corrections of past temperatures January 1880 to May 2008 introduced in the GISS reconstructed surface air temperature from May 2008 to May 2015. According to GISS the carbon dioxide emissions May 2008 to May 2015 have lowered the temperatures 1890 to 1970, with the largest cooling of temperatures about 1910, and increased the temperatures 1880 to 1890 and 1970 to 2008. Global warming should be proven by measurements of temperatures higher today rather than arbitrarily lowered yesterday.
Similar to the other global temperature reconstructions, the GISS datum has suffered of tampering even before May 2008. However, within the purposes of this paper to show how one no warming has been transformed in one warming by arbitrary correction, the analysis of previous GISS time series is not essential.
Figures 1 to 5 openly shows as today’s carbon dioxide emissions have much more influence on the past than the future temperatures according to the global reconstructions of surface temperatures.
While the past tampering have been produced some warming from no warming during the "hiatus", the novelty of [1] is only the further expansion of the well documented "hockey stick" manipulation of past temperatures to produce an unabated warming over this century when it is not. Manipulation, if not the only pillar of global warming, is certainly the most important contributor.
3. Conclusions
As almost any trend can be built by continuous tampering of past information rather than simply updating the data sets with freshly measured new data while keeping the computational procedure unaltered, the requested compliance with the climate model prediction of the reconstructed temperatures may certainly be obtained by "artefacts".
There is no scientific value in the arbitrary corrections always in one sole direction to create similarity with the flawed model predictions. Genuine "artefacts" do not only work for the cause of a "new-world-order" originating from the climate alarmism. Errors are usually randomly distributed and not always in the direction requested by the funding bodies.
References
- Karl, T. R., et al., Possible artifacts of data biases in the recent global surface warming hiatus. Science express, 2015,DOI: 10.1126/science.aaa5632
- Tollefson, J., Puzzling global warming 'pause' was illusion. US agency’s updated temperature records suggest that global warming continues apace. Nature, 2015, doi:10.1038/nature.2015.17700
- A.Parker, MELBOURNE URBAN HEAT ISLAND CONTAMINATION OF TEMPERATURE TREND MAPS IN VICTORIA, AUSTRALIA, Nonlinear Engineering, 2013, 2(1-2):39-62.
- A. Parker, Energy budget constraints on climate response: Uncertainty or wrong theory?, Environmental Science: An Indian Journal, 2013, 8(8):293-296.
- A. Parker, The present global warming hiatus is part of a quasi-60 years’ oscillation in the worldwide average temperatures in the downwards phase, Environmental Science: An Indian Journal, 2014, 9(1):14-22.
- A. Parker, WHY GLOBAL WARMING WENT MISSING SINCE THE YEAR 2000, Nonlinear Engineering, 2013, 2(3-4):129-135.
- A. Parker, Are carbon driven models to predict global temperature change and sea level rise still actual?, Environmental Science: An Indian Journal, 2014, 9(4):156-161.
- A. Parker, May the variable Sun weather and irradiance affect the climate on Earth?, Environmental Science: An Indian Journal, 2014, 9(6):203-210.
- A. Parker, PATTERN RECOGNITION OF TEMPERATURE TRENDS FOR ANTARCTICA FROM LINEAR AND NONLINEAR REGRESSION ANALYSES, Nonlinear Engineering, 2014, 3(3):179-187.
- A. Parker, DISCUSSION OF THE CASE OF THE MISSING HEAT, Nonlinear Engineering, 2014, 3(4): 247-253.
- A. Parker, Global temperatures may not increase by 4ºC by the end of this century, Current Science, 2014, 107(03):0356.
- A. Parker, The temperature record of Alice Spring, Northern Territory of Australia revisited, Environmental Science: An Indian Journal, 2015, 10(3):81-87.
- A. Parker and C.D. Ollier, The warming of Australia is man-made, but not by carbon dioxide. Environmental Science: An Indian Journal, 2015, 10(5):172-183.
- Parker, A., The Acorn Adjustments of Australian Temperatures are in the Wrong Direction, Physical Science International Journal, 2015, 6(4):245-252.
- http://data.giss.nasa.gov/gistemp/station_data_v2/, visited June 1, 2015
- http://data.giss.nasa.gov/gistemp/station_data/, visited June 1, 2015
- http://www.climate4you.com/GlobalTemperatures.htm, visited June 1, 2015


