American Journal of Geophysics, Geochemistry and Geosystems, Vol. 1, No. 3, August 2015 Publish Date: Jul. 20, 2015 Pages: 87-91
The Impact of DTM on the Hydrological Analyses Results
Viera Hurcikova*
Institute of Geodesy, Cartography and Geographical Information Systems, Faculty of Mining, Ecology, Process Control and Geotechnology, Technical University of Kosice, Kosice, Slovak Republic
Abstract
This article presents the impact of digital terrain model quality to basic hydrological analysis. The objects of assessment were the digital terrain model created on the base of contour lines and digital model with terrain skeleton. Comparing the results of basic hydrological analyzes of the two models, the model created only from the contour lines, has been shown to be insufficient to achieve relevant results in hydrological modelling. The aim of this article is to point to the significance of including terrain edges to the digital terrain model, which to serve as a basis for further processing and analyses.
Keywords
Digital Terrain Model, Terrain Skeleton, Hydrological Analyses, Arcmap
Received: June 4, 2015
Accepted: June 19, 2015
Published online: July 16, 2015
@ 2015 The Authors. Published by American Institute of Science. This Open Access article is under the CC BY-NC license. http://creativecommons.org/licenses/by-nc/4.0/
1. Introduction
Analytical tools of geographic information systems (GIS) are generally used in performing elementary hydrological analyses at digital terrain model. The cardinal factors which affecting the results of these analyses are geomorphometric indicators of relief, as the slope, orientation, eventually curvature of the relief, which can be determined by analyses of digital terrain model (DTM) [5].
DTM is a set of horizontal and vertical associated data characterizing the geometric and morphometric characteristics of the terrain. Its quality depends mainly on the input elevation data and the selection of a suitable interpolation method. In that DTM subsequently enters into a variety of analyses, its parameters significantly affect the quality and relevance of these results.
In case that input data for the digital model are contour lines obtained by vectorization, the output model is not ideal, because the algorithm does not work with terrain edges such as crest lines and thalwegs. The areas that do not really exist in the terrain are generated in the model as a consequence. Many programs for creating DTM do not deal with such singularities. The solution is to design and create an algorithm that can automatically generate these singularities or add singularities to the model [8,9].
Software solution to this problem is quite difficult; for non-programmers virtually impossible. In the following we will show how important is the addition the mass points and break lines to the model.
2. Getting Input Data
To create a digital terrain model, it is possible to use different data sources. Into consideration comes a different kind of maps in analogue and digital form, photogrammetric documentation, and data from remote sensing etc. The choice of data source and sampling techniques significantly influences the quality of the DTM. Data for DTM should include data of altitude, or other information on a specific curving of terrain topography, for example: structural lines, edges and so on [2].
In actual practice, we are limited by time and finances that we have, so we try to get the highest quality, and most minimum necessary amount of data that will enable us to achieve a reliable result, without detailed measurements or purchase expensive commercial data.
The most common and cheapest way to get elevation data of relief is the digitization of topographic maps that are publicly available in virtually any scale. It is a resource that provides particular contours. The automatic vectorization it is possible to use for vectorization of contour lines. It is necessary to define the parameters of automatic vectorization and start the process of vectorization. This method is fast and suitable for processing data with the same characteristics. Output is automatically saved and after vectorization process, we obtain a vector layer of contours. This layer needs to be supplemented with information about the contour lines height.
The advantage is that contours can be directly used to generate the DTM. Contrary, the main disadvantage is, that terrain does not sample by its characteristic points, that is, not in places where individual terrain surfaces are clearly interfering and terrain changes its curving. Forasmuch as in this case the hypsography is digitized across the contours, there are many points of equal altitude. These points created the horizontal triangles in the triangulation, which results in the formation of planar faces in a DTM which actually does not exist in the field [6,7].
3. Data Models of Digital Terrain Model
For DTM creation are usually used two types of data models namely triangulated irregular network (TIN) or raster (grid).
DTM format grid corresponds to a raster data model, whose surface is divided into an array of cells that have for ease of calculating the most common form of a square cell. Each cell has an associated altitude, relative to the centre of the cell.
TIN belongs to vector structures. It is based on an irregular network of adjacent triangles, where each vertex of the triangle has assigned the altitude [6].
4. The Impact of DTM on the Hydrological Analyses Results
In performing hydrological analyses at the digital elevation model, it is important to preserve the model morphologic characteristics of real terrain, such as slope of the curve direction, etc. The calculation of these characteristics is possible for TIN and grid.
In the TIN model each triangular facet presents a plane for which it is possible to determine its fall line and normal, which allow determining slope and aspect. In the case of the grid model, the situation is more complicated. The sliding window size of 3x3 cells is usually used for the determination of searched parameters. From the heights of borderline cell window it is possible to determine the searched parameters for the central cell.
To the formation of so-called horizontal triangles can occur in triangulation. These are created in that case, when the triangulation algorithm chose points of the same altitude to generate triangles. Such cases arise mainly on the tops of hills and around crest lines and thalwegs. In these places there is the creation of the "stairs" (Fig. 1).
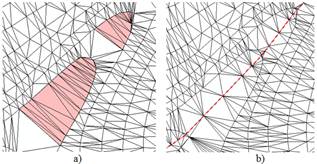
Figure 1. a) the terrain model derived from the contours with marked the unwanted horizontal triangles, b) reduction of the horizontal triangles by adding the required break line.
In the case of the creation of the horizontal planes, the slope of relief and orientation to cardinal is not defined, causing problems in subsequent analyses. Such errors in the model can be removed by inserting additional points with altitude or inserting the lines of terrain skeleton.
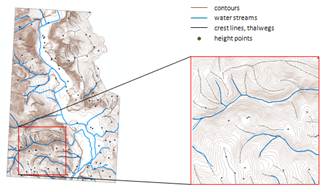
Figure 2. Input data for DTM.
It follows that the contour lines as a single source for the DTM are insufficient. To create quality DTM therefore we need besides contour the other data that faithfully capture the individual singularity of terrain topography (Fig. 2). They are mainly the lines of terrain skeleton, thus crest lines, thalwegs, form lines and slope changes introduced into the model as break lines and edges. Further, it would be the individual points of terrain skeleton, which are the singular points of the field altitudes. This includes top, depression and saddle points [2,4].
It is possible to create a terrain model from these input data. This model takes into account all characteristic features and changes in relief topography and thus faithfully describes the actual reality. The various analyses it is possible to perform at the so created model.
5. DTM Creating
Software ESRI ArcGIS Desktop 9.3 and its tools 3D Analyst and Spatial Analyst tools were used to create a digital terrain model and subsequent hydrological analyses. These tools allow efficient work with spatial data and carrying out hydrological analyses [1]. FIG. 3 shows the difference between the digital model created only from the contours (a) and terrain model, in which includes all the necessary information of changing and curving relief topography (b).
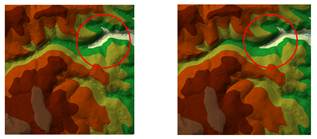
Figure 3. The resulting digital terrain model a) model created only from the contours b) model accounting the terrain edges.
In the figure 3a are obvious errors arising from the lack of the necessary altitude data in the field, in the model (b), which includes terrain edges these errors are not.
The lack of the data describing the relief is already reflected in the initial creation of terrain model. This fault is subsequently transferred to the all analyses performed over the model.
Hydrological analyses are usually realised at the raster terrain model. Raster type model can be obtained directly interpolating a set of height points obtained by direct measurement in the field, or by converting vector model, as was the case here. The measured data were not available, only the data obtained on the basis of vectorization analogue maps of the area of interest [2,6].
Comparison of the final raster models is shown in Fig. 4. On the FIG. 4 (a) are again clearly visible irregularities caused by a lack of input data.
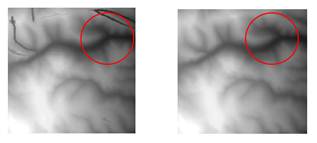
Figure 4. The raster model of relief a) the model created only from the contours b) the model accounting for terrain edges.
6. Hydrological Analyses
The basic hydrological characteristics as determined above DMR include calculating qualitative (direction) and quantitative (amount) characteristics of drainage. The current available systems are reflective with eight flow direction with respect to the orientation of the cardinal.
Flow direction is typically marked by the number (Fig. 5). Generally is started in the top position in the process in the clockwise direction. In the event that more neighbouring cell does not contain a lower value, the cell represents decline (outflow element).
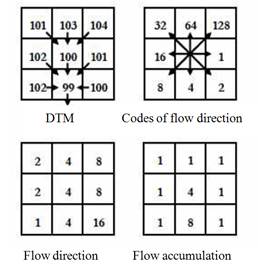
Figure 5. Codes of flow direction, flow accumulation.
To determine the direction of flow it was used function Flow Direction. The result is a corresponding raster (Fig. 6), where the value of each raster pixel represents the direction of the most common descent of this pixel. The calculation is done on the principle of sliding window of size 3x3 cells. Within the frame of sliding window the value by the lowest altitude it is determined. [2,10].
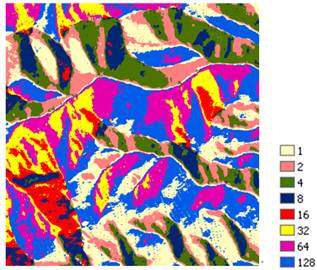
Figure 6. The flow direction.
Then, from DTM and the raster that describing the flow direction it is possible calculate the raster which representing the accumulation of water in a given area (Figure 7). The cell value of created raster is the number of cells from which the water flows into this cell. Fig. 7 shows the resulting raster, showing the accumulation of water, created at the model which does not include the required terrain edges, with the result that all errors in the model are transmitted to the further analyses. The detail shows, that modelled drainage network is discontinuous and therefore does not reflect reality.
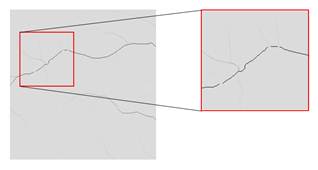
Figure 7. Flow accumulations.
On the basis of these analyses it is possible realise a number of further analyses, like, to define the individual river basins, for example. Basin can be defined as an attribute of each point DTM, which identifies the territory lying in a tributary of this point. Basins boundaries can be detected using different algorithms tied with flow characteristics (flow direction and flow accumulation). Within the frame these basins it is possible to determinate other characteristics, such as a continuous length of slopes (suitable for the calculations in the erosion models). The principle of mathematical classification is based on an algorithm of recognition of terrain form, depending on the continuous changes of slope, aspect, and the horizontal and vertical curvature of relief.
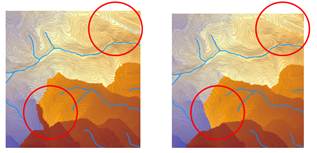
Figure 8. The length of flow a) the model created only from the contours b) the model accounting the terrain edges.
In the Fig. 8 is presented the raster showing the length of individual drains. Again, the picture shows effect of model constructed only on the basis of contour lines, compared to the complete model describing all the characteristics of the relief.
7. Conclusion
The article deals with assessment the impact of the digital elevation model on the elementary hydrological analyses. In digital model created of contour lines we are confronted with a specific problem that the irregular flat areas are generated in the model. These do not really exist in the terrain. Subsequently, this error is transmitted to all analyses carried out by the model. To solve this problem, the additional altitude data of terrain skeleton (crest lines, thalwegs, edges and mass points) were included in the model. This method has shown very good results in application. The article compares the results of hydrologic analyses of both models, of which results that the model created only from the contour lines is inadequate for hydrological modelling. It follows that it is necessary to pay great attention to creation of the digital terrain model, because significantly affects the quality and relevance of the obtained results.
References
- Booth, Bob: Using ArcGIS 3D Analyst. ESRI, 2000
- Hurčíková, V.: Digitálne modely reliéfu, Edičné stredisko F BERG, Technická univerzita v Košiciach, 2011
- Hurčíková, V.: Digitálny priestorový model sypanej hrádze vodného diela Pod Bukovcom, Posterus, 2013
- Hurčíková, V.: Topografia, Edičné stredisko F BERG, Technická univerzita v Košiciach, 2006
- Kubinský, D.: Topické ukazovatele reliéfu, http://www.dkubinsky.sk/blog/gis/topicke-ukazovatele-reliefu
- Li, Z., Zhu, ch., Gold, Ch.: Digital Terrain Modeling: Principles and Methodology, CRC press, 2004
- Peckham, R. J, Jordan, G.: Digital Terrain Modelling - Development and Applications in a Policy Support Environment, Springer-Verlag Berlin Heidelberg 2007
- Omerbegović, V., Barbalić, D.: Correction of horizontal areas in tin terrain modeling – algorithm, http://proceedings.esri.com/library/userconf/proc99/proceed/papers/pap924/p924.htm
- Tchoukanski, I: ET Spatial techniques - Triangulated Irregular Network, http://www.ian-ko.com/resources/triangulated_irregular_network.htm
- Tuček, J.: GIS – principy a praxe, Computer press, Praha 1998


