
American Journal of Food Science and Health, Vol. 1, No. 2, June 2015 Publish Date: May 18, 2015 Pages: 43-50
Physicochemical and Functional Properties of Four New Genotypes (Cyamopsis tetragonoloba L.) of Guar Gum
Amir A. Eldirany1, Azhari A. Mohamed Nour1, Khadir E. Khadir2, Khalid A. Gadeen1, Mohamed AE. M. Ibrahim3, *
1Department of Nutrition and Food Technology, Faculty of Science and Technology, Omdurman Islamic University, Omdurman, Sudan
2Department of food science &Technology, Faculty of Agriculture, Omdurman Islamic University, Omdurman, Sudan
3Faculty of Public and Environmental Health, University of Khartoum, Sudan, Now, Albaha University, FAMS, Albaha City, Saudi Arabia
Abstract
The objective of this work was to study the physicochemical and functional properties of guar gum extracted from four new genotypes of guar seeds (GM5, GM6, GM9 and GM34) collected from the experimental farm of University of Khartoum- Shambat .The physical characteristics and chemical composition were investigated for the gum extracted from the guar seeds, water holding capacity, emulsifying stability and foaming properties were also determined for the gum. Results obtained showed that the chemical composition of guar gum confirm insignificant (P≥0.05) variation in protein and carbohydrate content among all genotypes. Minerals content (macro elements) of guar gum were 0.0075-0.020%, 0.019-0.024%, 0.20 - 0.30%, 0.020 – 0.035% and 0.060 – 0.09% for P, Na, K, Ca and Mg, respectively .While (micro elements) (mg/kg) were 17.74-43.5, 3.7- 27.4 and 0.19-0.54% for Fe, Zn, Pb, respectively. The results of functional properties of guar gum tested revealed that GM34 had significantly (P≤0.05) lowest value of pH and optical density, and GM6 genotype had significantly (P≤0.05) the lowest value of viscosity (0.11 cps). Genotype GM5 and GM6 gives significant (P≤0.05) highest values of solubility compare with the values given by genotype GM34 and GM9. Investigation revealed that Water Holding Capacity (WHC) followed GM34 88.97%, GM5 81.67%, GM9 79.02% and GM6 58.84%. Also results revealed insignificant (P≥0.05) variation in foaming properties values for all genotypes under study. Generally the genotype GM34 had the best functional properties of guar gum. The genetic variations have affected the chemical composition, physical and functional properties of guar gum. The Foaming Capacity (FC) is not high, but the values of foam stability (FS) were highest of guar gum.
Keywords
Guar Gum, Genotypes, Optical Density, Water Holding Capacity, Emulsifying Stability, Foaming Properties and Elements
Received: April 9, 2015 / Accepted: April 23, 2015 / Published online: May 15, 2015
@ 2015 The Authors. Published by American Institute of Science. This Open Access article is under the CC BY-NC license. http://creativecommons.org/licenses/by-nc/4.0/
Contents
1. Introduction 2. Materials and Methods 2.1. Guar Seeds 2.2. Guar Gum Extraction 2.3. Chemical Composition of Guar Seeds (Proximate Analysis) 2.4. Determination of Minerals Content (Minerals Extraction) 2.5. Determination of Phosphorous Content (%) 2.6. Sodium, Potassium, Calcium and Magnesium Content 2.7. Iron, Zinc and Lead Content 2.8. Determination of Physical Characteristics of Guar Gum 2.9. Determination of Functional Proprieties of Guar Gum 2.10. Statistical Analyses 3. Results and Discussion 3.1. Physical Characteristics of Guar Gum 3.2. Refractive Index 3.3. Relative Viscosity 3.4. pH-Value 3.5. Optical Density 3.6. Solubility 3.7. Chemical Composition of Guar Gum 3.8. Carbohydrate Content (As Galactomannan) 3.9. Ash Composition (Minerals Content) of Gaur Gum 3.10. Functional Properties of Guar Gum 3.11. Foaming Properties 4. Conclusion
1. Introduction
The guar plant also known as cluster bean (Cyamopsis tetragonoloba (L)Taub),is a drought hardy leguminous crop. Guar is being grown for seed, green fodder, vegetable and green maturing. It is an annual plant; about 4 feet high and vertically stacked and also known as Cluster Bean Cyamopsi with large leaves and clusters of pods. Each pod is about 5-8 cm long and with an average 6-9 small grayish white pea shaped seeds. The pods are used as green vegetable or as cattle feed besides the industrial extraction of guar gum (Sharma,et al, 2007). Chemically, guar gum is a straight chain, galactomannan polysaccharide. The chemical structure of guar gum consists of a linear chain of D-mannose units linked together by β- (1-4) glycosidic linkages and having certain D-mannose units, a single D-galactose unit joined by an α -(1– 6) glycosidic linkage, on average. Alternate D- mannose units bear D-galactose units (Whistler, 1954). The ratio of D-manopyranosyl to D-galactopyranosyl unit is about 1.8:1 (Whistler and Hymowitz, 1979). The average molecular weight of guar gum is in the range of 1-2 x 10⁶ Dalton (Boggs, 1949 thesis), in other words the polymer is a chain of 1– 4 linked β-P-mannopyranosyl units with every second unit bearing on carbon atom C6 a single unit side chain consisting of α-D-galactopyranosyl group, (Whistler and Smith, 1952).
Guar gum is mainly used in food industries for frozen food products, baked food products, sauce and salad preparations, confections, beverages, pet food etc. It is widely used in textile, paper, and explosives industries, oil and gas drilling, mining, construction, pharmaceutical, and many other industries. The Guar crop is produced in India, Pakistan, Sudan, USA, South Africa, Brazil, Zaire and Australia (Sharma et al, 2007). In Sudan, the guar in plantation was tried at Gezira Research Station as early as 1930 (Flowerman, 1987), and the Guar Gum Company established at Singa 1996. India, Pakistan, USA, and Germany are the major exporters of guar gum, while China, Japan, United Kingdom, and Mexico are the major importers of guar gum, (Sharma et al, 2007). Guar gum gives improved dispersivness and emulsification although it appears that this emulsification activity is absent in the polysaccharide, and in the presence of protein impurities (Disckinson, 2003). Guar gum in large doses is being investigated as a bulk laxative (Chopra et al, 1956). It has been observed to exert a hypocholerolaemic effect in the presence of sucrose in the diet, but not in the cause of starch consumption, (Ahrens et, al., 1991). It has been found to improve insulin sensitivity, blood lipid, blood pressure and fibronolysis in healthy men (Landin et, al, 1992) and reduced blood glucose level in fasting people and hemoglobin (Vuorinen et al, 1992). The gum powder is used in pharmaceutical industries as gelling, viscosifying, and thickening agent, and stabilizer, and emulsifier, as well as for preservation, water retention, water phase control, binding, process aid and pour control for following applications (Chudzikowski, 1971). In tablet manufacturing it is used as a binder and disintegrating agent and in micro-encapsulation of drugs (Eatherton et al, 1955). It’s also used in toothpaste, and shaving cream for easy extruding from the container tube (Sharma et, al, 20007). The guar gum also used as a thickener, and colloid protective in Skin care products, creams and lotions (Chudzikowski, 1971).
The broad objective of this study is to extract the guar gum and study its chemical and physical properties, to study the functional properties and to evaluate the four new guar genotypes.
2. Materials and Methods
2.1. Guar Seeds
Four guar genotypes (new genotypes), GM5, GM6, GM9 and GM34, obtained from Department of Agronomy Faculty of Agriculture, University of Khartoum (U of K), Sudan, were used in this study. These genotypes were planted during (2007-2008) season at Shambat area, experimental farm of the Faculty of Agriculture, U of K. After harvesting, guar seeds were sieved to remove broken seeds, soil particles and foreign material.
2.2. Guar Gum Extraction
Guar seeds were soaked in distilled water for about 10 hours. The seeds were swollen and the outer layer (Hull) was removed easily and middle layer (Endosperm) was opened into two parts and the inner portion (Germ) was removed. The endosperm parts were oven dried at 100°C for 20 minutes, and extracted with the endosperm was ground to fine particle size using milling machine and sieves (0.4 mm mesh sieve) and stored in polyethylene bags.
2.3. Chemical Composition of Guar Seeds (Proximate Analysis)
Moisture, lipid, ash, and crude protein (micro-Kjeldahl) of guar seeds were determined according to AOAC (1995) method. Protein was calculated as N%× 6.25. Total carbohydrate was determined by difference. Crude fiber content was determined according to the acid/alkali digestion method of AOAC (1984).
2.4. Determination of Minerals Content (Minerals Extraction)
Minerals were extracted from the ash according to Pearson method (1981). To the ash obtained about 5 ml of 5N HCL was added and the mixture was brought to boiling for 10 minutes to dissolve the minerals in HCL. Then the mixture was filtered into a conical flask (volume 100ml) and the minerals below were determined.
2.5. Determination of Phosphorous Content (%)
Phosphorus was determined by ammonium molybdate/ ammonium vanadate method using a Spectrophotometric method, as described by AOAC (1984). A standard curve was prepared from Potassium dihydrogen Phosphate to determine Phosphours concentration in the sample.
2.6. Sodium, Potassium, Calcium and Magnesium Content
Na+, K+, Mg2+ and Ca2+ were determined according to the AOAC (1984) using Coring 400 Flame Photometer, JENEWY, England.
2.7. Iron, Zinc and Lead Content
Iron, Zn and Pb were determined according to the analytical method of Atomic Absorption Spectroscopy (Perkin- Elmer 1100 V, Waltham. MA. USA).
2.8. Determination of Physical Characteristics of Guar Gum
2.8.1. Refractive Index
Refractive index of the extracted guar gum was determined according to AOAC (1984), using Refract- meter HILGER & WATTS -M46.315/56304-27137, England.
2.8.2. Relative Viscosity
The relative viscosity of extracted guar gum (0.1 gram/100 ml) was determined according to AOAC (1984), using U shaped Viscometer, serial No; 350 BS/IP/CF 1544, Germany.
2.8.3. pH- Value
PH was determined according to AOAC (1984), using HANNA- pH 210, pH-meter, USA.
2.8.4. Optical Density
The optical density was determined by using the Spectrophotometer serial No SP-1105/25~264 VAC, at 534nm, JENEWY, England.
2.8.5. Determination of Solubility
Solubility was obtained by dissolving 1 gram of sample in 100 ml distilled water, stirred for 30 minutes by magnetic stirrer and the solution filtered through a filter paper No14 which was weighed before filtration .The filter paper and contents were then dried at 105°C for 30 minutes, cooled and weighed.
2.9. Determination of Functional Proprieties of Guar Gum
2.9.1. Water Holding Capacity (WHC)
It was determined according to Hansen, (1978). One gram of gum sample was accurately weighed in a Petri-dish, and then transferred to desiccators (half -filled with distilled water) and incubated for: 24, 48, 69, 120 and 144 hours, the Petri-dish with sample was then reweighed.
2.9.2. Determination of Emulsifying Stability
It was determined according to (Kinsella, 1979). Gum solution (20% concentration) was mixed with oil (Sun flower oil) at ratio of 80:20 W/W respectively; they were mixed using a blinder for one minute. The mixture was then diluted to the ratio of 1:1000 and it was read at 520 nm. The second reading was taken after one hour.
2.9.3. Determination of Foaming Properties
The Foaming Capacity (FC) and Foam Stability (FS) were assessed using the procedure described by Kabirullah and Wills, (1982).This involved blending 30 ml of sample (1%) for 2 min at 25˚C. The mixture was poured into 100ml measuring cylinder and the foam volume was recorded after 30sec.
2.10. Statistical Analyses
Replicate of each sample was analyzed using statistical system, the analysis of variance was performed to examine the significant effect in all parameters, and Least Significant Difference test (LSD test) was used to separate the means (Peterson, 1985).
3. Results and Discussion
3.1. Physical Characteristics of Guar Gum
Table (1) shows the physical characteristics of four guar gum genotypes (GM5, GM6, GM9 and GM34).
3.2. Refractive Index
Table (1) shows the refractive index of the four genotypes of guar gum to have the same value 1.3237˚. This value is in conformity with the value of 1.3237˚ obtained by Sabah Elkhier, (1999).
3.3. Relative Viscosity
From Table (1) it is shown that the average of relative viscosity of the four extracted guars gum was found to be 0.132, 0.130, 0.110 and 0.130 CPs for GM5, GM6, GM9 and GM34 guar genotypes, respectively. The variation in relative viscosity (using distilled water 0.1g/100mL) showed insignificant difference (P≥0.05) between genotypes GM5, GM6 and GM34 (which gave higher values), but significant difference (P≤0.05) between them and genotype GM9 was observed. This result agrees with the result reported by Sabah Elkhier (1999) .The variation in relative viscosity might be attributed to genetic variation.
Table (1). Physical Characteristics of guar gum:
| Genotype | Refractive Index (˚) | Viscosity (CPs) | pH- Value | Optical Density(˚) | Solubility (%) |
| GM5 | 1.3237a (±0.0) | 0.132a (±0.02) | 6.4a (±0.05) | 0.0446a (±0.000) | 79.1a ( ±1.6 ) |
| GM6 | 1.3237a(±0.0) | 0.130a(±0.01) | 6.33a(±0.05) | 0.0443a (±0.001) | 78.87a(±2.5) |
| GM9 | 1.3237a(±0.00) | 0.110b(±0.01) | 6.4a(±0.07) | 0.0416a(±0.003) | 70.53b(±0.57) |
| GM34 | 1.3237a(±0.00) | 0.130a (±0.006) | 6.02b(±0.1) | 0.0313b(±6x10⁻⁴) | 70.67b(±0.89) |
| L.S.D | 0.00 | 0.027 | 0.144 | 0.00428 | 2.21 |
| C.V% | 0.000 | 14.15 | 1.50 | 2.77 | 1.95 |
| S.E ± | 0.00 | 0.005 | 0.03 | 3.3x10⁻⁴ | 0.42 |
*Means not sharing a common letter in the same column are significantly different (p≤0.05).
*Each values in the Table is a mean of three replicates ±S.D
*Viscosity = 0.1% solution.
3.4. pH-Value
Table (1) shows the pH-values of four genotypes of guar gum which found to be 6.4, 6.33, 6.4 and 6.02 for GM5, GM6, GM9 and GM34 genotypes respectively. It is observed that the variation in pH–values showed insignificant (P≥ 0.05) difference between genotypes GM5, GM6, and GM9, but a significant (P≤0.05) difference between them and genotype GM34 was noticed. These results are higher than the values of pH 4.07 to 5.99 reported by Sabah Elkhier, (1999), but are in conformity with the values ranging from 6 to 7 reported by Whistler, (1954), as well as the Sudanese standard of guar gum solution reported by Sudanese Guar Co,(2008). The variation of pH-values may be attributed to genetic variation.
3.5. Optical Density
Table (1) shows the values of optical density of four guar gum genotypes samples which were 0.0446°, 0.0443°, 0.0416° and 0.0313° for GM5, GM6, GM9 and GM34 respectively. The variation in optical density is insignificantly (P≥0.05) different between the genotypes GM5, GM6 and GM9, but a significant difference (P≤0.05) between them and genotype GM34 was noticed. These values are in conformity with the values ranging from 0.02° to 0.095°obtained by Sabah Elkhier, (1999). The variation in optical density of extracted guar gum may be attributed to genetic factors.
3.6. Solubility
From Table (1) it is shown that the average of solubility of four genotypes of extracted guar gum was found to be 79.1%, 78.87%, 70.53% and 70.67% for GM5, GM6, GM9 and GM34 guar cultivars respectively. It is noticed that there are insignificant differences (P≥0.05) between genotypes GM5 and GM6 and also between genotype GM9 and GM34, but a significant differences (P≤0.05) between genotypes GM5 and GM6 (from one side, which gave highest values) and genotypes GM9 and GM34 on the other side (which gave lowest values) were observed. According to these results guar gum can be classified in the group half soluble gums, like Kadad Gum (Mantella, 1965). The variation in solubility of extracted guar gum may be attributed to genetic factors.
3.7. Chemical Composition of Guar Gum
3.7.1. Moisture Content
Table (2) shows the moisture content of four guar gum genotypes which were found to be 7.35%, 6.92%, 6.44% and 6.94% for GM5, GM6, GM9 and GM34 respectively. It is observed that the variation in moisture content did not show significant (P≤0.05) difference between genotypes GM6, and GM34. But significant difference (P≤0.05) between them and genotypes GM5 and GM9 was observed and significant difference (P≤0.05) between genotypes GM5 and GM9 was also noticed. These results are higher than the value (5%) obtained by Thomas et al, (1980), but lower than those values 10 to15% reported by Whistler and Hymowitiz, (1979). Results reported by Eldaw (1998) were in the range of 6.0% to 6.5%. These results were complying with the range 4.8 to 8.7% reported by Sabah Elkhier, (1999). The variation in the moisture content of guar gum may be due to the environmental conditions during the storage.
3.7.2. Protein Content
From Table (2), it is clear that the average protein content of guar gum extracted from genotypes GM5, GM6, GM9 and GM34 was found to be 5.82%, 6.82%, 6.68 and 6.29% respectively. It is observed that the variations in protein content of different guar gums are insignificantly (P≥ 0.05) different among all the genotypes. These results are higher than the value ranged from 4.30% to 4.48% reported by Eldaw, (1998), and still higher than the values varied from 3.5% to 5.0% obtained by Sabah Elkhier, (1999), and the values of 5% to 6% reported by Whistler and Hymowitz, (1979).
Table (2). Chemical Composition of Guar Gum:
| Genotype | Moisture (%) | Crude protein (%) | Crude Oil (%) | Ash (%) | Crude fiber (%) | Carob- hydrate (%) |
| GM5 | 7.351a(±0.04) | 5.818a(±0.25) | 0.725a(±0.11) | 0.93c(±0.09) | 1.285a(±0.10) | 83.887a(±0.53) |
| GM6 | 6.918b(±0.05) | 6.824a(±0.77) | 0.708a(±0.13) | 0.92c(±0.10) | 1.728b(±0.06) | 82.903a(±0.90) |
| GM9 | 6.444c(±0.04) | 6.679a(±0.41) | 0.564a(±0.13) | 1.33b(±0.10) | 1.402c(±0.007) | 83.576a(±0.12) |
| GM34 | 6.937b(±0.11) | 6.285a(±0.10) | 0.375b(±0.004) | 1.5a(±0.00) | 1.863a(±0.02) | 83.039a(±0.20) |
| L.S.D | 0.126 | 0.764 | 0.174 | 0.178 | 0.117 | 0.92 |
| C.V % | 1.19 | 7.86 | 19.30 | 10.04 | 4.97 | 0.73 |
| S.E± | 0.023 | 0.144 | 0.033 | 0.034 | 0.022 | 0.18 |
*Means not sharing a common letter in the same column are significantly different (P≤0.05).
*Each values in the Table is a mean of three replicates ±S.D
*Carbohydrate by difference.
3.7.3. Oil Content
As shown in table (2), the oil content for guar gums extracted from four genotypes was found to be 0.73%, 0.71%, 0.56% and 0.38% for GM5, GM6, GM9 and GM34 respectively. It is noticed that there is insignificant (P≥0.05) difference between genotypes GM5, GM6 and GM9, but significant difference (P≤0.05) between them and genotype GM34 was observed. These values comparable to the result 0.6% obtained by Whistler and Hymowitz, (1979), and also similar to the range of 0.17% to 0.84% reported by Eldaw, (1998). The oil contents of these genotypes except GM34 is in conformity with the value of 0.5to 0.9% reported by Sabah Elkhier (1999). The variation in the oil content of guar gum may be attributed to genetic factors.
3.7.4. Ash Content
Data in Table (2) shows that the ash content of guar gum extracted from the four guar genotypes was found to be 0.93%, 0.92%, 1.33% and 1.5% for GM5, GM6, GM9 and GM34 genotypes respectively. It is observed that the ash content of the genotypes GM5and GM6 showed insignificant (P≥0.05) difference, but significant (P≤0.05) difference between them and genotypes GM34 and GM9 was observed. These results are higher than the values ranging from 0.5% to 0.8% reported by Whistler and Hymowitz, (1979).The values of ash content of genotypes GM5 and GM6 were in conformity with the values of 0.5 to 1.25% reported by Sabah Elkhier, (1999), but the values of ash content of cultivars GM9 and GM34 were in conformity with the value from 1.0 to 2.0% obtained by Eldaw, (1998). The variation in the ash content of guar gum may be due to genetic factors.
3.7.5. Crude Fiber Content
Table (2) shows the crude fibre content of guar gum extracted for four guar genotypes GM5, GM6, GM9 and GM34 was found to be 1.29%, 1.73%, 1.40% and 1.86% respectively. It is observed that the variation in crude fibre content of guar gum showed significant (P≤0.05) difference between genotypes GM34, GM6, GM9 and GM5, ranking in a descending order. These results are comparable to the value of 1.5% reported by Whistler and Hymowitz, (1979) and in conformity with the values ranging from 1.25% to 1.99% obtained by Eldaw, (1998).The variation in the crude fibre content of guar gum among genotypes may be attributed to genetic variation.
3.8. Carbohydrate Content (As Galactomannan)
The analytical data of carbohydrate content of guar gum for genotypes GM5, GM6, GM9, and GM34 (Table2), it were found to be 83.89%, 82.90%, 83.58% and 83.04% respectively. It is noticed that there were insignificant (P≥0.05) differences in carbohydrate content between the genotypes studied. These results are lower than the values ranging from 85.39 to 86.48% reported by Eldaw, (1998) and lower than the values reported by Sabah Elkhier, (1999) which ranged from 84.25% to 86.9%, but are comparable to the values ranging from 78% to 82% reported by Whistler and Hymowitz, (1999). These values as well as Sudanese Standard of guar gum powder reported by Sudanese Guar Co. (2008), which stated that the level of carbohydrate content of guar gum can be less than 80% .The variation of carbohydrate content (galactomannan) among the different genotypes, may be due to genetic variation.
3.9. Ash Composition (Minerals Content) of Gaur Gum
3.9.1. Macro-Elements Content
(i) Phosphorus
Table (3) shows the phosphorus content of guar gum extracted from genotypes GM5,GM6,GM9 and GM34 which was found to be 0.017%, 0.008%, 0.020%, and 0.017%, respectively. It is observed that the phosphorus content of guar gum showed significant (P≤0.05) differences among the four genotypes.
(ii) Sodium
As can be shown from Table (3) the values of sodium content of guar gum extracted from genotypes GM5, GM6, GM9 and GM34 was found to be 0.019%, 0.023%, 0.024% and 0.021% respectively. It is found that the variation in sodium content had insignificantly different (P≥0.05) between genotypes GM6 and GM9, but significantly different (P≤ 0.05) between them and genotypes GM5 and GM34, and also significant (P≤0.05) different between genotypes GM5and GM34 was observed. These results are in conformity with the values ranging from 0.01% to 0.1% reported by Eldaw, (1998).
(iii) Potassium
Table (3) shows that the potassium content of guar gum samples extracted from the four guar genotypes was found to be 0.20%, 0.30%, 0.27% and 0.20% for GM5, GM6, GM9, and GM34 respectively. It is observed that the variation in potassium content did not shows significant (P≥0.05) difference between genotypes GM5 and GM34, but significant (P≤0.05) difference between them and genotypes GM6 and GM9, and also significant (P≤0.05) difference between genotypes GM9and GM6. These results are lower than the values of 0.70% to 0.95% reported by Eldaw, (1998).
Table (3). Shows the mineral composition (Macro elements) of guar gum from four genotypes:
| Genotype | P (%) | Na (%) | K (%) | Ca (%) | Mg (%) |
| GM5 | 0.0171b(±0.0005) | 0.019 c(±0.0008) | 0.20c(±0.00) | 0.35a(±0.02) | 0.09a(±0.003) |
| GM6 | 0.0075d(±0.0004) | 0.023a(±0.0016) | 0.30a(±0.02) | 0.20b(±0.00) | 0.06b(±0.00) |
| GM9 | 0.0202a(±0.001) | 0.024a(±0.0008) | 0.27b( ±0.04) | 0.20b(±0.008) | 0.06b(±0.00) |
| GM34 | 0.0167c(±0.0012) | 0.021b(±0.002) | 0.20c(±0.008) | 0.20b(±0.0003) | 0.09a(±0.002) |
| L.S.D | 0.0041 | 0.002 | 0.03 | 0.025 | 0.0034 |
| C.V % | 4.39 | 7.1 | 7.99 | 7.03 | 2.09 |
| S.E± | 0.0008 | 0.0004 | 0.006 | 0.0048 | 0.00064 |
*Means not sharing a common letter in the same column are significantly different (P≤0.05).
*Each values in the Table is a mean of three replicates ±S.D
(iv) Calcium
As can be shown from Table (3) the values of calcium content of guar gum extracted from the four guar genotypes were 0.35% for GM5, 0.2% for GM6, GM9 and GM34 respectively .It is observed that the variation in calcium content is insignificant (P≥0.05) among genotypes GM6, GM9 and GM34, but significant (P≤0.05) difference between them and GM5 was noticed. The values of calcium contents of guar gum extracted from genotype GM5 is in conformity with the values of 0.30% to 0.37% obtained by Eldaw, (1998), but the values of genotypes GM6, GM9 and GM34 were lower than the values reported by the same author. The value of calcium content of guar gum extracted for genotypes GM6 and GM9 is in conformity with the values of 0.0295% to 0.0440% reported by Eldaw, (1998).
(v) Magnesium
Table (3) shows the magnesium content of guar gum extracted from different genotypes was found to be 0.09% for (GM5 and GM34) and 0.06% (for GM6 and GM9).It is found that there is no difference in magnesium content for genotypes GM5 and GM34, also no variation between genotypes GM5 and GM9, but significant (P≤0.05) difference between genotypes GM5 and GM34 (from one side) and genotypes GM9 and GM34 (on other side) was observed. These results are lower than the value (0.11%) reported by Eldaw, (1998). The variation in the macro-elements contents may be attributed to genetic variation or environmental factors.
3.9.2. Micro Elements Content
(i) Iron (PPM)
Data in table (4) shows that the iron content of guar gum, was found to be 0.435, 0.211, 0.177, and 0.301(ppm) of GM5, GM6, GM9 and GM34 of genotypes respectively. It is observed that the variation in the iron content is significant (P≤0.05) among all genotypes. These results are higher than the values ranged from 0.0526 to 0.1118 (ppm) as reported by Eldaw, (1998).
(ii) Zinc (PPM)
Table (4) shows what the zinc content of guar gum was found to be 0.274, 0.0428, 0.0371, and 0.1669 (ppm) of GM5, GM6, GM9 and GM34, of guar genotypes respectively. It is observed that, the variation in the zinc content is significant (P≤0.05) between all the genotypes, the highest values were of GM5, GM34, GM6 and the lowest was of GM9.
(iii) Lead (PPM)
Table (4) shows that the lead content of guar gum extracted from four genotypes GM5, GM6, GM9 and GM34, was found to be 0.00308 , 0.00547 , 0.00239 , and 0.00196 (ppm) respectively. It is observed that the variation in lead content is insignificant (P≥0.05) difference between genotypes GM9 and GM34, but there is a significant (P≤0.05) difference between them, and genotypes GM5 and GM6. Lead content of GM5 is comparable to the values ranged from 0.003 to 0.0038 (ppm) obtained by Eldaw, (1998), and as well as Sudanese standard of guar gum powder obtained by the Sudanese Guar Co. (2008) which read the maximum level of lead content in guar gum as 20 (ppm). The variation in the micro elements content of guar gum may be attributed to the genetic variation.
Table (4). Minerals content of guar gum (micro-elements):
| Genotype | Fe (ppm) | Zn (ppm) | Pb (ppm) |
| GM5 | 0.435a(±0.0014) | 0.2741a(±0.004) | 0.00308b(±4.9×10⁻⁶) |
| GM6 | 0.2109c(±0.0017) | 0.0428c(±0.0006) | 0.00547a(±0.0001) |
| GM9 | 0.1774d(±0.0007) | 0.0371d(±0.0002) | 0.00239c(±0.0007) |
| GM34 | 0.3007b(±8.0×10⁻⁵) | 0.1669b(±0.0025) | 0.00196c(±8.5×10⁻⁵) |
| L.S.D | 0.017 | 0.0053 | 0.00068 |
| C.V % | 3.98 | 2.7 | 13.8 |
| S.E± | 0.0032 | 0.001 | 0.0001 |
*Means not sharing a common letter in the same column are significantly different (P≤0.05).
*Each value in the Table is a mean of three replicates ± S.D.
3.10. Functional Properties of Guar Gum
3.10.1. Water Holding Capacity (WHC) (%)
As shown in Table (5) the levels of water holding capacity (WHC) of guar gum extracted from genotypes GM34, GM5, GM9 and GM6,was found to be 88.97%, 81.67%, 79.02% and 58.84%, respectively. It is observed that the variation in the (WHC) level has significant (P≤0.05) difference between all genotypes, the highest values were shown by GM34, GM5, GM9 and the lowest by genotype GM6. The variation in the level of water holding capacity of guar gum may be attributed to genetic variation.
Table (5). Functional Properties of Guar Gum:
| Genotype | Water holding Capacity (%) | Emulsifying Stability (ES) | Foaming Capacity (%) |
| GM5 | 81.67b(±5.5) | 0.9b(±0.02) | 27.78a(±2.5) |
| GM6 | 58.84d(±4.5) | 1.06a(±0.05) | 26.0a(±0.62) |
| GM9 | 79.02c(±5.11) | 0.86b(±0.02) | 26.42a(±0.32) |
| GM34 | 88.97a(±5.4) | 1.02a(±0.02) | 27.94a(±0.8) |
| L.S.D | 6.68 | 0.053 | 1.87 |
| C.V % | 15.02 | 3.73 | 4.56 |
| S.E± | 3.3 | 0.01 | 0.36 |
*Means not sharing a common letter in the same column are significantly different (P≤0.05).
*Each value in the Table is a mean of three replicates ± S.D.
3.10.2. Emulsifying Stability (E.S)
Table (5) shows that the value of emulsifying stability of guar gum, was found to be 0.9, 1.06, 0.86 and 1.02 for GM5, GM6, GM9 and GM34 of genotypes, respectively. It is observed that the variation in the value of (E.S) is insignificant (P≥0.05) between genotypes GM6 and GM34, and also insignificant (P≥0.05) between genotypes GM5 and GM9, but a significant (P≤0.05) difference between genotypes GM6 and GM34 from one side (which gave highest values) and genotypes GM5 and GM9 on the other side (which gave lower values) was noticed. The variation in the values of E.S of guar gum may be attributed to genetic variation.
3.11. Foaming Properties
3.11.1. Foaming Capacity (FC) (%)
Table (5) shows that the values of foaming capacity of guar gum, was found to be 27.78%, 26.0%, 26.42% and 27.94% for GM5, GM6, GM9 and GM34 guar genotypes, respectively. It is observed that the variation in the values of foaming capacity is insignificant (P≥0.05) between all guar gum genotypes.
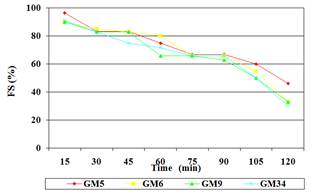
Fig (1). Foam Stability of Guar Gum:
3.11.2. Foam Stability (%)
Fig (1) shows the foam stability (F.S) of guar gum solution, to follow the curve the results after 15 min are shown highest of all samples reaching 50% of its values after 105 min; this indicates highest stability of foam of guar gum solution.
4. Conclusion
The genotype GM5 has the best physical and chemical properties of guar seeds, while genotype GM34 has the best functional properties of guar gum. The genetic variations have affected the chemical composition, physical and functional properties of guar gum. The Foaming Capacity (FC) is not high, but the values of foam stability (FS) were highest of guar gum.
References
- Ahrens, F.,Pfeuffer, M., Hagemeister, H. and Barth, C.A. (1991). "The hyochdesterolemic effect of guar gum depends on dietary sucrose studies in minipigs". Zeitschriftfur-Ernahrungswissenschaft.30 (2):109-117.
- AOAC, (1995). Association of Official Analytical Chemists. Official Method of Analysis, edn. Washington D.C
- AOAC. (1984). "Official Methods of Analysis". 14th edition.Published by AOAC Inc. Virginia 22209. USA.
- Boggs, A.D. (1949). Viscosity relation of amylase and amylopectin guaran. M.Sc.Thesis,Purdue University. West Lafayette. Indiana.
- Chopra, R.N., Nayer, S. L and Chopra, I.C. (1956). Glossary of Indian Medical Plants. Ranchi: Catholic Press.
- Chudzikowski, R.J. (1971). Guar gum and its application. J. Soc. Cosmet. Chem. 22:43-60.
- Dickinson, E. (2003) .Hydrocolloids at interface and influence on the properties of dispersed system. J.Food hydrocolloids, 17:25-39.
- Eatherton, L, E., Platz, P.E and Cosgrove, F.P. (1955). Guar Gum as binder and disintegrator for certain compressed tablets. Drug Stand. 23:42-47.
- Eldaw, G.E. (1998). A study of guar seed and guar gum properties (Cyamopsis tetragonoloba (L). M.Sc Thesis, Faculty of Agriculture, U of K, Sudan.
- Flowerman, P.M. (1987). The Potential of guar in Sudan agriculture, process, industry and trade. Unpublished report on a mission to Sudan,19th March-30th June.
- Hansen, J. R. (1978). Functional properties of Gum Arabic. J.Agric. Food, Chem, 26:301-304.
- Kabirullah, M. and Wills, R.B. (1982). Functional properties of acetylated and succinylated sun flower protein,J. Food technology.17:235-249.
- Kinsella, J. E (1979). Functional properties of Soy Proteins. J.Amer. Oil chem. Soc., 56: 242-246.
- Londin, K., Holm, G., Tengborn, L. and Smith, U. (1992). Guar gum improves insulin sensitivity, blood lipids, blood pressure and fibrinolysis is healthy men. American Journal of Clinical Nutrition.56(6): 1061-1065).
- Mantella, C. L. (1965).The water soluble gum. Harfner, inc .New York, USA.
- Pearson, D. (1981). Chemical Analysis of Food. Edn. Published by Egon, H; Kirk, R.S and Sawyer, New York.
- Peterson, R. G. (1985). Design and analysis of experiments. March Dekker Inc., New York, PP: 429.
- Sabah Elkhier, M. K. (1999). Improvement of yield and quality of Guar (Cyamopsis tetragonoloba). PhD. Thesis, Faculty of Agriculture, U of K,Sudan.
- Sharma, B. R; Chechani, V., Dhuldhoya, N.C. and Merchant, U. C. (2007). "Guar Gum" J. Science Tech Entrepreneur. Lucid Colloids Limited, Jodhpur-342005, Rajasthan, India.
- Vuorinen, M. H, Sinisalo, M. and Koivisto, V. N. (1992). Guar gum insulin-dependent diabetes:effects on glycemic control and serum lipoprotein. American Journal of Clinical Nutretion. 25(6): 1056-1060.
- Whistler, R. L (1954). Guar gum, Locust bean gum and others. Adc. Chem. Ser.11:45- 50.
- Whistler, R. L and Hymowitz, T. (1979). Guar Agronomy, Production, Industrial Use, and Nutrition. Purdue University Press. West Lafayette, Indiana,USA.
- Whistler, R. L and Smith, C.C. (1952). Acrystalline mannotriose from the enzymatic hydrolysis of guaran. J. Am. Chem. Soc. 74: 3795-3796.


