
American Journal of Food Science and Health, Vol. 1, No. 1, April 2015 Publish Date: Apr. 8, 2015 Pages: 21-26
Evaluation of Phytochemical Compositions and Microbial Load of Raw and Traditionally Processed Ricinus communis Seed (Ogiri)
Nnenna E. Okoronkwo1, *, Isabel C. Emeh1, Elendu C. Onwuchekwa2
1Department of Pure and Industrial Chemistry, Abia State University, Uturu, Nigeria
2Department of Microbiology, Abia State University, Uturu, Nigeria
Abstract
The phytochemical compositions and microbial load of the raw and traditionally processed Ricinus communis (castor oil – ogiri seeds) for different days were evaluated. The results revealed the presence of alkaloids, saponins, flavonoids, tannin and phenols. It was observed that the alkaloid value for both the cooked and raw samples were highest for cooked with a value of 42+0.01%, and that of raw, 44±0.13; while the phenolics contents were lowest for cooked, 1.24±0.01% and raw, 1.25±0.06%. However, the phytochemical contents of the samples were observed to decrease after cooking and subsequent fermentation from day 1 to day 5 of the seeds. It was also observed that among the isolated microorganisms, Basillus substillis and Salmonella Shigella dysenteria which increased highly as fermentation was left for more days were the predominant organisms. Therefore, since Salmonella Shigella dysenteria causes food poisoning and infection, it is recommended that efforts should be made to employ good hygienic condition during processing of castor oil seed traditionally, otherwise called ogiri. More so, the ogiri should be best taken after two days of fermentation since the microbial load increases highly from the third day which renders it unfit for consumption.
Keywords
Castor Oil Seed, Fermentation, Microorganisms, Phytochemicals, Deterioration
Received: March 20, 2015
Accepted: April 3, 2015
Published online: April 6, 2015
@ 2015 The Authors. Published by American Institute of Science. This Open Access article is under the CC BY-NC license. http://creativecommons.org/licenses/by-nc/4.0/
Contents
1. Introduction 2. Materials and Methods 2.1. Qualitative Screening for the Phytochemical Composition 2.2. Test for Alkaloids 2.3. Test for Phenols 2.4. Test for Saponin 2.5. Test for Flavonoid 2.6. Test for Tannins 2.7. Quantitative Tests for the Phytochemicals 3. Microbial Analysis/Microbial Load 3.1. Characterization and Identification of Isolates 3.2. Biochemical Tests 3.2.2. Citrate Test 3.2.3. Coagulase Test 3.2.4. Indole Test 3.2.5. Gelatin Test 3.2.6. Gram Test 4. Results and Discussion 5. Conclusion
1. Introduction
Ogiri is usually added as a condiment in soup and other traditional foods such as African salad. One of the seeds usually used for the preparation of such condiments is Ricinus communis (castor oil) seed called ogiri seeds. Ricinus communis (castor oil) seed belongs to the family of euphorbiaceae. It is a tropical plant which is distributed widely across the world. The seed is oval, shiny bean like highly poisonous [1]
The common traditionally method of processing or preparation involves dehulling, cooking or boiling and draining of the seeds. The seeds are cooked for about 8 – 9 hours during boiling, most water soluble nutrients get lost as a result of leaching as heat induced faster rate and thermal degradation [2]. After cooking or boiling, it is wrapped either in plantain leaves or banana leaves to ferment. Fermented ogiri seed contains high amount of protein [3]. Fermentation helps in the conversion of sugar and other carbohydrate to usable end products. The traditional fermentation of food serves various functions which include enhancement of diet through development of flavour, aroma and texture, preservation: enhancement of shelf life and food quality, detoxification of anti-nutrient and decrease in cooking time [4]. Fermentation of the seeds is normally uncontrolled which result to the very short shelf life of most locally prepared food that leads to product deterioration and spoilage which is witnessed in the form of organoleptic changes in color, texture, odor and taste [5].
Therefore, this work evaluated the phytochemical composition of the fresh and processed samples as well as the microbial load of the traditionally processed ogiri samples as the number of days increases.
2. Materials and Methods
The sample used in this research was obtained from Orie Ngodo Market in Isuochi, Abia State, Nigeria. The seeds were dehulled and divided into seven portions, some of which were wrapped with plantain leaves and were cooked for about nine hours and drained. They were then stored for further laboratory analysis.
2.1. Qualitative Screening for the Phytochemical Composition
The qualitative tests were carried out on the individual sample in order to indicate or confirm the presence of the phytochemicals. 5.0 g of sample was soaked with 100 ml of distilled water in a beaker. It was allowed to stand for 24 hrs, and then filtered; the filtrate was used for phytochemical screening.
2.2. Test for Alkaloids
3 ml of each extract was stirred with 5 ml of 10% aqueous hydrochloric acid on hot water bath. The content were filtered and divided into three portions of 1 ml each in test tubes. To the first portion, few drops of Dragendoff’s reagent were added and occurrence of orange red precipitate indicates the presence of alkaloids. To second portion was added few drops of Wagner reagent and a reddish brown precipitate indicates the presence of alkaloid while to the third portion, few drops of Mayer reagent were added and appearance of buff precipitate indicates the presence of alkaloid [6].
2.3. Test for Phenols
To 2 ml of ethanolic extract of the powdered sample was added to 3 ml of water in a test tube. To this was added 2 drops of 1% ferric (III) chloride solution. The appearance of red, blue, green (blackish or purple colour indicated the presence of phenols [6].
2.4. Test for Saponin
5 g of crude powder of the seed was shaken vigorously with 10 ml of distilled water in a test tube and was warmed in a water bath for 5 minutes and later shaken for observance of frothing. The persistent of froth indicates the presence of saponins. The frothing was mixed with 3 drops of olive oil and observed for the formation of emulsion which confirmed the presence of saponin [7].
2.5. Test for Flavonoid
To 2 ml of each extract in a test tube was added 10% of sodium hydroxide solution. Appearance of yellow colouration indicated the presence Flavonoids. Other methods used were Schinoda’s test, ferric chloride test [6], lead acetate test [8].
2.6. Test for Tannins
Small quantity of the extract was mixed with distilled water and heated on a boiling water bath. The mixture was filtered and to the filtrate few drops of conc. H2SO4 and 5% ferric chloride were added, precipitate indicated the presence of tannins [6]. Other methods used in the test were lead acetate test and ammonia solution test.
2.7. Quantitative Tests for the Phytochemicals
Standard methods of analysis were used for the determination of phytochemicals confirmed from the qualitative screening test. The alkaloid, saponin and phenol determinations were done according to the method of [9]. Tannin determination was done by the method of [10] and flavonoid determination was carried out according to the method of [11].
3. Microbial Analysis/Microbial Load
3.1. Characterization and Identification of Isolates
One gram of each sample was thoroughly mashed with laboratory pestle and mortar and mixed with 9 ml of distilled water as diluents in McCartney bottle and the content was thoroughly shaken. Subsequent serial dilutions (10-2, 10-3, 10-4, 10-5, 10-6, and 10-7) were made from the solution by adding serially 1 ml of solution from preceding concentration to 9 ml of the diluents using sterile syringe. Some media like nutrient agar (NA), Mac-Conkey, potato dextrose agar were prepared and poured in a plate and labelled appropriately. The total bacterial count was determined using standard plate count (SPC) as described by APHA, 1985. Bacterial isolates were characterized on the basis of biochemical characteristics, colonial morphology and cellular morphology. The tests were carried out as described by [12]) and isolates were identified according to [13].
3.2. Biochemical Tests
3.2.1. Catalase Test
The presence of catalase in the test is detected using hydrogen peroxide; if the bacteria possess catalase (catalase positive) when a small amount of bacteria isolates is added to hydrogen peroxide, bubbles of oxygen are observed. The catalase test was done by placing a drop of hydrogen peroxide on a microscopic slide using a sterile loop; the colony was then smeared into the hydrogen peroxide drop, if the mixture produces bubbles in froth, the organism is said to be catalase positive. Catalase positive organisms include Staphylococcus, Salmonella shigella, and Bacillus substillis [14].
3.2.2. Citrate Test
The different bacteria isolates were streaked with an inoculation loop into Simon citrate agar plate. The plate was inverted and incubated for 24 hours at 37oC; a colour change from green to blue indicated a positive result.
3.2.3. Coagulase Test
On a clean grease free slide, a pencil mark was made with sterile wire loop; the normal saline was collected and placed on each marked part. The colony from the cultured plate was collected with a sterile wire loop and smeared on the slide as a drop of human plasma was added and stirred for 5 seconds and was observed. A cloth of blood plasma at the second suspension indicates positive results. Coagulase is a protein enzyme produced by several microorganisms that enables the conversion of fibrinogen to fibrin. It is used to differentiate different types of Staphylococcus isolate importantly Staphylococcus aureus is generally coagulase positive [15].
3.2.4. Indole Test
The indole test is a biochemical test performed on bacteria species to determine the ability of the organism to convert tryptophan into the indole. Indole can be produced by bacteria as a degradation product of the amino acid tryptophan. It occurs naturally in human faces and has an intense fecal odor and flowery smell at low concentration. It determines a microorganism positive or negative to indole. To perform this test colonies from the culture plate were picked into the bijorus bottle content, 2 drops of KOVAC’s reagent was added. The mixtures was shaken and allowed to settle for 10 minutes. A deep red colour developing almost immediately in the upper indicated a positive rest [16].
3.2.5. Gelatin Test
The gelatin hydrolysis test detects the ability of bacteria to produce gelatinases. This test aids in the identification of Pseudomonas, Staphylococus aureus, and Bacillus subtillis. This test was performed by transferring aseptically pure cultures to a sterile test tube of nutrient gelatin, the inoculated tube was incubated at 35oC - 37oC for 24 hours and the result determined. It was placed in a refrigerator; if the gelatin digests, the medium will fail to solidify after refrigeration but if present, will solidify upon refrigeration [17].
3.2.6. Gram Test
A heat fixed smear of the test organism was made on a clean, grease-free glass slide, and then flooded with crystal evident solution for one minute. This was washed under running tap, and then flooded with grains of iodine solution for one minute. The slide was washed with tap water then decolorized drop wise with 95% alcohol for 30 seconds, the slide was again washed with tap water before applying safari for another 30 seconds; after this the slide was washed with water and air dried. A drop of immersion oil was added and the slide viewed under the light microscope with a magnification of x 100.
4. Results and Discussion
Table 1. Result of the qualitative analysis of the various samples
| Phytochemicals | Test reagents | fresh | cooked | Day 1 | Day 2 | Day 3 | Day 4 | Day 5 |
| Alkaloid | Dragendoff’s | + | + | + | + | + | + | + |
| Wagner’s reagent | + | + | + | + | + | + | + | |
| Mayers reagent | + | + | + | + | + | + | + | |
| Saponins | Frothing test | + | + | + | + | + | + | + |
| Flavanoids | Shinoda’s test | + | + | + | + | + | + | + |
| Ferric Chloride | + | + | + | + | + | + | + | |
| Leadacetate | + | + | + | + | + | + | + | |
| Sodium Hydorxide | + | + | + | + | + | + | + | |
| Tannins | Lead acetate | + | + | + | + | + | + | + |
| Ammonia solution | + | + | + | + | + | + | + | |
| Ferric Chloride | + | + | + | + | + | + | + | |
| Phenols | Ferric Chloride | + | + | + | + | + | + | + |
The results of the qualitative and quantitative analysis of the phytochemical compositions of the fresh and various processed samples are shown in Tables 1 and 2 respectively. The qualitative phytochemical screening results of the different samples of Ricinus communis seed (ogiri) Table 1 showed that the presence of alkaloids, flavonoids, tannins, saponins and phenols in samples.
The quantitative analysis results of the various samples revealed appreciable amount of the phytochemicals. It was observed that the phytochemicals were generally higher in the fresh seed sample which kept decreasing from the cooked samples and as day of fermentation increases. For instance, alkaloid which recorded the highest in fresh seed decreased from 44.00±0.03 to 26.00±0.10 at the 5th day of fermentation. This decrease in phytochemicals is attributed to the fact that during cooking and subsequent fermentation, some of the nutrients are reduced which is in line with the findings of [4]. The fresh seed proved poisonous from high amount of phytochemicals which are detoxified on fermentation after boiling [18,19]. On fermentation the bean produce typical aroma and flavour due to volatile compounds produced by the fermenting microorganism in the course of their metabolism [20].
Table 2. Result of the Percentage Composition of the Phytochemical analysis of the various samples
| Phytochemical % Compositions | fresh | cooked | Day 1 | Day 2 | Day 3 | Day 4 | Day 5 |
| Alkaloid | 44.00±0.03 | 42.00±0.01 | 39.00±0.04 | 37.00±0.07 | 32.50±0.01 | 33.00±0.05 | 26.00±0.10 |
| Saponins | 3.00±0.03 | 3.00±0.03 | 3.00±0.03 | 2.50±0.02 | 1.00±0.05 | 1.00±0.05 | 0.50±0.02 |
| Flavanoids | 22.00±0.01 | 15.00±0.02 | 9.50±0.05 | 7.50±0.01 | 7.50±0.01 | 7.00±0.04 | 6.50±0.02 |
| Tannins | 2.12±0.02 | 2.11±0.01 | 2.09±0.02 | 1.25±0.02 | 2.08±0.02 | 1.26±0.02 | 1.29±0.06 |
| Phenols | 1.25±0.07 | 1.24±0.01 | 1.23±0.04 | 1.21±0.01 | 1.99±0.06 | 1.25±0.06 | 1.79±0.01 |
The pH and temperature observed during the course of the experiment (Figs. 1 and 2) revealed that pH was very high between the first and second day and that of temperature was highest at the second day of fermentation. The pH increased from beginning of fermentation and then decreased which is in line with the findings of [21]. The rise in pH has been attributed to the abundant production of amino acid during the fermentation due to protein hydrolysis and deaminase activity. Also the increase in pH encourages the growth of Bacillus sp.
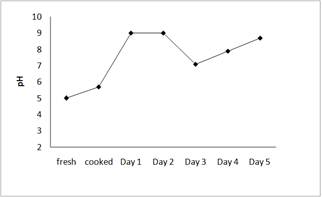
Fig. 1. Plot of the pH observed from the various samples during Fermentation Process as the day increases
Temperature too was observed to increase initially within the first 24 – 48 hrs of fermentation which decreased gradually afterwards. This is in agreement with the observation of [22]. The initial rise in temperature has been attributed to the intense metabolic activities of the microorganisms i.e. period of maximum microbial activity which represents the most active and important period of fermentation that has been shown by enzymatic studies that the alpha amylase, proteolytic and lipolyptic enzyme activities attain their maximum levels at 24 – 26 hours of fermentation.
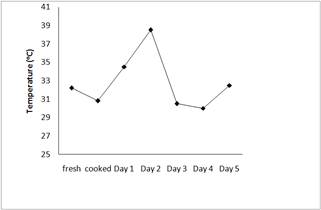
Fig. 2. Plot of the Temperature (oC) observed of the various samples during Fermentation Process as the day increases
The colony characteristics of isolates from the various samples are shown in Table 3 and the result of the biochemical and morphological characteristics of isolated organisms from the samples in Table 4. It was observed that Bacillus substilis and Salmonella shigella dysenteria were the most predominant organisms of all the microorganism isolated. This is because of the increase in pH and temperature which is in line with the finding of [21]. The entire organisms isolated were bacteria. Also the bacteria count of the microorganisms isolated showed that the Bacillus substilis was the highest which does not have any health risk on human. Bacteria such as Escherichia coli, Staphylococcus aureus and Salmonella shigella Dysenteria are capable causing food infection and poisoning. E. coli and Staphylococcus aureus were moderate from the result while Salmonella shigella Dysenteria was high and when subcultured was throughout the media. It is believed that since the preparation of the delicacy or addition as condiment to soup involves heating, they will be eliminated or highly reduced during the cooking process. However, for some other food preparations that do not involve heating or pre-heating before addition of the condiments, such will pose health risk. E. coli and Staphylococcus aureus decreased with increase in the number of days of fermentation. This may be attributed that the fact that the environment was not suitable or favourable for their growth, especially with increasing pH during fermentation.
Table 3. Result of the bacterial count in the various samples at different days
| Parameter\Samples | fresh | cooked | Day 1 | Day 2 | Day 3 | Day 4 | Day 5 |
| Pseudomonas aruginosa | 69 | 58 | 40 | 31 | 28 | 10 | 5 |
| Bacillus substillis | 1083 | 2000 | 2056 | 2068 | 3528 | 3682 | 4000 |
| Lactobacillus | 160 | 72 | 68 | 50 | 32 | 29 | 12 |
| Salmonella shigella Dysenteria | 864 | 906 | 1024 | 3068 | uncountable | uncountable | uncountable |
| Staphylococcus aureus | 65 | 59 | 48 | 25 | 16 | 14 | 8 |
| Escherichia coli | 72 | 69 | 50 | 20 | 18 | 10 | 3 |
Table 4. The Result of the Biochemical and Morphological Characteristics of Isolated Organism from the various Samples
| Probable Organism present | Indole | Gelatin | Coagulase | Catalase | Mortility | Spore Location | Gram stain |
| Bacillus substillis | - | + | NA | + | + | Central spore | + |
| Salmonella Shigella Dysenteria | - | - | NA | + | + | Central spore | + |
| Lactobacillus fermenti | - | + | NA | - | - | - | + |
| Staphylococcus aureus | - | + | - | + | - | - | - |
| Escherichia coli | + | - | - | - | + | - | - |
| Pseudomonas aruginosa | - | - | - | - | + | - | - |
5. Conclusion
The traditionally processed Ricinus communis seed (Ogiri) was found to contain phytochemicals which decreased after cooking and subsequent fermentation. The results of this work showed that the condiment should be best consumed within the first 2 days of preparation after which the microorganism activity will increase of which Salmonella shigella Dysenteria was found to be too high as the number of days of fermentation increases which could pose health problems. Salmonella shigella Dysenteria causes food poisoning and infection. Therefore, efforts should be made to employ good hyginenic conditions and preservation methods during the processing and preparation of the condiment.
References
- Bentley, R. and Trimen,. H. (1983). Medicinal Plants. Agency and International Book Distribution, Vol 4. Delhi, Taj Offset,
- Fox, B. J. and Cameron, E. E. (2000). Processing and Utilization of Some Nigeria Food Condiments. Food Science p. 428
- Okechukwu, R. I., Ewelike N., Ukaoma A. A. and Emjula A. (2012). Changes in Nutrient Composition of Castor Oil Subjected to Solid State Natural Fermentation. Journal of Applied Bioscience, pp. 3591 – 3595
- Onwuliri, V. A., Attah, I. And Nwankwo, J. O. (2004). Anti-nutritional factors, essential and non-essential fatty acids composition of Ugba (Pentaclethra macrophylla) seeds at different stages of processing and fermentation. J. Biological Sci., 4: 671-675.
- Mbata, T. and Orji, M. U. (2008). Process optimization in the production and preservation of Ugba, a Nigerian fermented food. Int. J. Microbiol., 4: 2-6.
- Evans, W. C. (2003). Trease and Evan’s Pharmacognosy. 15th Ed., London, UK WB Saunders Company Ltd
- Harbone, J. B. (1973). Phytochemical Method, a Guide to Modern Techniques of Plant Analysis. New York: Chapman and Hall.
- Brain, K. R. and Turner, T. D. (1975). The Practical Evaluation of Phytopharmaceutical Wright Scientechnica Bristol pp. 81 - 85
- Obadoni, B. O. and Ochuko, P. O. (2001). Phytochemical Studies and Comparative Efficacy of the Crude Extracts of some Homostatic Plants in Edo and Delta States of Nigeria. Global J. Pure Appl. Sci. 8b: 203 - 208.
- Van Burden, T. P. and Robinson W. C. (1981). Formation of Complexes between Protein and Tannin Acid. J. of Agricultural Food Chemistry. USA, pp. 77 – 99.
- Boham, B. A. and Kocipal-Abyazan, R. (1974). Flavonoid and Condensed Tannins from Leaves of Hawaiian Vaccincum vaticulatum and V. calycinium. Pacific Science USA, pp. 458 – 463.
- Joklit W. K., Willet H. P. and Amos D. B. (1993). Zinsser Microbiolgy 5th edition, California Appetorsand Long
- Buchanan, R. E. and Gibbons N. E. (eds) (1974). Bergey's manual of determinative bacteriology. 8th Edition. Williams & Wilkins Co. Baltimore, MD 1246 p.
- Rollins, D. M., Temenak, J. J., Shields, P. and Joseph, S.W. (2003). Microbial Pathogenesis Laboratory Manual. 2nd Edition, Published & Available Online.
- Ryan, K. J. and Ray, C. J. (2004). Sherris Medical Microbiology. 4th edition. New York: McGraw- Hill.
- Nelson, D. L. and Cox, M. M. (2005). Lehninger Principles of Biochemistry, (4thed.), New York: W. H. Freeman and Company.
- Harley, J. P. (2005). Microbiology Laboratory Exercise 6th edition. New York: McGraw-Hill.
- Richard, K. D. (2008). Protective Functions of Phytochemicals. J. Plant Food pp 46 – 86.
- Wedin, G. P. (2001). Castor Oil Beans Poisoning. American Journal of Emergency Medicine, pp. 259 – 261.
- Kubut, N. O, Uzuegbu, J. O., Ubbaonu, C. N. and Onyeka, E. U. (2007). Effect of Chemical Compounds Produced by Microorganims on Organoleptic Properties of Ogiri (Ricinus communis) during fermentation. Proceedings of Annual Conference of Nigeria Institute of Food Science and Technology Abuja, pp 175 – 178
- Odunfa H. (1985). Microbiological Study of Ogiri Fermentation, a Nigeria Indigenous Fermented Food Flavour. J. Plant Foods, pp. 155 – 163.
- Njoku, H. O. and Okemmadu, C. P. (1989). Biiochemical Changes during the Natural Fermentation of Castor Oil Bean for the Production of Ogiri. J. Sci Food Agric, pp. 457 – 465.


