
International Journal of Environmental Planning and Management, Vol. 2, No. 4, August 2016 Publish Date: Aug. 5, 2016 Pages: 36-44
A Factorial Study of Renewable Energy Technology in Nigeria
Igboanugo A. C.1, Kwasi-Effah C. C.2, *, Ogbeide O. O.1
1Department of Production Engineering, University of Benin, Benin City, Nigeria
2Department of Mechanical Engineering, University of Benin, Benin City, Nigeria
Abstract
Despite the fact that renewable energy is an important and abundant source of energy in Nigeria, it has attracted neither the requisite level of investment nor tangible policy commitment. The development of policy by government in favor of renewable energy development has a direct bearing with optimal development of its resources. Although the energy reforms and national resources allocated to developing and disseminating renewable energy in the last decades may appear substantial, but the total amount is still insignificant compared to that allocated to the conventional energy sector that service less than 40% of the population. The success of renewable energy technologies has been limited by a combination of factors which include: poor integrated institutional framework; inadequate policy implementation; lack of co-ordination and linkage in renewable energy programmes; pricing distortions which have placed renewable energy at a disadvantage; high initial capital costs of insulation; weak technology dissemination strategies; lack of skilled manpower; poor baseline information on location and weak maintenance service and infrastructure. This paper utilizes a factorial approach to reduce multi-dimensional variables involved in the contemporary issues concerning renewable energy technology in Nigeria. Results showed that renewable energy policy structure, government attitude, clean energy goals, youth empowerment through renewable energy, energy conservation and modus vivendi are critical factors to be considered in order to facilitate renewable energy development in Nigeria.
Keywords
Renewable Energy, Factorial Analysis, Variables, Government, Policy Development
Received:June 29, 2016
Accepted: July 17, 2016
Published online: August 5, 2016
@ 2016 The Authors. Published by American Institute of Science. This Open Access article is under the CC BY license. http://creativecommons.org/licenses/by/4.0/
Contents
1. Introduction 1.1. Energy Situation in Nigeria 1.2. Renewable Energy Sources in Nigeria 2. Factor Analysis 2.1. Factor Model 2.2. The Model for Individual Subjects 3. Measurements 3.1. Data Matrix 3.2. Correlation Matrix 3.3. Communalities 3.4. Varimax Rotated Factor Loading 4. Discussion of Results 5. Conclusion and Recommendations
1. Introduction
Nigeria is blessed with abundance of renewable and non-renewable energy resources. However, the National energy supply of Nigeria is majorly dependent on the non-renewable fossil fuel [1]. The present dependence on fossil fuel is not enough to meet the energy needs of the country. Interest in renewable energy development and dissemination in Nigeria is driven by the increase in oil prices, unavailability of electricity to majority of the population as well as high cost and energy losses associated with grid extension [2]. The government has made effort through her several power reform programmes and policies to attract private participation, thus encourage renewable energy development. However, there are hindrances, mainly due to the technical and financial barriers, that need to be overcome for this to be a reality. Thus, the ultimate solution to Nigeria’s low power production capacity may not be achievable in the nearest future from a single source of energy, but the culmination of several energy sources [3]. Renewable energy technology has an enormous potential in Nigeria which can maximally be included in our energy mix. Popular perception of renewable energy in Nigeria tends to focus on solar energy and sometimes wind power and biofuel.
1.1. Energy Situation in Nigeria
Nigeria currently generates about 3,920 MW with per capita power capacity of 28.57 Watts and this is grossly inadequate even for domestic consumption. For Nigeria to meet up its energy needs, it requires per capital power capacity of 1000 Watts or power generating capacity of 140,000 MW as against the current capacity of 3,920 MW [4].
Nigeria energy consumption is dominated by fuel wood (50.45%); petroleum products (41.28%) and hydro electricity (8%). Coal, Nuclear, geothermal, tidal, wind and solar energy are currently not part of Nigeria’s energy mix, as they have either been neglected or are currently at their early stage of development [5]. The energy utilization pattern in Nigeria can be grouped into industry, transport, commercial, household and agricultural sectors. The rural areas are generally inaccessible due to absence of good road networks, even with the ongoing power reform and privatization of the electricity industry; it is obvious that for logistic and economic reasons, rural areas which are remote from the grid and/or have low power purchase potential will not be attractive to private power investors. Meanwhile electricity is required for basic developmental services as well as economic growth. The absence of reliable energy supply has left the rural populace socially backward and their economic potentials untapped [6].
The transport sector is another consumer of oil accounting for 60% of total consumption. Despite the vast oil and gas reserves; small amount is used in Nigeria. The country imports more than 70 percent of domestic fuel requirements because none of our refineries have functioned efficiently. The high oil import bill exposes Nigeria’s energy sector to the external energy price shocks. Nigeria has the 9th largest natural gas reserve in the world and exports large quantities of liquefied natural gas (LNG) to other countries, but her gas-dominated electricity grid still experiences frequent collapse due to inadequate gas supply and obsolete infrastructures. For Nigeria to meet up with its energy needs, it must look for alternative energy source especially for the rural populace. While it is recognized that renewable energy cannot solve all of Nigeria’s energy problems, renewable energy technology is still seen as having a significant unexploited potential to enable the countries to meet their growing energy requirements.
1.2. Renewable Energy Sources in Nigeria
1.2.1. Hydro Energy
Nigeria is endowed with large rivers and natural falls. Small rivers and streams also exist within the present split of the country into eleven River Basin Authorities, some of which maintain minimum discharges all the year round. Hydropower currently accounts for about 29% of the total electrical power supply. In a study carried out in twelve states and four (4) river basins, over 278 unexploited small hydropower (SHP) sites with total potentials of 734.3 MW were identified [6]. However, SHP potential sites exist in virtually all parts of Nigeria with an estimated total capacity of 3,500 MW. They indicate that Nigeria possesses potential renewable source of energy along her numerous river systems, a total of 70 micro dams, 126 mini dam and 86 small sites have been identified [5].
1.2.2. Solar Energy
Nigeria has an annual average daily solar insolation of about 5.25 KWh/m2 per day, varying between 3.5 KWh/m2 at the coastal areas and 7.0 KWh/m2 at the northern boundary and an annual average daily sunshine of 11 hours [7]. This solar energy, capable of providing reliable electricity is largely left untapped. If solar collectors or modules were used to cover 1% of Nigeria’s land area, it is possible to generate 1850 x 103 GWh of solar electricity per year; this is over one hundred times the current grid electricity consumption level in the country.
1.2.3. Wind Energy
Wind energy is available at annual average speeds of about 2.0 m/s at the coastal region and 4.0 m/s at the far northern region of the country. With an air density of 1.1 kg/m3, the wind energy intensity perpendicular to the wind direction ranges between 4.4 W/m2 at the coastal areas and 35.2 W/m2 at the far northern region [4]. At present, the share of wind energy in the national energy consumption has remained on the lower end with no commercial wind power plants connected to the national grid, Only a few number of stand-alone wind power plants were installed in the early 1960s in 5 northern states mainly to power water pumps and a 5 kW wind electricity conversion system for village electrification installed at Sayyan Gidan Gada, in Sokoto State.
1.2.4. Biomass
Nigerian biomass resources can be identified as crops, forage grasses and shrubs, animal wastes and waste arising from forestry, agriculture, municipal and industrial activities, as well as, aquatic biomass. Plant biomass can be utilized as fuel for small-scale industries. It could also be fermented by anaerobic bacteria to produce a cheap fuel gas (biogas). Biogas production from agricultural residues, industrial, and municipal waste does not compete for land, water and fertilizers with food crops like is the case with bioethanol and biodiesel production and, will reduce the menaces posed by these wastes. In Nigeria, identified feedstock substrates for an economically feasible biogas production include water lettuce, water hyacinth, dung, cassava leaves and processing waste, urban refuse, solid (including industrial) waste, agricultural residues and sewage [8].
1.2.5. Other Resources
Presently, the potentials of some resources like geothermal, nuclear energy, waves, tidal and ocean thermal gradient still remain untapped and unquantified.
This paper aims to utilize a factorial approach in reducing multi-dimensional variables involved in the contemporary issue of renewable energy development in Nigeria
2. Factor Analysis
This is a statistical method used to describe variability among observed correlated variables in terms of a potentially lower number of unobserved variables called factors [9]. The observed variables are usually modeled as linear combinations of the potential factors. Thus the information gained by the interdependencies between observed variables can be used to reduce the set of variables in a data set [10].
2.1. Factor Model
Assuming the observed variables are X1, X2 …. Xn, the common factors are F1, F2 … Fm and the unique factors are U1, U2 …Un, the variables may be expressed as linear functions of the factors in Equation (1).
X1 = a11F1 + a12F2 + a13F3 + … + a1mFm + a1U1
X2 = a21F1 + a22F2 + a23F3 + … + a2mFm + a2U2
Xn = an1F1 + an2F2 + an3F3 + … + anmFm + anUn (1)
Equation (1) is a regression equation; factor analysis seeks to find the coefficients a11, a12 … anm which best reproduce the observed variables from the factors. The coefficients a11, a12 … anm are weights in the same way as regression coefficients (because the variables are standardized, the constant is zero. For example, the coefficient a11 shows the effect on variable X1 of a one-unit increase in F1. In factor analysis, the coefficients are called loadings (a variable is said to 'load' on a factor) and, when the factors are uncorrelated, they also show the correlation between each variable and a given factor. In Equation (1) above, a11 is the loading for variable X1 on F1, a23 is the loading for variable X2 on F3, etc.
When the coefficients are correlations, i.e., when the factors are uncorrelated, the sum of the squares of the loadings for variable X1, i.e a112 + a122+ … + a132, shows the proportion of the variance of variable X1 which is accounted for by the common factors. This is called the communality. The larger the communality for each variable, the more successful a factor analysis solution is. By the same token, the sum of the squares of the coefficients for a factor for F1 it would be [a112 + a212+ … + an12] -- shows the proportion of the variance of all the variables which is accounted for by that factor.
2.2. The Model for Individual Subjects
Equation (1) above, for variable 2, may be written explicitly for one subject i as:
X2i = a21F1i + a22F2i + a23F3i + … + a2mFmi + a2U2i (2)
Equation (2) makes it clear that there is a value of each factor for each of the subjects in the sample; e.g, F2i represents subject score on Factor 2. Factor scores are often used in analyses in order to reduce the number of variables which must be dealt with. However, the coefficients a11, a21, …. anm are the same for all subjects, and these coefficients are estimated in the factor analysis
3. Measurements
Questionnaires were developed to carry out the survey. The questionnaires were distributed to and collected from respondents, mostly by hand. Respondents were asked to reflect their views on a 4-point Likert scale in the range of, 5: strongly agree; 4: agree; 3: undecided 4: disagree; and 5: strongly disagree. The questionnaire was distributed to 45 respondents. However, only 40 questionnaires were retrieved. Survey was conducted in the University of Benin, Asaba district office of power holding company, Delta state direct labour agency.
StatistiXL was the statistical tool used for analyzing the data. The data obtained from questionnaires was entered into a data matrix to determine the relevance and the relationship between the renewable energy development and the various factors.
3.1. Data Matrix
The statistiXL software was used to generate correlation matrix, factor matrix and parameter estimates. Table 1 shows the general factors considered in correspondence to their scale item.
3.2. Correlation Matrix
The correlation matrix is presented in Table 2. Here, 30 factors identified are shown as entries in the column and 40 respondents in the row. The sample questionnaire is shown in appendix.
3.3. Communalities
The communalities of the correlation matrix generated using StatisXL is shown in Table 3.
3.4. Varimax Rotated Factor Loading
The factor loading for the data matrix as generated by StatisXL is shown in Table 4. The factor loading were ranked and the highest irrespective of sign were selected. The variable associated with these factors was listed out as shown in Table 5.
Table 1. Factor descriptions.
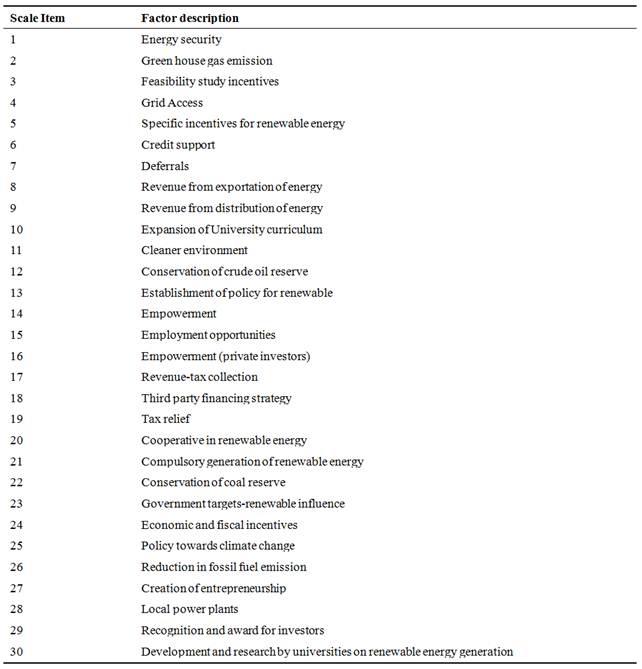
Table 2. Correlation matrix.
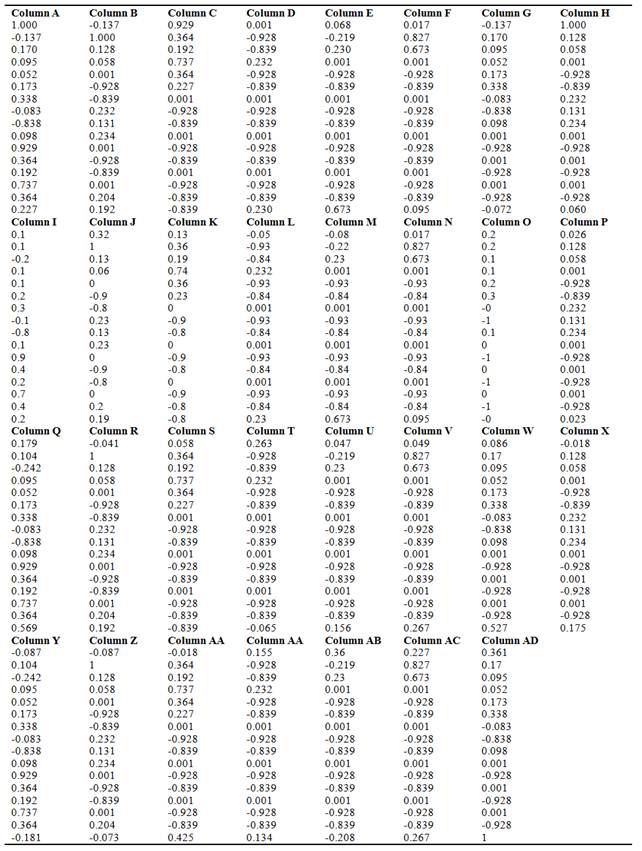
Table 3. Communalities.
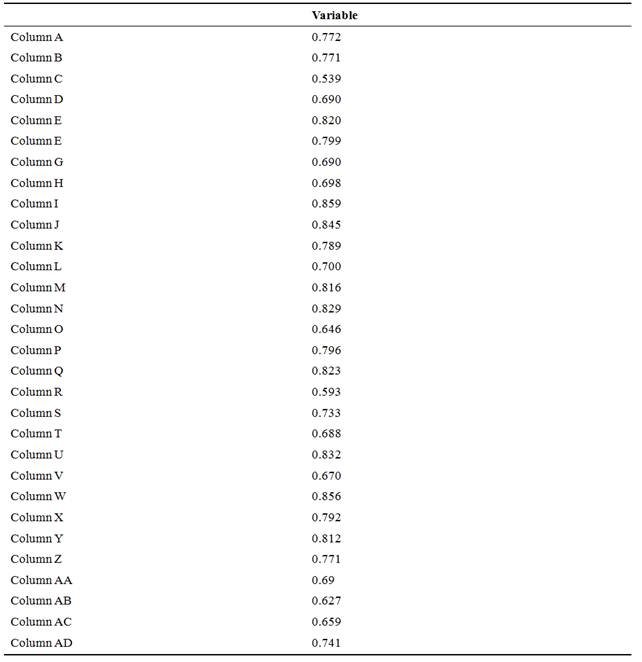
Table 4. Varimax rotated factor loading.
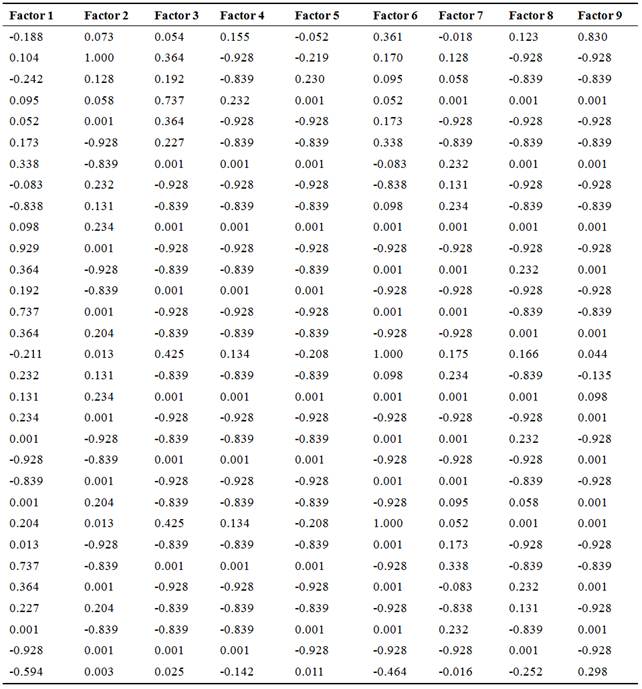
Table 5. Principal variables
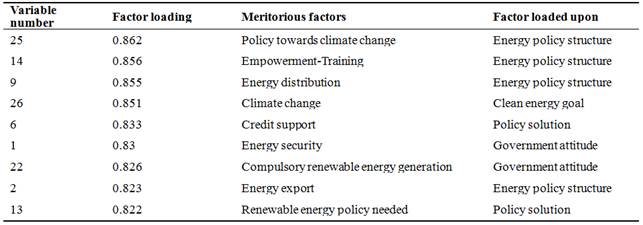
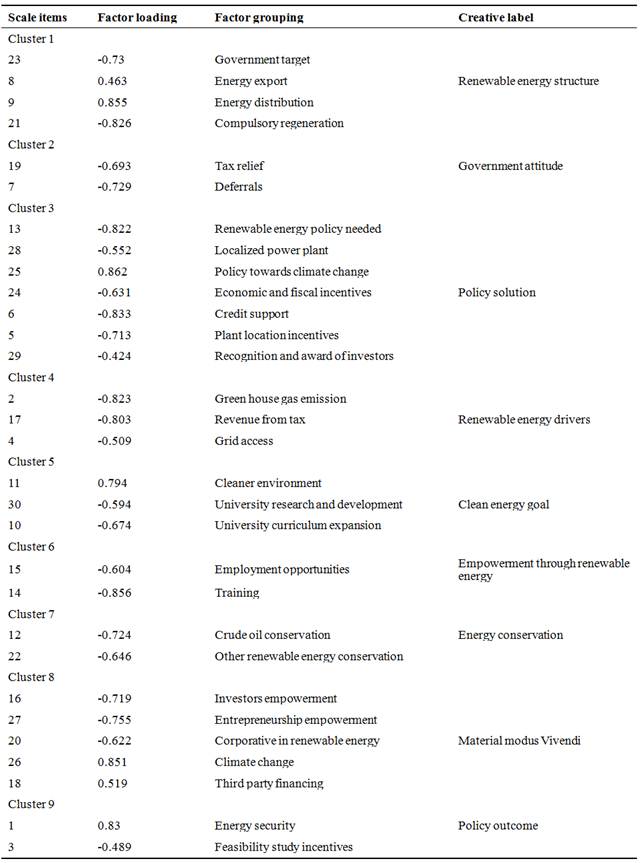
Table 6. Creative label of principal factor.
4. Discussion of Results
Based on the principal component method (CPM), the creative label of the resulting 9 factors shown in Table 5 are presented in Table 6. From Table 6, all the factors in cluster 1 which represent policy structure acts as the gearing factors necessary for the establishment of policy for renewable energy technology. Energy distribution has the highest significant figure in this cluster with a value of -0.855, followed by compulsory generation of renewable energy with a factor loading of -0.826. Government target and energy export both have factor loading of -0.730 and 0.463 respectively. Cluster 2 represent government attitude. In order of significance, the variables include deferrals with a value -0.729 and Tax relief (-0.693). The determination of these two variables depends on the government attitude towards renewable energy. This cluster suggests that government should show attitude of liberalism of renewable energy technology to thrive in the country. Cluster 3 represents renewable energy policy solution. Policy towards climate change, credit support and necessity of renewable energy policy yielded meritorious factor loading justifying the great importance of the variables under this cluster in policy making. The policy towards climate change was the most significant variable having a loading factor of 0.862. Thus, environmental agencies in Nigeria should work very hard in ensuring that the adverse effect of fossil fuel and other green house gases be reduced. Cluster 4 is summarized as renewable energy driving force. The grid access is the most significant factor and has little difference compared to greenhouse gas emission and revenue from tax. Three variables are present in cluster 5, which represents clean energy. The quest for cleaner environment is the most significant driving factor for renewable energy. Thus the expansion of university curriculum and research and development on renewable energy will lead to a cleaner environment is shortest possible time. Cluster 6 represents empowerment through renewable energy. This is a dual factor cluster with one meritorious and one substantial factor loading of -0.856 and -0.604 representing training and employment opportunities respectively. This cluster indicates that the development of renewable energy will generate employment opportunities, thus empowering the citizens of this country. Cluster 7 involves energy conservation. The two variables present are crude oil having a factor loading of -0.726 and conservation of other renewable energy sources with a loading factor of -0.644 emphasizes the general need for energy conservation. Cluster 8 represents material modus Vivendi. This cluster is seen as compromising factor. Climate change has a meritorious factor loading of 0.851 thus, is regarded as most important factor for consideration in this cluster. Third party financing yields a factor loading 0.519 this can be regarded as next important factor along the line, then to involve cooperatives, investors’ empowerment and entrepreneurship in renewable energy. Cluster 9 involves policy outcomes. Evidently, the policy is yet to be established and hence a negative factor loading of -0.489 in feasibility study incentives variable. Energy security which is the most crucial variable in this cluster has a factor loading of 0.830.
Renewable energy policy structure under cluster 1 as well as government attitude in cluster 2 appears to be very crucial for the formulation of policy needed for the development of renewable technology in Nigeria. Thus cluster 1 and 2 may be treated first in possible capital rationing in budgeting.
5. Conclusion and Recommendations
This paper has been able to utilize statistiXL and factorial analysis to reduce 30 identified variable factors of renewable energy development in Nigeria to 9 clusters. These clusters can serve as guide lines to assist the Nigerian government and policy makers to strategize on most significant variable factor in renewable energy technology research and development.
Government should ensure that fiscal and non-fiscal incentives are put in place for private investors that are willing to invest. The development of renewable energy services should be linked to many other sectors such as agriculture, small scale industrial enterprises or millennium goals. They will have greater likelihood of success if implemented in line with these activities to ensure sufficient demand for the energy services providers and may attract funding. Experience has shown that most renewable energy technologies (especially those that can be locally manufactured) require subsidies only in the initial stages, and can become financially sustainable in the short to medium term after a certain level of technology dissemination has been attained and subsidy would be gradually withdrawn. Nigeria now has a published energy policy and the policy did emphasize the development RE. However, integrated policy and vigorous implementation strategy is needed to facilitate rapid diffusion of RE in the nation’s energy mix.
References
- Ebunilo P.O and Kwasi-Effah C.C (2013), Solar refrigeration. Discovery Spring Journal, Vol.1 (1), pp 17-19.
- Okafor E.N and Joe U. (2010). Challenges to development of renewable energy for electricity power sector in Nigeria. International journal of academic research, Vol 2 (2)pp 211-216.
- Onyemaechi C.C (2008). Renewable energy in rural Nigeria. International NGO Journal, Vol. 4(7), pp 333 336.
- Olagbegi P.O, Kwasi-Effah C.C., Ugbi B. A (2014). Prilimary investigation of the effect of wind speed on the output performance of a wind electric generator. Global Journal of Advanced Engineering Technologies Vol3, (2) pp23-28.
- Sambo A.S (2005). Renewable energy for rural development: Nigeria prospective. Journal of science and technology vision. Vol. 1 pp 12-22.
- Olayinka S.O (2010). Energy utilization and renewable energy sources in Nigeria. Journal of Engineering and Applied Sciences, Vol.5 pp171-177.
- Aburime, B.A., Kwasi-Effah, C.C. and Egware, O.H. (2013). An experimental study of single surface solar water distiller. International Journal of Engineering and Technology Sciences (IJETS), Vol. 1 (2)pp 34-45.
- Akinbami FK, Illori M.O. Oyebisi, T.O, Akinwunimi I.O and Adeoti O. (2001). Biogas energy use in nigeria. Renewable and sustainable energy reviews, Vol 5. (1) pp 97-112.
- Fabrigar, L., Wegener, D., MacCallum, R., and Strahan, E. (1999). Evaluating the use of exploratory factor analysis in psychological research. Psychological Methods, Vol. 4, pp 272-299.
- Widaman, K.F. (1993). Common factor analysis versus principal component analysis: Differential bias in representing model parameters? Multivariate Behavioral Research, Vol. 28,pp 263-311.


