
International Journal of Environmental Planning and Management, Vol. 1, No. 2, June 2015 Publish Date: May 28, 2015 Pages: 48-55
Distribution of Drinking Water Supply Facilities in Mayiladuthurai Town, Tamilnadu, India, Using Spatial Analysis
Arul. P.1, Tamilenthi. S.2, *, Srividhya. C.3
1Dept. of Geography, Government College (Auto), Salem, India
2Dept. of Geography, Kalinga University, Raipur, Chhattisgarh, India
3Post-Graduate and Research Dept. of Geography, Government College (Auto), Kumbakonam, India
Abstract
Water supply gained its significance only during recent years. Every city has the problem of adequate spatial deficiencies and such other logistic problems. The usual problems are aggravated by the peculiar character of Rainfall in India and especially on the case of Tamilnadu. The objective of this study is to study the different sources of existing drinking water supply system in Mayiladuthurai town 2008.To find the growth of drinking of water supply system in Mayiladuthurai town 1989-2008.To examine the efficiency and drinking water supply system with the distribution of population The collected information and data both descriptive and cartographical methods have been used to find out the existing drinking water supply system. Using of GIS, the correlation coefficient techniques, Nearest Neighbor analysis and simple statistics have been used to find the efficiency and sustainability of drinking water supply system, for the study period for Mayiladuthurai town.
Keywords
Spatial Analysis, Drinking Water, Mayiladuthurai, Buffering, GIS
Received: April 9, 2015
Accepted: April 24, 2015
Published online: May 27, 2015
@ 2015 The Authors. Published by American Institute of Science. This Open Access article is under the CC BY-NC license. http://creativecommons.org/licenses/by-nc/4.0/
Contents
1. Introduction 1.1. Importance of Water Supply 1.2. Objectives of the Study 1.3. Source and Limitation 1.4. Techniques Used 1.5. Source of Information 2. Methodology 2.1. Study Area 2.2. Distribution of Different Types of Drinking Water Supply Facilities-2008 2.3. Public Fountain 2.4. Hand Pump 2.5. India Mark II 2.6. Tap Connection 2.7. Bore Well 2.8. Overhead Pump 3. Growth of Drinking Water Supply Facilities Mayiladuthurai Town: (1989-2008) 3.1. Public Fountain (1989-2008) 3.2. Hand Pump (1989 - 2008) 3.3. India Mark-II (1989-2008) 3.4. Tap Connection (1989-2008) 3.5. Bore Wells (1989-2008) 3.6. Overhead Tank (1989-2008) 4. Population and the Different Types of Water Supply Facilities in 2008 5. Findings and Suggestions 5.1. Findings 5.2. Suggestions
1. Introduction
Water is essential for almost every form of living thing. To man it is as important as the air be breather. In a responsible climate, he can dispense with shatter for good, with clothes as long as follows will tolerate, with good for several weeks. But deny with him water and his life expectancy is a matter of few days.
The importance of water in human life is so much and the development of any city of the world was practically taken place near some source of water supply. However, with the rapid spread of industrial units and the overgrowing population pressures there has been an unprecedented strain on the water resources. Moreover, the most supply have increasingly become polluted.
1.1. Importance of Water Supply
Water supply is probably the most important in the world. The city or town should be given the benefit of water supply scheme, where over possible. The successful implementations of any water supply project grant the following advantages.
Cromwell et al., (2001) study stated that the population change has had on water systems over the course of time. The installation and maintenance of water supply scheme grant opportunities of employment of the local people. The growth of new industries for various pipe appurtenances such as air values, bib rocks etc., take place in the locality granting employment opportunities. The public in general gets treated reliable water for consumption and the after uses.
The sanitation of the area is considerably improved by the adequate water supply. The industries which requires pure water for there working are same from the expenditure of installing their own water purification plant. The available water in the locality is used in the best possible manner and its misuse and wastage are avoided into a considerable extent.
Water supply gained its significance only during recent years. Water table condition, water resources the quantity of water were studies in the past two decades. The Government authorities, the sociologist, engineers, economist, the town planners, approached this problem according to their nature of study. The industrialization, the economic development population growth in cities, made the pressure of the water supply studies.
The U.S. Environmental Protection Agency (EPA, 2002) stated "As our economy and population grow, we must periodically take a good look at the challenges ahead and reassess our nation’s need for infrastructure to ensure clean and safe water."
Page (2001) indicated that the adequate infrastructure for a potable water supply is a key issue to limit or promote economic growth. Burns and Kenney (2005) studied the development patterns and water infrastructure of the City of Phoenix. They recognized that entire urban infrastructure is experiencing a significant decline in service due to a variety of factors including urban intensification and uneven demand.
Majority of the cyclonic storm bring copious rainfall and is not sufficient for water supply throughout the year. Every city has the problem of adequate spatial deficiencies and such other logistic problems. The usual problems are aggravated by the peculiar character of Rainfall in India and especially on the case of Tamilnadu. The annual seasonal and spatial variations aggravated by the absence of rainfall during the hottest part of the year resulting the tremendousness less due to evaporation, makes worth of water supply authorities drastically difficult.
1.2. Objectives of the Study
Spatial analysis of the distributional pattern of drinking water supply facilities in Mayiladuthurai town contains the following aims and objects.
To study the different sources of existing drinking water supply system in Mayiladuthurai town 2008
To find the growth of drinking of water supply system in Mayiladuthurai town 1989-2008
To examine the efficiency and drinking water supply system with the distribution of population
1.3. Source and Limitation
Source of information or secondary data has been collected from Mayiladuthurai municipality, town planning office, statistical office.
Due to the time constraint, this study deals about the distribution and growth of water supply facilities (1989-2008) in Mayiladuthurai town.
1.4. Techniques Used
To study the distribution of water supply facilities, its growth and its relationship with population, GIS and simple techniques are used.
1.5. Source of Information
The number and location of public Tap Connection, number of Hand Pumps, number of India Mark II, number of Tap Connection, number of bore well, number of Over Head Pump have been collected from Mayiladuthurai municipality in engineering section, town planning office and statistical office.
Interviews had been made to find out the opinion of the people regarding the water supply arrangement of Mayiladuthurai town.
2. Methodology
With the help of collected information and data both descriptive and cartographical methods have been used to find out the existing drinking water supply system.
With the help of GIS, the correlation coefficient techniques, Buffering, Nearest Neighbor analysis and simple bar have been used. To find the efficiency and sustainability of drinking water supply system, (ie) current year (2008) in Mayiladuthurai town.
2.1. Study Area
Mayiladuthurai town is situated from 11°5’N to 11°7’ North latitude and 79°3’ E to 79°37’ East longitude. (Fig.1). Climate is the most important factor of environment which governs the agricultural activity. The climate throughout the year is tropical. Generally healthy climate prevail throughout the year bearing the summer period from April to June. The annual maximum and minimum temperature recorded on the chart are 39°4c and 33°8c respectively. Mayiladuthuarai has been divided into 36 wards for administrative purpose. The population is unevenly distributed in all the 36 wards of the town. Mayiladuthurai is also a pilgrim center. Therefore the concentration of population has been found in and around the core of town. The concentration of commercial activates are found in the CBD area of core area (ward no 7, 10, 23, 24, 26, 28).
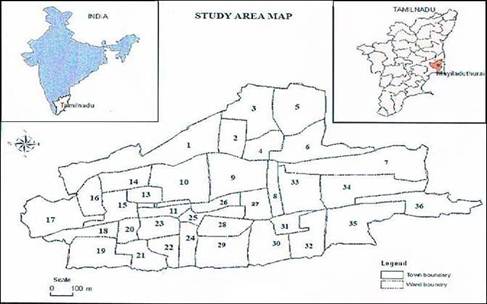
Fig (1). Study area: Mayiladuthurai Location.
2.2. Distribution of Different Types of Drinking Water Supply Facilities-2008
There are five different types of water supply facilities in this Mayiladuthurai town. They are Public Fountain, Hand Pump, India Mark II, Tap Connection, Bore Well and Over Head Pump. In this the total number of Public Fountain is 216, Hand Pump is 232, India Mark-II is 89, Tap Connection is 317, Bore Well is 28 and Over Head Pump is 5. (Fig. 2).
2.3. Public Fountain
The total number of Public Fountain in this town is 216 water supplies is a must for the different activities of this town. More over the town provides water supply to medical, shopping centers and administrative facilities. So the floating population is comparatively greater through Public Fountain water is supplied to the people in shift system. Daily water is supplied from 6.00 am to 8.00 am and evening 5.00 pm to 6.00 pm. The number of Public Fountain is l to5 in ward number 2, 4,7,8,11,12,13,15,20,25,26,27,29,30 and 35.
Most of the people most by depend on Public Fountain of water facility. The number of Public Fountain in ward number 1,3,5,6,9,10,14,16,17,19,22,23,24,28,31,32,33,34 and 36 it ranges from 6 to l0. The number of Public Fountain in ward number 18, 21 it ranges from above 10. (Table.1).
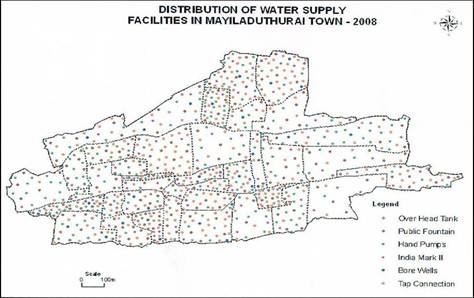
Fig (2). Distribution of water supply facility in Mayiladuthurai
Table (1). Water supply facilities public fountain in Mayiladuthurai town – 2008
| S.No | Ward No | Public fountain | S.no | Ward No | Public fountain |
| 1 | 1 | 9 | 19 | 19 | 6 |
| 2 | 2 | 5 | 20 | 20 | 3 |
| 3 | 3 | 6 | 21 | 21 | 11 |
| 4 | 4 | 4 | 22 | 22 | 7 |
| 5 | 5 | 7 | 23 | 23 | 7 |
| 6 | 6 | 7 | 24 | 24 | 6 |
| 7 | 7 | 5 | 25 | 25 | 5 |
| 8 | 8 | 3 | 26 | 26 | 4 |
| 9 | 9 | 6 | 27 | 27 | 3 |
| 10 | 10 | 8 | 28 | 28 | 7 |
| 11 | 11 | 4 | 29 | 29 | 5 |
| 12 | 12 | 4 | 30 | 30 | 2 |
| 13 | 13 | 5 | 31 | 31 | 6 |
| 14 | 14 | 6 | 32 | 32 | 7 |
| 15 | 15 | 5 | 33 | 33 | 8 |
| 16 | 16 | 6 | 34 | 34 | 9 |
| 17 | 17 | 6 | 35 | 35 | 4 |
| 18 | 18 | 11 | 36 | 36 | 9 |
| Total | 216 |
Table (2). Water supply facilities hand pumps in Mayiladuthurai town – 2008
| S.No | Ward no | Hand pump | S.No | Ward no | Hand pump |
| 1 | 1 | 11 | 19 | 19 | 9 |
| 2 | 2 | 15 | 20 | 20 | 6 |
| 3 | 3 | 13 | 21 | 21 | 1 |
| 4 | 4 | 4 | 22 | 22 | 4 |
| 5 | 5 | 6 | 23 | 23 | 2 |
| 6 | 6 | 4 | 24 | 24 | 2 |
| 7 | 7 | 21 | 25 | 25 | 4 |
| 8 | 8 | 2 | 26 | 26 | 5 |
| 9 | 9 | 6 | 27 | 27 | 8 |
| 10 | 10 | 3 | 28 | 28 | 3 |
| 11 | 11 | 1 | 29 | 29 | 5 |
| 12 | 12 | 7 | 30 | 30 | 7 |
| 13 | 13 | 5 | 31 | 31 | 7 |
| 14 | 14 | 8 | 32 | 32 | 12 |
| 15 | 15 | 5 | 33 | 33 | 4 |
| 16 | 16 | 9 | 34 | 34 | 3 |
| 17 | 17 | 12 | 35 | 35 | 1 |
| 18 | 18 | 13 | 36 | 36 | 4 |
| Total | 232 |
2.4. Hand Pump
Totally there are 232 Hand Pumps Mayiladuthurai town most of the wards are having Hand Pumps. In ward of 6, 8, 10, 11, 13, 15, 21, 22, 23, 24, 25, 26, 28, 29, 33, 34, 35 and 36 the Hand Pumps are l to 5 numbers. In ward of 5, 9, 12, 14, 16, 19, 20, 27, 30 and 31 the Hand Pumps ranges from 6 to l0. In ward of 1, 2, 3, 7, 17, 18 and 32, wards of Hand Pumps ranges from above 10. Ward number 1, 3, 5, 6, 9, 10, 14, 16, 17, 19, 22, 23, 24, 28, 31, 32, 33, 34 and 36 it ranges from 6 to l0 (Table.2)b.The number of Public Fountain in ward number 18, 21 it ranges from above 10.
2.5. India Mark II
The total number of India Mark II in this town is 89. India Mark II is used in minimum level of Mayiladuthurai town. The number of India Mark II is in wards of 1, 2, 4, 5, 6, 7, 8, 9, 10, 11, 13, 14, 15, 16, 17, 18, 19, 20, 21, 22, 23, 24, 25, 26, 27, 28, 29, 30, 31, 32, 33, 34, 35 and 36 are from 1 to 4. The number of India Mark II in ward number 3 and 12 it ranges from above 4(Table.3).
Table (3). Water supply facilities India mark ii in Mayiladuthurai town - 2008
| S.No | Ward no | India mark II | S.No | Ward no | India mark II |
| 1 | 1 | 3 | 20 | 20 | 2 |
| 2 | 2 | 3 | 21 | 21 | 2 |
| 3 | 3 | 5 | 22 | 22 | 2 |
| 4 | 4 | 2 | 23 | 23 | 2 |
| 5 | 5 | 2 | 24 | 24 | 2 |
| 6 | 6 | 2 | 25 | 25 | 2 |
| 7 | 7 | 2 | 26 | 26 | 4 |
| 8 | 8 | 2 | 27 | 27 | 2 |
| 9 | 9 | 2 | 28 | 28 | 2 |
| 10 | 10 | 4 | 29 | 29 | 2 |
| 11 | 11 | 2 | 30 | 30 | 3 |
| 12 | 12 | 5 | 31 | 31 | 3 |
| 13 | 13 | 2 | 32 | 32 | 2 |
| 14 | 14 | 2 | 33 | 33 | 2 |
| 15 | 15 | 2 | 34 | 34 | 2 |
| 16 | 16 | 2 | 35 | 35 | 3 |
| 17 | 17 | 2 | 36 | 36 | 3 |
| 18 | 18 | 2 | - | - | - |
| 19 | 19 | 2 | Total | 89 |
2.6. Tap Connection
Through taps the water is supplied to the people in shift system. The total number of Tap Connection in this town is 317 most of the people are utilizing the Tap Connection. When we see the ward wise distribution of Tap Connection Mayiladuthurai town is 317. In ward numbers 4,8,9,11,12,13,15,17,20,32,34 and 35 Tap Connection is 0 to 5. In ward number 6,7,1,14,18,19,21,23,24,25,26,28,30 and 33 it ranges from 6 to l0 .In ward numbers 1,2,3,5,10,22,27,29,33 and 36 from above 10(Table.4).
2.7. Bore Well
The total number of bore wells in this town is 28. Water supply is a must for the different activities of this town. In ward number of 1, 5 and 29, the numbers of bore wells are 9. The wards of 7,8,18,19,22,23 and 27 are hatting middle level of bore wells (14) in ward of 2, 3,4,21 and 26 are having the low level of bore wells (5). (Table.5).
Table (4). Supply facilities tap connection in Mayiladuthurai town -2008
| S.no | Ward no | Tap connection | S.no | Ward no | Tap connection |
| 1 | 1 | 17 | 19 | 19 | 6 |
| 2 | 2 | 17 | 20 | 20 | 5 |
| 3 | 3 | 23 | 21 | 21 | 7 |
| 4 | 4 | 4 | 22 | 22 | 12 |
| 5 | 5 | 28 | 23 | 23 | 6 |
| 6 | 6 | 6 | 24 | 24 | 8 |
| 7 | 7 | 10 | 25 | 25 | 7 |
| 8 | 8 | 3 | 26 | 26 | 8 |
| 9 | 9 | 5 | 27 | 27 | 11 |
| 10 | 10 | 26 | 28 | 28 | 10 |
| 11 | 11 | 1 | 29 | 29 | 17 |
| 12 | 12 | 3 | 30 | 30 | 6 |
| 13 | 13 | 3 | 31 | 31 | 13 |
| 14 | 14 | 8 | 32 | 32 | 4 |
| 15 | 15 | 2 | 33 | 33 | 8 |
| 16 | 16 | - | 34 | 34 | 4 |
| 17 | 17 | 2 | 35 | 35 | 3 |
| 18 | 18 | 8 | 36 | 36 | 16 |
| Total | 317 |
Table (5). Distribution of water supply facilities bore wells in Mayiladuthurai town – 2008
| S.No | Ward no | Bore wells | S.No | Ward no | Bore wells |
| 1 | 1 | 3 | 19 | 19 | 2 |
| 2 | 2 | 1 | 20 | 20 | - |
| 3 | 3 | 1 | 21 | 21 | 1 |
| 4 | 4 | 1 | 22 | 22 | 2 |
| 5 | 5 | 3 | 23 | 23 | 2 |
| 6 | 6 | - | 24 | 24 | - |
| 7 | 7 | 2 | 25 | 25 | - |
| 8 | 8 | 2 | 26 | 26 | 1 |
| 9 | 9 | - | 27 | 27 | 2 |
| 10 | 10 | - | 28 | 28 | - |
| 11 | 11 | - | 29 | 29 | 3 |
| 12 | 12 | - | 30 | 30 | - |
| 13 | 13 | - | 31 | 31 | - |
| 14 | 14 | - | 32 | 32 | - |
| 15 | 15 | - | 33 | 33 | - |
| 16 | 16 | - | 34 | 34 | - |
| 17 | 17 | - | 35 | 35 | - |
| 18 | 18 | 2 | 36 | 36 | - |
| Total | 28 |
2.8. Overhead Pump
The total number of Over Head Pump in this town is 5. Water level capacity is different from each other. The high level water capacity of tank is found in high populated area varadhachariyar park (ward number 27) 25, 00,000 liters. The middle level of Over Head Pump is found in Mamarathumedai and K.K .R Nagar in (ward number 1, 19) 2 numbers and water capacity is 13, 50,000 and 8, 00,000 liters. The low level of Over Head Pump is found in Bharathi nagar in (ward number 18) and the water capacity is 1, 00,000 liters. In the total water supply facility the ever head tank shares 0.56% of which is depended by most of the people (Table.6).
Table (6). Distribution of water supply facilities overhead pump in Mayiladuthurai town – 2008
| S.No | Ward no | OverHead pump | S.No | Ward no | Over Head pump |
| 1 | 1 | 1 | 19 | 19 | 2 |
| 2 | 2 | - | 20 | 20 | - |
| 3 | 3 | - | 21 | 21 | - |
| 4 | 4 | - | 22 | 22 | - |
| 5 | 5 | - | 23 | 23 | - |
| 6 | 6 | - | 24 | 24 | - |
| 7 | 7 | - | 25 | 25 | - |
| 8 | 8 | - | 26 | 26 | - |
| 9 | 9 | - | 27 | 27 | 1 |
| 10 | 10 | - | 28 | 28 | - |
| 11 | 11 | - | 29 | 29 | - |
| 12 | 12 | - | 30 | 30 | - |
| 13 | 13 | - | 31 | 31 | - |
| 14 | 14 | - | 32 | 32 | - |
| 15 | 15 | - | 33 | 33 | - |
| 16 | 16 | - | 34 | 34 | - |
| 17 | 17 | - | 35 | 35 | - |
| 18 | 18 | 1 | 36 | 36 | - |
| Total | 5 |
3. Growth of Drinking Water Supply Facilities Mayiladuthurai Town: (1989-2008)
3.1. Public Fountain (1989-2008)
In 1989 - 1993 the total number of public fountain was 111 (8.61%) in Mayiladuthurai town (Table.7). In the next five years they were 111 (12.27%) and it increases to 174 (14.23%) in 1999-2003 totally they were 216 (10.14%) in 2004- 2008. The utilization and number of public fountain is always increasing with the increase of population who mostly depends on public fountain.
3.2. Hand Pump (1989 - 2008)
In 1989 - 1993 totally there were 220 (17.06%) hand pumps found in Mayiladuthurai town. In the next five years they were 224 (2-1.77%) and it increases to 229 (18.7$ in 1999-2003 totally (here were 232 (10.89%) in 2004-2008.
3.3. India Mark-II (1989-2008)
In 1989 - 1993 totally there were 20 (1.55%) India mark II found in Mayiladuthurai town. In the next five years they were 38 (4.2%) and it increases to 57 (4.66%) in 1999-2003 totally there were 89 (4.18%).
3.4. Tap Connection (1989-2008)
In 1989-1993 in total number of tap connection was 925 (71.76%) in Mayiladuthurai town. In the next five years they were 514 (56.85%) and it increased to 739 (60.47%) in 1994-2003.Totally they werel559 (73.2%) in 2004- 2008.
3.5. Bore Wells (1989-2008)
In 1989 - 1993 totally there were 11 (0.85 %) in Mayiladuthurai town. It increased to 15 (1.65%) in 1994-1998.In the next five years they are 18 (1.47%) and it increased to 28 (1.31%) in 2004-2008.Bore wells are not found in many wards.
3.6. Overhead Tank (1989-2008)
The total number of overhead tank in 1989-1993 was 2. In the next five years they were 5 (0.40%) and it decreases to percentage 0.23% in 2004- 2008.Demands of a water supply increased in high populated wards. So population determines the number of water supply facilities.
Table (7). Growth of drinking water supply facilities in Mayiladuthurai town- 1989-2008
| S.no | Years | Overhead tank | Public pump | Hand Pump | India Mark II | Bore wells | Tap Connection |
| 1 | 1989-1993 | 2 | 111 | 220 | 20 | 11 | 925 |
| % | 0.15 | 8.61 | 17.06 | 1.55 | 0.85 | 71.76 | |
| 2 | 1994-1998 | 2 | 111 | 224 | 38 | 15 | 514 |
| % | 0.22 | 12.27 | 24.77 | 4.20 | 1.65 | 56.88 | |
| 3 | 1999-2003 | 5 | 174 | 229 | 57 | 18 | 739 |
| % | 0.40 | 14.23 | 18.73 | 4.66 | 1.47 | 60.47 | |
| 4 | 2004-2008 | 5 | 216 | 232 | 89 | 28 | 1559 |
| % | 0.23 | 10.14 | 10.89 | 4.18 | 131 | 73.2 |
4. Population and the Different Types of Water Supply Facilities in 2008
Population of Mayiladuthurai town is 84505 and the town is divided in to 36 wards, Population differs from each ward to the other, so the number of water supply facilities utilization is different from each other. The high populated wards are utilizing the high number of water supply facilities and in these the use of Public Fountain, Hand Pump, India Mark II and Tap Connection are in high number of each and every ward (Fig.3).
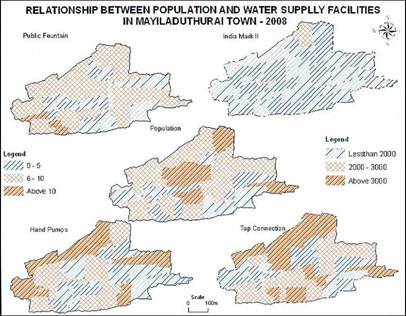
Fig (3). Population and water facilities in Mayiladuthurai town in 2008
The most densely populated area of ward 5, 9, 10, 25, 28, and 36 are having 5 to 10 Public Fountain water supply facility. 2000-3000 population area of wards 1, 2, 3, 6, 7, 8, 13, 14, 16, 18, 19, 22, 23, 27, 29, 31 and 36 are having more water supply of pubic fountain. It may be due to the high utilization of Public Fountain water supply. The high populated area people may be somewhat high income people and the other type water supply facility of individual house Tap Connection and the Hand Pumps are in seen more in number (i.e. more than 10) in wards 1, 2, 3, 7, 17, 18, and 32 and here the population is also high in number and in some areas where the population is low there the Hand Pump is more in Number. So the utilization of Hand Pumps more all over the town. India Mark II is also more in number in the high, medium and low populated area. 70 (32.4%) Public Fountain water facility is distributed in South West of Mayiladuthurai town in 2008. In the center of the town it is 24 (11.1%), in the North, North East (15.2%) and 42 (19.4%) number and the South and South East direction of the rest is distributed in the West to North West in the South East it is distributed in a clustered pattern in number 47 (21.7%). Here the facility of Public Fountain is distributed in the Southwest 70 (32.4%) in a cluster manner. In all the directions of Mayiladuthurai town. They are distributed in a scattered manner.
Hand Pumps distribution is high in percentage 53% in the West, South and South West. The distribution in North, North East 23% in a cluster manner in the other direction the distribution in a scattered manner 54 (23%). India Mark II water supply facility is distributed in all over the town and it 89 in Mayiladuthurai town in 2008. In the West, South West, South it is 37 (41.5%) and in the other directions in distributed here and there 52 (58.4%). House Tap Connection is distributed 113 (35.6%) in South, West and South West of in Mayiladuthurai town 2008.In the center of the town it is 54 (17%) in the North, North West 90 (28.3%).The rest is distributed in the East, North East 25 (7.8%), South East 35 (11%) it is distributed in a scattered pattern and in North; South West it is distributed in a cluster pattern.
The high densely populated area of Mayiladuthurai town has high of distribution Public Fountain, Hand Pumps, India Mark II and Tap Connection The medium populated area (2000-3000) also has more water supply facility. The low populated area is having low distribution of water supply facilities and these areas are near the agricultural lands.
5. Findings and Suggestions
5.1. Findings
1. The distribution of drinking water supply facilities the Tap Connection facility ranks first (1556) than the other facilities , in particular the ward no.5 it is more in number than the other wards.
2. Hand Pumps of drinking water supply facilities system leads the second position in Mayiladnthurai town. This facility is utilized in all over Mayiiladuthurai town.
3. Public Fountain (216) India Mark II (89) and overhead lank (5) of drinking water supply facilities rank third, fourth and fifth position.
4. The distribution pattern of India Mark II, water supply facility the nearest neighborhood analysis was applied. From this in the center and North West, it’s distributed in cluster pattern and in the other sides of North East, East, South East, South West it is distributed in scatter manner.
5. All the water supply facilities has been increasing every year since 1989.
6. The correlation coefficient reveals the relationship between the density of population and drinking water supply facilities. (Public Fountain; Hand Pumps and Tap Connection) tha there is a close relationship between the density of population and water supply facilities especially the house Tap Connection.
This is due to the high density of population, and may be their low income which leads to the high utilization of Public Fountain. In the center of the town where the population is high but utilization of this facility is low .Where the house Tap Connection is more in number.
5.2. Suggestions
All these types of water facilities should be increased according to the population density and the utilization. Especially the Bore Well should be increased in more numbers than the Hand Pumps which is having short life time and in summer the water scarcity is high and the absence of Public Fountain in many wards (5,6,7,8,9,17,19,29,30,34 and 35) also should be increased.
References
- Bain, R.ES., S.W. Gundry, J.A. Wright, H. Yang, S. Pedley, and J.K. Bartram (2012), ‘Accounting for water quality in monitoring access to safe drinking-water as part of the Millennium Development Goals: lessons from five countries’, Bulletin of the World Health Organization, 90, pp. 228-235A.
- Cromwell, J., Speranza, E., and Reynolds, H. 2001. Dawn of the Replacement Era: Reinvesting in Drinking Water Infrastructure. American Water Works Association, pp. 1-24.
- Das, Keshab (2001), "Rural Drinking Water Supply in India: Issues and Strategies," in Sebastian Morris (ed.), India Infrastructure Report 2001: Issues in Regulation and Market Structure. 3iNetwork, Oxford University Press, New Delhi.
- Environmental Protection Agency (EPA). 2002. The Clean Water and Drinking Water Infrastructure Gap Analysis, 50p.
- 5Ghebtsawi Tsighe, T. (1990). ’Drinking water source protection problems: the case of Tanzania’.In: Working meeting on drinking water sourceprotection,30 June 1 July,1990. The Hague, TheNetherlands,IRCInternationalWaterandSanitationCentre.
- Lewis, W.J., Farr, J.L., and Foster, S.S.D. (1980b). ’The pollution hazard to village water supplies in eastern Botswana’. In: Proceedings of the Institute of Civel Engineers. Part2, vol.69.
- Milner, M. (2009), ‘Youth Culture in a "Faraway Place"’, The Hedgehog Review, Spring, pp. 65-73.
- Nidhya P. and Venmathi A., 1999, impact of tannery effluent on environmental quality in Dindigul, Proceedings, Indian Environmental Congress 2003 – March towards Green Earth, 2021 December 2003.
- Page, G.W. 2001. Planning Implications of Water Supply Decisions. Planning Practice & Research 16:281-292.
- Ravichandran. M and Boopathi, S, ‘Economic and Environmental Status of Drinking Water Provision in Rural India’, Journal of Social and Economic Development, July-December, 2002, Vol 4, No. 2.
- Veerashekharappa (1999),Karnataka Integrated Rural Water and Environmental Sanitation: Impact Evaluation Study, Institute for Social and Economic Change, Nagarbhavi, Bangalore 560072.
- Water Demand and Supply Analysis using a SpatialDecision Support System, E.Manoli, Global Nest: theint. J. Vol 3, No. 3, pp199-209, 2001.


