Journal of Environment Protection and Sustainable Development, Vol. 2, No. 2, March 2016 Publish Date: Oct. 19, 2016 Pages: 7-16
Forest Loss and Other Dynamic Land Use Changes in the Western Region of Ghana
Addo Koranteng1, *, Tomasz Zawila-Niedzwiecki2
1Institute of Research Innovation and Development (IRID), Kumasi Polytechnic, Kumasi, Ghana
2Faculty of Forestry, Warsaw University of Life Sciences, Warsaw, Poland
Abstract
Quantifying the forest loss and land use dynamics using satellite data is becoming increasingly important in natural resource management. Deforestation and degradation have become issues of paramount concern due to climate change anxieties. Satellite imagery in this study via Landsat TM, Landsat ETM + and DMC have provided vital tools for assessing forest loss and land use change in the Western Region of Ghana from 1990 -2010. The study employs a combination method in Remote Sensing (RS) and Geographic Information System (GIS) to estimate, classify and map the forest cover and land use change over a twenty year period. The study reveals a very serious problem of forest loss. The Western Region is the most forested, natural resources rich and biologically diverse in Ghana. This study offers vital pieces of information which may be used to observe; advice and sway land use to a more beneficial and sustainable manner as the trend of forest loss is alarming in this part of country.
Keywords
Land Use Change, Deforestation, Degradation, Remote Sensing, GIS
Received: September 7, 2016
Accepted: September 18, 2016
Published online: October 19, 2016
@ 2016 The Authors. Published by American Institute of Science. This Open Access article is under the CC BY license. http://creativecommons.org/licenses/by/4.0/
Contents
1. Introduction 2. Methodology 2.1. Study Area 2.2. Materials 2.3. Image Processing 2.4. Land Use Classes 2.5. Image Classification 2.6. Stratified Random Sampling 3. Results 3.1. Study Area 3.2. Land Use/Cover Estimation and Mapping 3.3. Land Use/Cover Change Estimation and Mapping 4. Discussion 4.1. Satellite Data for Land Use Estimation 4.2. Land Use/Cover Classification and Change Analysis 4.3. Land Cover Change Analysis 5. Conclusion 5.1. Limitation 5.2. Recommendation
1. Introduction
Globally deforestation and forest degradation are responsible for about 20% of worldwide anthropogenic carbon dioxide emissions emanating from the burning of forest biomass, decay of plant litter and soil carbon [18]. The rate of deforestation and degradation has been exacerbated by the growing demand for land and forest resources for settlement, agriculture, provision of infrastructure and energy - fire wood and charcoal [6].
Tropical forest is mainly being changed into cropland and pasture for the production of soy, beef, palm oil, and timber [16], [10], with the majority of new global agricultural land coming at the expense of tropical forest [9]. Forest cover in the world has been decreasing speedily due to a rising intensity of anthropogenic activities.
Ghana’s deforestation has continuously been deemed as dire since the 1930s. This is attributed to the number of dynamic forces responsible for it [4]. In the Gold Coast era, the colonial masters forest policies of the past, forcefully took forest lands from individual, families and communities for various reasons. The backlash was the peeved individuals and communities resorting to exploiting the forest cover indiscriminately [2]. In the 1960s and 1970s, deforestation was worsened as a result of cultivation of cocoa as an export commodity [7]. In 1981 to 1985 timber exports turned out to be the main driver of deforestation, it was third largest export commodity contributing between 5% and 7% of Ghana’s Gross Domestic Product (GDP), [11]. The country’s annual deforestation rate then was assessed at 1.3%. Since 1990 to 2005 a quarter of Ghana’s total forest cover has been lost. The aggregate anthropogenic sources of deforestation contributed to a reduction of Ghana’s forest cover from 8.2 million hectares to an estimated 0.836 million hectares of forest in 2000, indicating an annual deforestation rate of 2.8% [8]. If this rate is not truncated, a complete disappearance of forests in 25 years will result [5].
Agricultural activities are estimated to be accountable for about 80% of deforestation globally. In Africa, fuel wood gathering for firewood and charcoal making, and, to a lesser extent, livestock grazing in forests are the major drivers of forest degradation. Indirect causes are complex connections of social, economic, political, cultural and technological processes that affect the direct drivers to cause deforestation or forest degradation [1]; [3]; [12]; [13]. They act at multiple scales: international (markets, commodity prices), national (population growth, domestic markets, national policies, governance) and local circumstances (subsistence, poverty).
The utilization of Remote Sensing method in monitoring the changing pattern of forest cover is very incisive and efficient. Remote sensing offers some of the most precise means of assessing the magnitude and pattern of changes in forest cover over a period of time [15]. Satellite data provides an important means in forest change detection studies because of the periodic and coverage of the satellites at relatively short intervals [14].
The focus of this study is to estimate, classify and map the forest cover and land use change over a twenty year period between 1990 and 2010 in the Western Regions of Ghana.
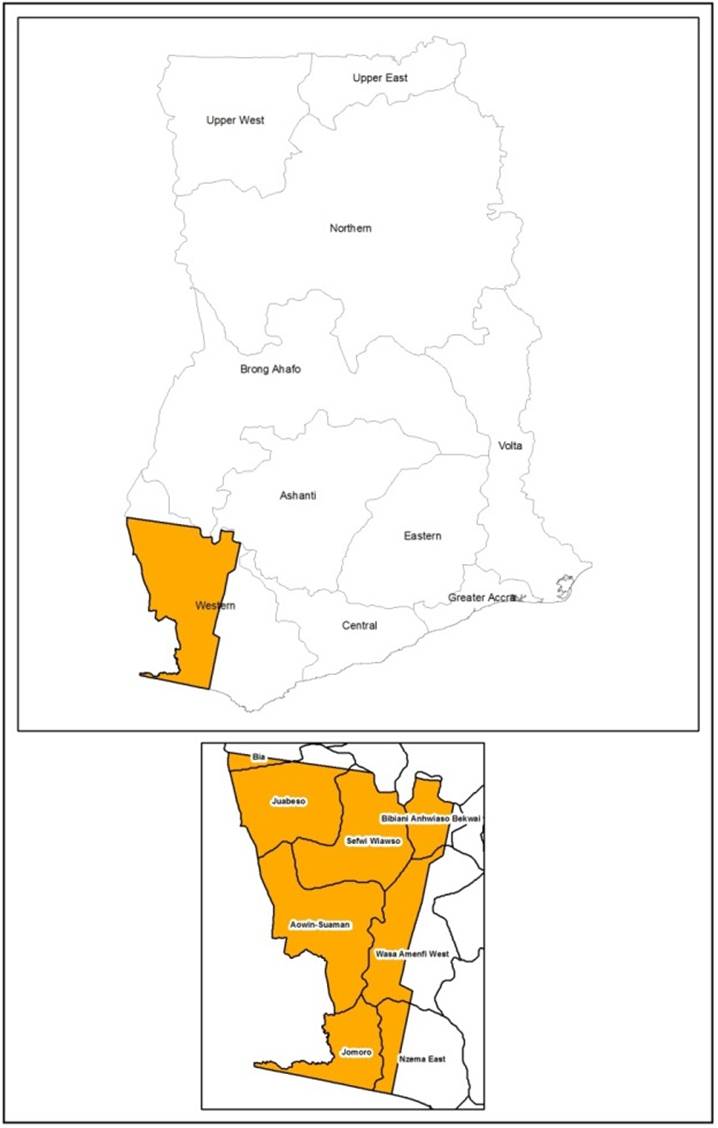
Figure 1. Study Area.
2. Methodology
2.1. Study Area
The Western Region occupies an area of 2,391 km2, which is approximately 10% of Ghana’s land size. 75% of its vegetation is within the high forest zone of Ghana [19].
The Western Region is the largest producer of Ghana’s two premium plant exports products, cocoa and timber. It ranks second to the Ashanti Region in terms of gold production in the country. It has much gold reserves which have not been fully exploited and has the potential to become the highest producer of gold in Ghana in the foreseeable future. It has large quantities of bauxite as well [19]. The region has the largest and only economically viable rubber plantation in the country. Commercial productions of vegetable oil palms such as coconut and palm oil, both of which have the potential of rivaling cocoa, are most actively pursued in this region. The Western Region lies in all the forest zones such as Deciduous, Moist Evergreen and Wet Evergreen. The following districts fall within the study area (Figure 1), Bia, Juabeso, Jomoro, Aowin-Suaman, Sefwi Wiawso, Nzema East, Bibiani-Ahwianso and Wasa Amenfi.
2.2. Materials
Satellite images and reference data employed for this study were obtained from the Forestry Commission of Ghana, under the Forest Preservation Program (FPP-Ghana) 2011/2012.
Table 1. Remote sensing images.
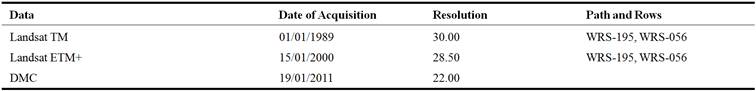
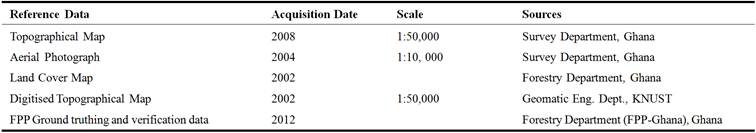
Table 2. Reference data.
2.3. Image Processing
The study concentrated on the forest and land use change for the epoch periods 1990, 2000 and 2010 covering twenty (20) years. The time series of ten years (10) apart from 1990 to 2000 and then 2000-2010 were under consideration. For the following the epoch scenes were chosen as follows: Landsat TM 1989 for Epoch 1990; Landsat ETM+ 2000 for Epoch 2000 and DMC 2011 for Epoch 2010. ERDAS Imagine 9.1 was used to perform image processing which included the following processes: pre-processing, image classification, accuracy assessment, and production of a change map. Idrisi 17.0 Selva Edition was used LMC analysis. ARCGIS 10.0 was used to produce the output maps.
2.4. Land Use Classes
The following land use/cover classes were distinguished:
Forest: This contains all land with woody vegetation consistent with measurements used to outline Forests in the national greenhouse gas inventory. Agriculture: This indicate cropped land, including rice fields, and plantation where the vegetation structure falls below the thresholds used for the Forest Land category. Built-Ups: These portray all developed land, including social utilities such as transportation infrastructure (roads and highways), built up areas, bare grounds and human settlements of any size. Water: These include lands that are covered or saturated by water for all or part of the year It also includes reservoirs and natural rivers and lakes.
2.5. Image Classification
This study utilized post-classification change detection to identify forest and other land changes that have occurred. This technique is dependent on two thematic maps of different dates to detect changes; Image Classification was undertaken to extract thematic information from the images.
Using the reference data (Table 2). fifty (50) training sites signifying the various land use/cover classes (Forest-10, Agriculture-20, Built-Ups-15 and Water-5) were digitized on the individual images using the AOI tool and named accordingly in the signature editor of ERDAS imagine 9.1. After classification, the 50 classes were recoded into the various classes via the Image Interpreter/GIS Analysis/Recode tool in ERDAS Imagine 9.1. The 10 forest classes were recoded as one and given the colour deep green, the 20 Agriculture Classes recoded as Class two and assigned the assigned colour yellow; the 15 Built-Ups classes recoded as three and given colour Maroon and the 5 classes of water recoded as 4 and given colour blue.
One hundred and twenty (120) reference points from the FPP-Ghana field interpretation and verifcation data were used to assess the accuracy of the classified images. This study evaluated the accuracy of the classified images from the matrix generated. Calculation of areas in hectares of the resulting land cover types for each study year was carried out subsequently.
2.6. Stratified Random Sampling
Stratified random sampling was used in the selection of the training sites for the supervised classification. Stratified random sampling is using expert knowledge, the field area is distributed into strata that maximize the differences between units, and minimize the variation within each unit. One or more strata selected are estimated to be main drivers of the system under observation. A random sample is then drawn from each stratum or unit. When known differences exist between the strata, stratified random sampling with balanced allocation can every now and then provide improved estimation without adding bias [17]. The biggest merit using stratified random sampling is that, it produces results that are both largely unbiased and accurate. Stratified often produces data that is more representative of the entire population because of the special attention it pays to the smaller subgroups within the population. It is also the best way to obtain results that reflect the diversity of the population in question. This advantage makes stratified sampling much more effective than simple sampling for large and diverse populations as the terrain in portrayed.
3. Results
3.1. Study Area
Figures 2, 3 and 4 are subset images extracted from 1990 epoch (Landsat TM 1989), 2000 epoch (Landsat ETM+ 2000) and DMC 2010 respectively. They show the same area that are cloud free and are of interest to this study.
Figure 2. TM 1990.
Figure 3. ETM+ 2000.
Figure 4. DMC 2010.
3.2. Land Use/Cover Estimation and Mapping
Supervised classification used in this study created three land use cover maps from the three multi-temporal images – 1990 TM, 2000 ETM+ and 2010 DMC. The Study Area was categorised into four main land use/cover classes as described in section 2.4. The resultant land cover maps are shown in figures 5, 6 and 7.
The table 3 displays the extent of the area of the individual land cover categories in hectares (ha) and the percentage they occupied.
The land use/cover map for 1990 epoch (Figure 5) showed the study area to be very green especially at the middle and southern part. Forest LU is the dominant feature at 68% of the land cover is forest (Table 3 and Figure 6). The agriculture’s share is the next in rank at 30%. The scattered Built-Ups share is only 2%. The Bia National Park, Yoyo, Dadiaso Disue River, Krokosua, Muro, Sui River, Suhuma, Tano Suhien, Anwiaso West, Afao Hills, Boin River, Disue River, Yoyo, Bodi, Sue River, Tano Nimri, Tano Anwia, Jema Assamkrom, Fure Headworks, Fure River, Ninisuhein, Ankasa, Draw River, Totua Shelterbelt, Mamri, Tano Suraw, Afao Hills, Anwiaso Extension and Totua Shelterbelt are relatively intact with limited disturbance. Water share is under 1%.
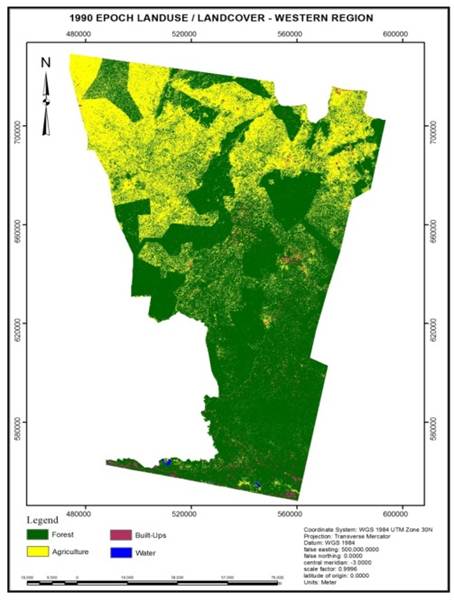
Figure 5. Land use Map-1990.
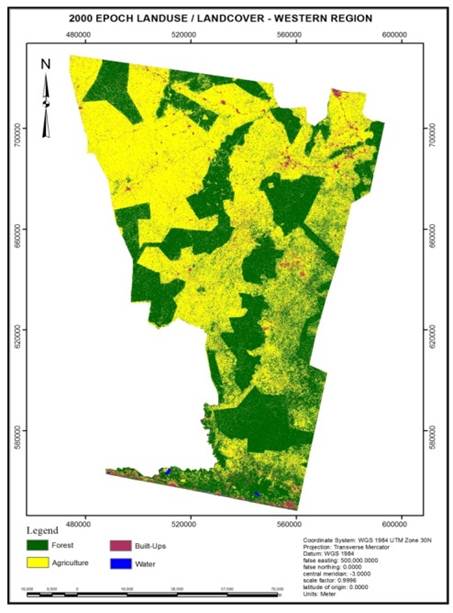
Figure 6. Land use Map-2000.
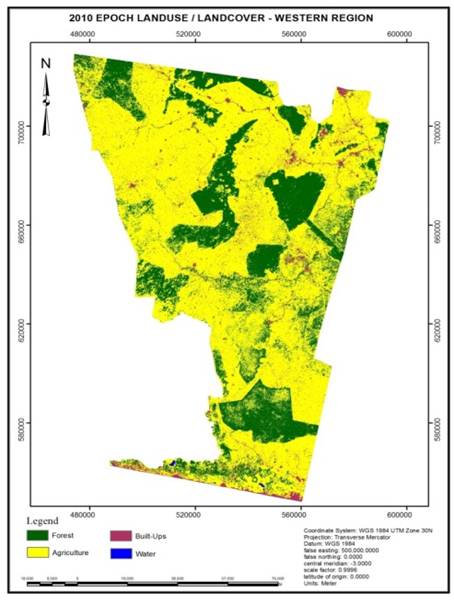
Figure 7. Land use Map-2010.
The land use/cover map for 2000 epoch (Figure 6) revealed a very disturbing scenario. Forest had now been reduced to 44% (Table 3 and Figure 6) from 68% in the 1990 epoch map. Agriculture is now the highest ranked at 50% at the expense of forest cover. The scattered settlements share had increased marginally at 4%. The Reserves in the scene are relatively intact with slight disturbance. Water share is still under 1%.
The land use/cover map for 2010 (Figure 7) exposed a disheartening scenario. Forest had now been decreased from 44% to 27% (Table 3 and Figure 6). Agriculture’s share of the LU is still the highest rank at 70% from 50% in the 2000 epoch map. The scattered settlements shares remain steady to 4.23%. The Portected Reserves in the Study Area have now seen serious encroachment and disturbance. Water share is still remains under 1%.
Accuracy assessment undertaken on the 2010 DMC image classification and an assessment report was generated in an error matrix, and a Kappa statistics. An overall classification accuracy of 79.17% was attained. 0.6516 as the overall Kappa statistics was achieved. The Forest Preservation Program – Ghana (FPP-Ghana) Ground truthing and verification data was used for this activity. Topographical Map, Aerial Photograph, Land Cover Map, Digitized Topographical data photographs, data and reference points from statutory bodies such as the Forestry Commission and Survey Department.
Additionally (Table 2) were employed in accuracy assessments for 1990 epoch TM and the 2000 epoch ETM+ images accuracy results not less than 80% and 0.7 for Classification accuracy and Kappa Statistic respectively were achieved.
Table 3. Land use/cover estimation (Ha).
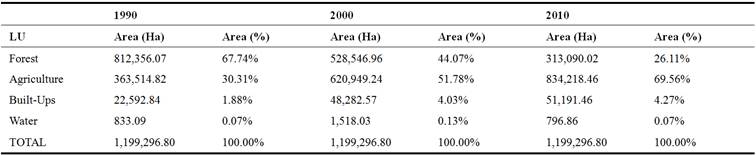
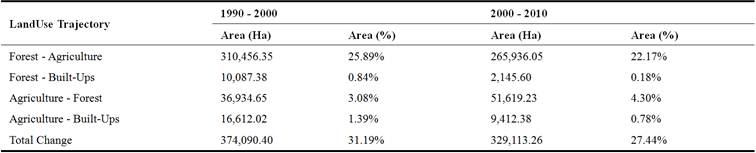
Table 4. Change Trajectory 1990-2000 and 2000-2010.
3.3. Land Use/Cover Change Estimation and Mapping
The table 4 displays the magnitude of change in the land cover categories in hectares (ha) and their percentages for 1990-2000 and 2000-2010. Figure 8 show the changes that have occurred. An area of 374,090.40 ha representing 31% of the areas of 199,296.80 ha had undergone change for the period 1990 – 2000. The biggest change recorded was forested land giving way to agriculture at a quarter of per cent. A marginal gain forest gain was observed as agricultural land had also been converted in Forests at 3%. Agricultural land gave way to Settlement at 1.39%, while forests lost out to Built-ups by approximately 1%.
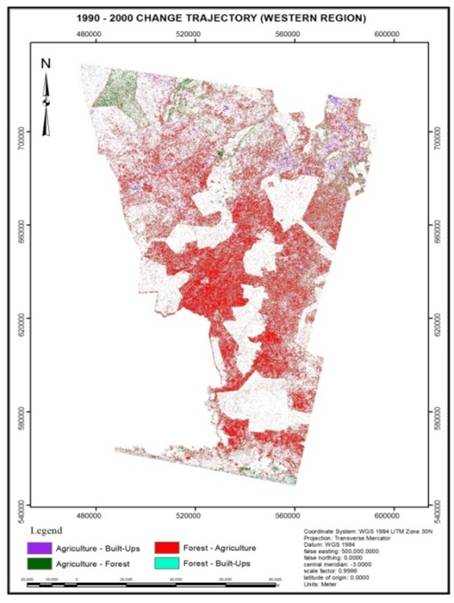
Figure 8. Change Trajectory 1990-2000.
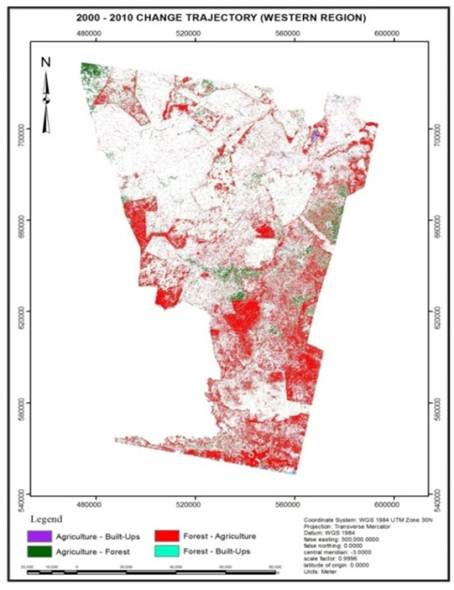
Figure 9. Change Trajectory 2000-2010.
Figure 9 display the changes that have occurred on 27.44% of analysed area (329,113.26 ha out of the 199,296.80 ha total area) between 2000 and 2010. Forested land gave way to agriculture at 22.17% and was deemed to be the biggest change. Agricultural land was converted into forested land was reckoned as the second biggest change at less than 5%. Forest lost out to Built-Ups at less than 1%. Agriculture gave way to Built-Up at 0.78%.
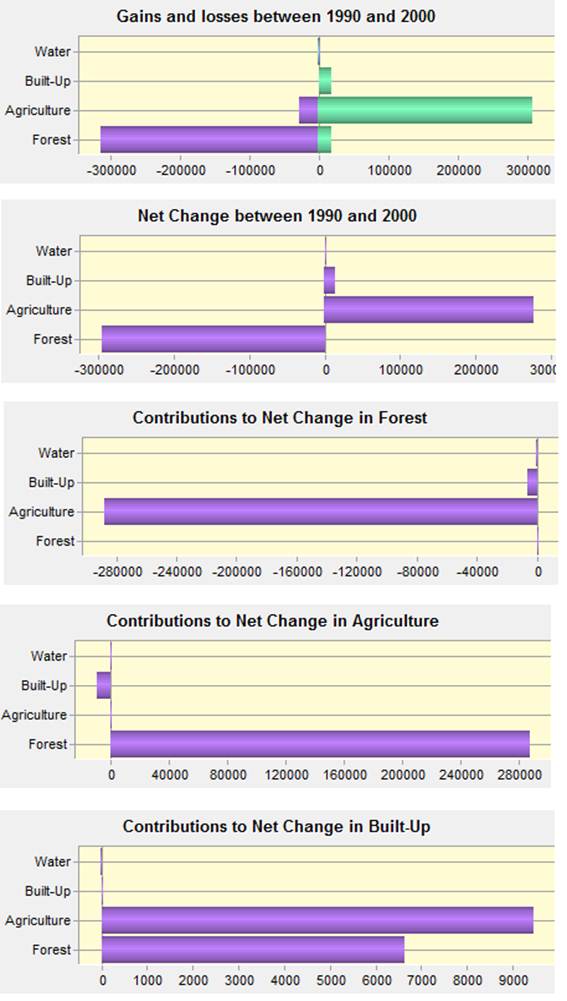
Figure 10. Trend Analysis 1990-2000.
The LCM model in Idrisi generated from 1990 – 2000 and 2000 - 2010 change trajectory maps are shown in Figures 10 and 11. The figures reveal the degree of changes (Gains + and Losses) in the study area resulting from the land cover conversions. It can be deduced that with the exception of water all other land cover classes experienced some form of transition either gain or loss. Forests lost out heavily mostly to Agriculture and Built-Ups gained from Agriculture (mostly) and from Forests.
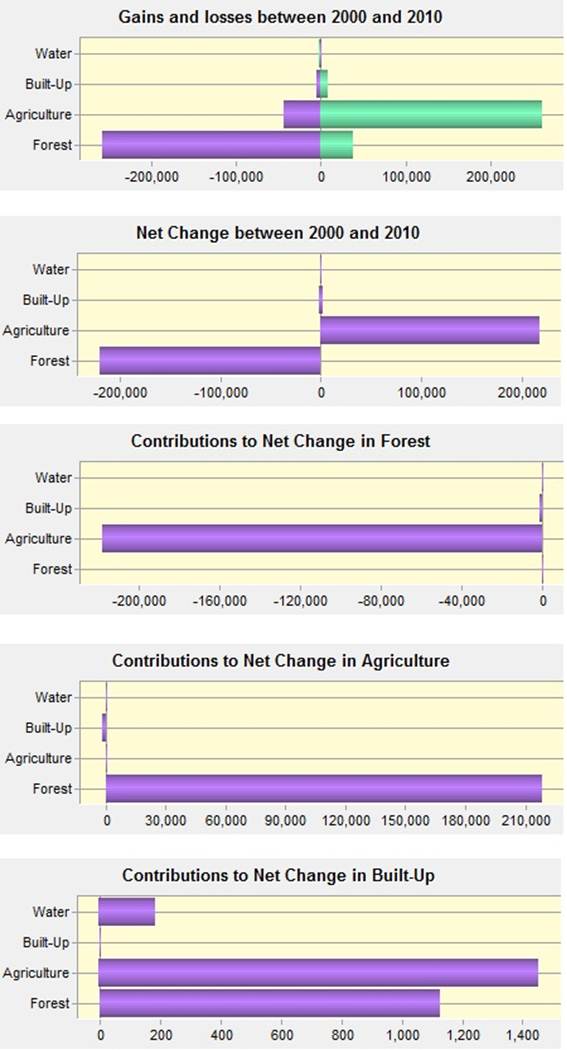
Figure 11. Trend Analysis 2000-2010.
These revealed that, forest loss was extensive.
4. Discussion
4.1. Satellite Data for Land Use Estimation
The Landsat program by the United States has provided a continuous data source for remote sensing studies in Africa. However, images procured in the tropics are mostly cloud covered. It is difficult to specify an exact date for data acquisition and processing, when you cannot guarantee whether it would be cloud free or not.
There were some serious challenges as regards to image acquisition for the exact years 1990 and 2010 for the Western region. All the available 1990s and 2010 images had cloud cover of more than the acceptable 10%. This was resolved by the employment of 1989 Landsat ETM+ for epoch 1990. For the year 2010, DMC image was used as there were not Landsat images for the period of study that had less than 10% cloud cover. All the images (Landsat TM, Landsat ETM+ and DMC) were re-sampled to 30 x 30 meter pixel resolution to make accurate analysis of the datasets and comparability possible.
Using remote sensing data for forestry studies over large area is very efficient, less time consuming and comparatively cheaper as compared to other methods of forest inventory methods. But the cost of getting the requisite satellite data for such studies is a big challenge for researches in Africa as the cost of satellite images is high. Governments of Sub Saharan African countries have not invested in satellite technology. Researchers in Africa thus mostly rely on Landsat images (which are free) and donor funded studies such as the Forest Preservation Program – Ghana (FPP-Ghana) which is funded by the Government of Japan to provide data and other resources to fund remote sensing studies. These projects/programs come with their specified satellites images which might not necessarily address some of the concerns of the benefitting country.
4.2. Land Use/Cover Classification and Change Analysis
The overall accuracy attained Western Region for land use cover maps 2010, 2000 and 1990 were 79%, 80% and 85.0% respectively. The statistics was very satisfactory and the accuracy very high for a terrain that, had many mosaic agricultural land ranging from tree crops such as cocoa, cashew, citrus, Palm; shrubs and herbaceous plants. Stratified random samplings employed ensured that, all the mosaic substrata were all duly represented and classified accordingly.
The overall kappa statistics obtained for 2010, 2000 and 1990 land cover maps for ranged between 0.651 and 0.755 respectively. So the results obtained in the described analysis are of strong to moderate agreement what allows for performing further analysis and formulating valid conclusions.
The land use/cover for 1990, 2000 and 2010 showed forest loss increasing from year to year. Forest loss through deforestation is observed mostly outside of the designated national forest reserve or protected area. The forests outside the forest protected areas had been converted into agricultural land. Degradation of the forests is observed in the protected areas as logging, farming encroachment and illegal mining is seen in the protected areas.
4.3. Land Cover Change Analysis
From 1990 to 2000, 31% and 27.% for 2000-2010 respectively of the Western Region landscape had undergone intense changes which are attributable to anthropogenic activities. The Change maps (Figure 8 – 9) show the distribution of exchanges in the land use cover classes revealing the location of changes. It can be concluded from the figures that changes occurred all over the study area with most of the changes occurring close to built-up areas indicating the influences of human activities on the land cover and increased agricultural activities. Forests which used to be the dominant land use/cover class have now been lost to Agriculture.
Deforestation and degradation in the study area has been aggravated by the growing demand for land mostly for agricultural purposes (Cocoa production), and forest resources (timber) for settlement, provision of infrastructure and energy - fire wood and charcoal. This finding is supported by a study conducted by [6]; [5] & [1].
5. Conclusion
This study used the integration of Remote Sensing and GIS to analyze and quantify the land cover changes (amount, trend and location) that have occurred within the period of 1990 and 2010 in the Western Region.
Standardized digital remote sensing classification techniques were used to produce land use/cover map. A hierarchical level I land use and land cover classification which consist of Forest, Agriculture, Water and Built-ups were utilized. The final classification accuracy was determined to be good by means of standardized accuracy assessment measures.
The application of Landsat multi-temporal images and DMC to identify land cover types in the study area was done successfully and proved inexpensive to detect land cover changes at such a large-scale level.
Within an investigated period of twenty (1990-2010) years, the land cover had been changed so much mainly by the clearing of forest land for agricultural use, expanding human settlements (population pressure), logging, fuelwood for cooking and mining.
5.1. Limitation
Challenges with satellite data availability for the exact years impacted the study. More cloud free satellite images for the areas of study would have been much better.
5.2. Recommendation
The twenty-year time span, 1990 - 2010, deliberated in this study is comparatively a short increment of time in a long history of land use underlying forces, but even then the changes were profound. This means that changes in the tropics are much faster than other parts of the world.
To have forests in the foreseeable future in the Western Region, major intervention and deliberate steps must be taken. All efforts must be spent at salvaging what is left of our forest.
References
- Abay, T. (2014). Factors Affecting Forest User’s Participation in Participatory Forest Management; Evidence from Alamata Community Forest, Tigray; Ethiopia. Retrieved from http://opendocs.ids.ac.uk/opendocs/handle/123456789/4227
- Agbosu, L. K. (1983). The Origins of Forest Law and Policy in Ghana during the Colonial Period. Journal of African Law, 27 (02), 169–187. Retrieved from http://journals.cambridge.org/abstract_S0021855300013218
- Aragão, L. E. O. C., Poulter, B., Barlow, J. B., Anderson, L. O., Malhi, Y., Saatchi, S., & Gloor, E. (2014). Environmental change and the carbon balance of Amazonian forests. Biological Reviews, n/a–n/a. doi: 10.1111/brv.12088.
- Benneh, G. & Agyepong, G. T. (1990). Land Degradation in Ghana, London: Commonwealth Secretariat/University of Ghana.
- Boafo, J. (2013). The Impact of Deforestation on Forest Livelihoods in Ghana | Africa Portal. Retrieved September 12, 2014, from http://www.africaportal.org/articles/2013/01/16/impact-deforestation-forest-livelihoods-ghana#chapter%3C?phpprint$chapter;?%3E
- Bond I, Chambwera M, Jones B, Chundama M, Nhantumbo I (2010). REDD+ in dryland forests: Issues and prospects for pro-poor REDD in the miombo woodlands of southern Africa, Natural resource Issues No. 21. London. International Institute for Environment and Develop-ment, pp. 83.
- Dei, G. J. S. (1992). A forest beyond the trees: Tree cutting in rural Ghana. Human Ecology, 20 (1), 57–88. doi: 10.1007/BF00889696.
- EPA-Environmental Protection Agency (2004). Ghana State of the Environment Report, EPA Ghana, Accra. Pp 11-51.
- Gibbs, H. K., Ruesch, A. S., Achard, F., Clayton, M. K., Holmgren, P., Ramankutty, N., Foley, J. A (2010). Tropical forests were the primary sources of new agricultural land in the 1980s and 1990s. Proceedings of the National Academy of Sciences, 107: 16732-16737.
- Hosonuma, N., Herold, M., De Sy, V., De Fries, R. S., Brockhaus, M., Verchot, L., Angelsen, A., Romijn, E. (2012). An assessment of deforestation and forest degradation drivers in developing countries. Environ. Res. Lett. 7, 044009 (12 pp) http://dx.doi.org/10.1088/1748-9326/7/4/044009.
- IIED - International Institute for Environment and Development (1987). Our common Future: A readers Guide, London: Earthscan.
- Jabbour, J., & Hunsberger, C. (2014). Visualizing Relationships between Drivers of Environmental Change and Pressures on Land-Based Ecosystems. Natural Resources, 05 (04), 146–160. doi: 10.4236/nr.2014.54015.
- Kalema, V. N., Witkowski, E. T. F., Erasmus, B. F. N., & Mwavu, E. N. (2014). The Impacts Of Changes In Land Use On Woodlands In An Equatorial African Savanna. Land Degradation & Development, n/a–n/a. doi: 10.1002/ldr.2279.
- Mas, J. F. (1999). Monitoring land-cover changes: A comparison of change detection techniques. International Journal of Remote Sensing, 20 (1), 139–152. doi: 10.1080/014311699213659.
- Miller, J. H. (1998). Active nonlinear tests (ANTs) of complex simulation models. Management Science 44 (6): 820-830.
- Rudel, T. K., Defries, R., Asner, G. P., & Laurance, W. F. (2009). Changing drivers of deforestation and new opportunities for conservation. Conservation Biology : The Journal of the Society for Conservation Biology, 23 (6), 1396–405. doi: 10.1111/j.1523-1739.2009.01332.x.
- Snedecor, G, W. & Cochran, W. G. (1989), Statistical Methods, Eighth Edition, Iowa State University Press.
- van der Werf, G. R., Morton, D. C., DeFries, R. S., Olivier, J. G. J., Kasibhatla, P. S., Jackson, R. B., Collatz, G. J. & Randerson, J. T. (2009). CO2 emissions from forest loss. Nature Geoscience 2 (11): 737–738. doi: 10.1038/ngeo671.
- www.ghana.gov.gh


