Journal of Environment Protection and Sustainable Development, Vol. 1, No. 3, July 2015 Publish Date: Jul. 28, 2015 Pages: 182-192
Monitoring the Dynamics and Post-Fire Recovery Processes of Different Vegetation Communities Using MODIS Satellite Images
Nataliya Stankova*, Roumen Nedkov
Department of Aerospace Information, Space Research and Technology Institute, Bulgarian Academy of Sciences, Sofia, Bulgaria
Abstract
The aim of this study is to monitor the recovery process after fire on the basis of satellite data. The test area is located in the south-east part of Bulgaria, Haskovo region, where a significant fire took place in the summer of 2007. The burnt area was determined by means of Terra MODIS imagery. The affected area and the recovery processes of the different vegetation communities were examined for the period 2007 – 2014. To achieve this goal, NDVI and PVI were generated in the middle of June once every year during the examined period, using MODIS on-board Terra and Aqua satellites. To assess the dynamics of the different vegetation communities, the burnt area was divided to several classes - broad-leaved forests, coniferous forests, mixed forests, pastures, transitional woodlands and shrubs. NDVI values for each class were generated to assess and monitor the post-fire vegetation status of the different communities for the whole study period. Climate data were also acquired and analyzed in GIS for that period, in order to understand the dynamics of the vegetation status and the rates of the recovery process after the disaster.
Keywords
Fire, Remote Sensing, Post-Fire Regeneration, NDVI, PVI, GIS
Received: June 17, 2015
Accepted: July 10, 2015
Published online: July 27, 2015
@ 2015 The Authors. Published by American Institute of Science. This Open Access article is under the CC BY-NC license. http://creativecommons.org/licenses/by-nc/4.0/
1. Introduction
Wildfires occur in many parts of the world, often going unnoticed unless they have significant socio-economic or climatic impact. They are usually recognized as a hazard, especially in managed and populated regions where they can cause loss of life and property, and severe economic damage. But they are in fact important natural ecosystem processes with significant implication in the climate system. Their suppression is now recognized to have created far greater fire hazard than in the past and to have disrupted natural plant succession and wildlife habitat in many areas.
Since fires occur on scales ranging from local to regional, especially in inhospitable regions, and require to be monitored and mapped on a global scale, remote sensing is an ideal tool and plays an important role at four different levels: prediction, monitoring, burnt-area mapping and regeneration. Monitoring the regeneration of burned areas is slightly more difficult than just identifying them, mainly because of the small scale of the regrowth in relation to the total area, and also because the change in signature may be very subtle, at least initially. Regeneration in partly burned areas may be quite difficult to see [Jones and Vaughan, 2010].
Postfire studies have been carried out by several authors with diverse objectives, being the use of vegetation indices the common factor in their methodologies [Viedma et al., 1996]. Vegetation indices are usually dimensionless measures derived from radiometric data that are primarily used to indicate the amount of green vegetation present in a view [Jones and Vaughan, 2010]. Vegetation indices have become a valuable tool to monitor and access vegetation status.
In this paper we use the Normalized Difference Vegetation Index (NDVI) [Rouse et al., 1973; Tucker, 1979] in order to assess and monitor the dynamics of the phytocenoses for the study period after the disaster. Although NDVI is one of the oldest, it is one of the most frequently used vegetation indices. It is defined by the following equation:
![]() (1)
(1)
where ρNIR and ρRED indicate the reflectance of the near infrared and red bands, respectively.
The spectral behavior of vegetation in the visible and near infrared region in contrast to soils justifies the use of NDVI in vegetation cover discrimination. In addition, NDVI partly normalizes the influence of external factors in the canopy reflectance, i.e. the errors associated with illumination fluctuations or atmospheric scattering [Holben et al., 1986].
In the cases when there is high frequency of fires, as it is noted in the examined area, the ecosystem could not fully recover its nutrient reserve. The long term post-fire effects in our latitudes and climatic conditions result in a gradual reduction of the nutrient reserve of the soil, slowing down the recovery of the vegetation, increasing erosion, which in turn lead to irreversible desertification processes [Boerner 1982; Schlesinger et al., 1990; Carreira et al., 1994]. Studies about post-fire changes in soil in the region of Svilengrad, showing that surface fires in coniferous forests cause more severe changes in the indicators and soil properties in comparison with crown fires in deciduous trees [Velizarova et al., 2001a,b]. Gradually reducing of degradation processes have been established about 3 years after the fire occurrence [Topalova and Velizarova, 2005].
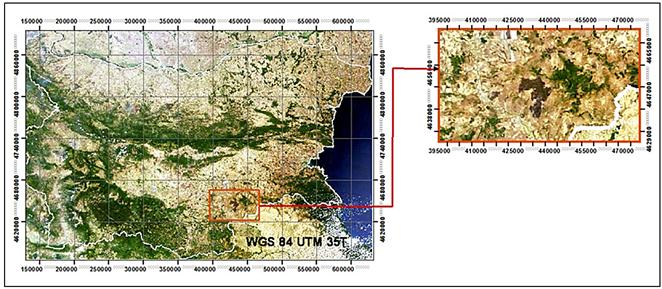
Figure 1. National boundary of Bulgaria and the location of the burnt area – Terra MODIS imagery, acquired on 29/07/2007, 1-4-3 bands.
2. Study Area
The study area is located in the south-east part of Bulgaria, Haskovo region, where a significant fire took place in the summer of 2007 [Stankova and Nedkov, 2015] (Fig 1). As a result of heat and dry climate several large fires occurred between the middle of July and September on the territory of the Balkans [Nedkov et al., 2008]. The location and the perimeter of the burnt area have been determined by means of Terra MODIS imagery in 7-2-1 bands (Fig. 2). The fire affected a total of 114 km2.The study area is bounded by the coordinates Xupper left = 4651600m – Xlow right = 4634000m, Yupper left = 424000m – Ylow right = 438200, UTM 35T. The region has a total length of 17.6 km and a width of 14.2 km. The elevation of the area ranges between 108 and 627 metres.
The region manifests moderate continental climate with a strong Mediterranean influence which is characterized primarily with higher annual average temperatures and hot dry summers. The annual average temperature in the plain areas is 12оС and the annual average precipitation ranges between 540 mm and 650 mm [NIMH-BAS, 1982].
This area is especially prone to forest fires. In the recent years the number of fires and the perimeter of the areas destroyed by fires have reached critical levels and have no equivalent in the history of forestry in Bulgaria [Dimitrova et al., 2011].
According to the Habitats Directive [Habitats Directive, 92/43/EEC] the study area is located in the protected area Sakar and half of the study area is included in a protected area also called Sakar this time according to the Birds Directive [Birds Directive, 2009/147/EC].
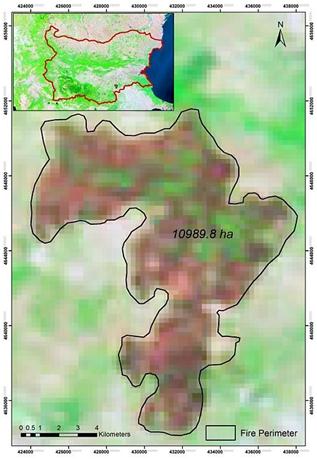
Figure 2. The burnt perimeter – Terra MODIS imagery, acquired on 25/07/2007, 7-2-1 bands.
The principal vegetation in this area consists of pastures, shrubs, agricultural lands and forests. The forests are heterogeneous formations composed mainly of different types of oak trees - Quercus cerris L., Quercus frainetto, Querceta pubescentis, Quercus virgilianae. The other forest formations include Querceto-Carpineta betuli forests and Carpinus orientalis. The shrubs consist mainly of Paliurus spina-christi. The pastures comprises of xerothermic grasslands dominated by Dichantieta ischaemii, Poaeta bulbosae, Jasminum fruticans L., Ephemereta [Bondev, 1991].
3. Data and Methods
Miettinen [2007] reports the use of MODIS, which has four suitable bands with resolutions of 250 or 500 m. He found that bands 1, 2, and 7, as indices or combination of indices, were the most sensitive when green vegetation and soil dominate, band 5 alone showed good separation and could not be bettered by any multiband index.
In this paper we use several Terra and Aqua MODIS images from 2007 to 2014 with resolution 250 m [29]. The imagery acquisition was performed taking into account the period of the year with the most vegetation and the absence of clouds. The dates of the images are shown in (Tab 1).
Table 1. MODIS images used to derive NDVI.
| 22/06/2007 | 22/06/2009 | 21/06/2012 |
| 25/07/2007 | 21/06/2010 | 22/06/2013 |
| 19/06/2008 | 21/06/2011 | 23/06/2014 |
The images are composition of bands 7, 2, and 1 (Tab. 2).
Table 2. MODIS bands used for image composition.
| № Band | λ, µm | Spatial Resolution, m |
| B1 | 0.620 – 0.670 | 250 |
| B2 | 0.841 – 0.876 | 250 |
| B7 | 2.105 – 2.155 | 500 |
After the acquisition, the images were georeferenced in UTM 35T. Then the burnt area was extracted and NDVI was calculated for the recovery monitoring:
![]() (2)
(2)
where ρband2 and ρband1 indicate the reflectance of the near infrared and red bands, respectively.
Input data from GPS measurements and classification and layers from the Corine Land Cover 2006 (CLC 2006) [Soukup, 2007] were used in order to define the different vegetation types as test areas and to find their boundaries. The classes used from CLC are the following: broad-leaved forests, coniferous forests, mixed forests, pastures, and transitional woodlands and shrubs. Then the average NDVI for the whole area and the different vegetation were calculated, which represents the status and dynamics of plant communities for the corresponding year.
Typical points for the different types of forests were defined and the reflection in different bands was determined (Tab. 3) [Dimitrova and Nedkov, 2014]. Thus, graphs of spectral reflectance curves for the selected areas with deciduous, coniferous and mixed forests were plotted (Fig. 7).
Table 3. MODIS bands and their average wavelength used for the graphs of the spectral reflectance curves.
| № Band | 3 | 12 | 4 | 1 | 2 | 5 | 26 | 6 | 7 |
| λ, µm | 0.47 | 0.55 | 0.56 | 0.65 | 0.86 | 1.24 | 1.38 | 1.64 | 2.13 |
Scatter diagrams [Lillesand et al., 2007] showing the relationship between near infrared and red reflectance for each year of the study period were generated (Fig. 8) in order to assess the dynamics of the vegetation of the whole burnt area.
Perpendicular vegetation index (PVI) [Richardson and Wiegand, 1977] was also calculated (Fig. 8). The PVI is interpreted geometrically as the perpendicular distance of a pixel vector from the soil line in an NIR versus red reflectance space [Schowengerdt, 2007]. It is defined by the following equation:
![]() (3)
(3)
Raw climate data were also acquired [30] and analyzed in GIS for the examined period. The range of climate data covers the entire period of study. Data for the temperature (TAV), precipitation (RRR) and evapotranspiration sum (ETO) for June were derived from the climate data for the corresponding year. Based on these monthly data, the average monthly air temperature, average monthly precipitation and average monthly evapotranspiration sum were obtained for the study area.
Aerial images from 2011 were also used for verification and validation of the methodology. Fig. 3 shows the methodology followed in this study.
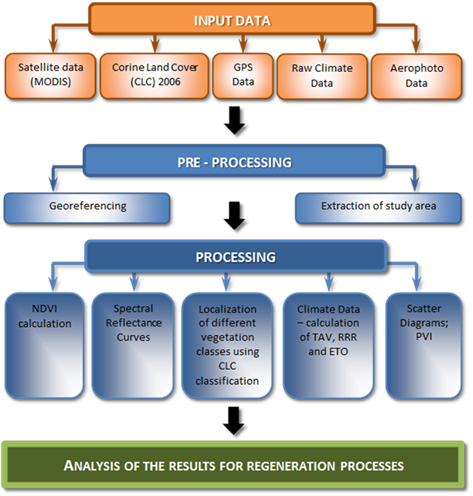
Figure 3. Flow diagram of the methodology followed in this study.
4. Results
4.1. Normalized Difference Vegetation Index (NDVI)
In order to monitor the regeneration process after the fire, NDVI was generated in the middle of June once every year on the territory of the whole burnt area for seven years period. NDVI layer was color coded to better visualize vegetation coverage (Fig. 4). Fig. 4b shows the low NDVI values a few days after the fire of almost the whole selected area excluding the forest areas. One year after the fire occurrence (Fig. 4c), NDVI approached even higher values than the values before the fire (Fig. 4a). This may be due to the fact that after the fire plant communities can be substituted by new invasive species as a result of the variety of secondary effects that occurred [Thomas and Davis 1989; Hilty et al. 2004]. NDVI reaches its highest values in 2010 – on the third year after the fire. The fluctuation ranges of the index are narrow due to the influence of external factors such as air temperature, precipitation, etc. which accompany the regenerative process.
|
22/06/2007; |
25/07/2007 |
19/06/2008; |
|
22/06/2009; |
21/06/2010; |
21/06/2011; |
|
21/06/2012; |
22/06/2013; |
23/06/2014. |
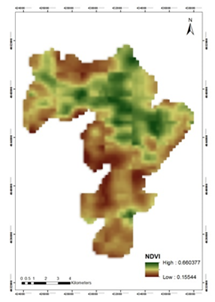
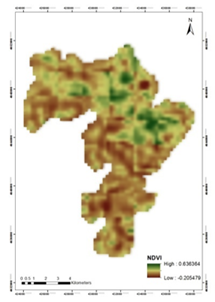
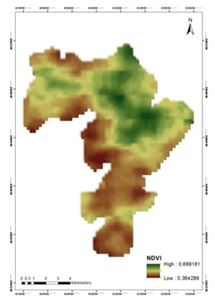
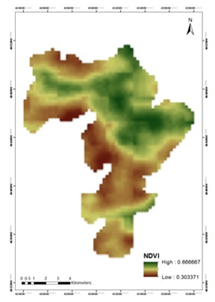
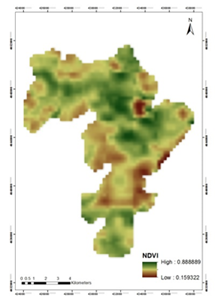
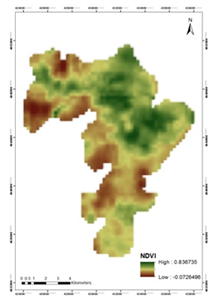
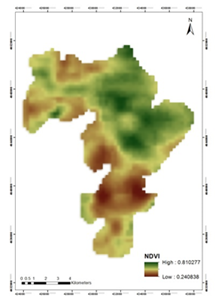
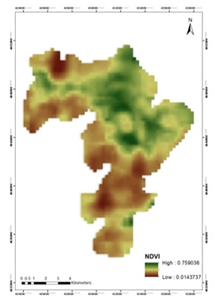
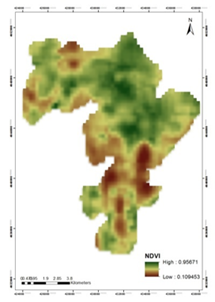
Figure 4. NDVI images of the burnt area – a month before the fire (a), a few days after the fire (b), one year after the fire (c), 2 years after the fire (d), 3 years after the fire (e), 4 years after the fire (f), 5 years after the fire (g), 6 years after the fire (h), 7 years after the fire (i).
|
deciduous forests; |
coniferous forests; |
|
mixed forests; |
pastures; |
|
transitional woodlands and shrubs. |
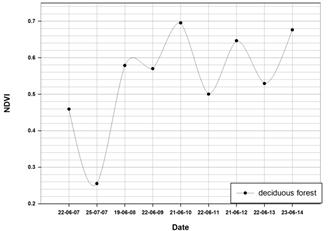
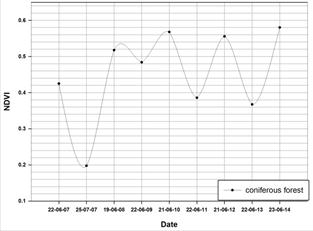
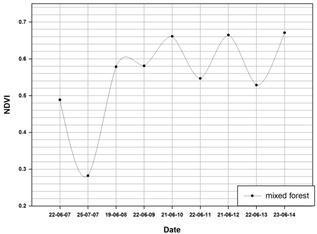
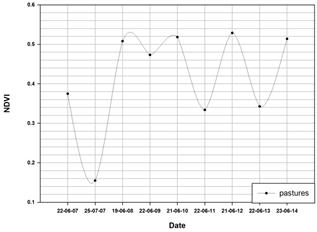
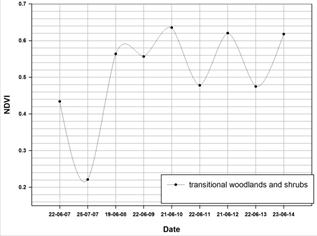
Figure 5. Average NDVI values for deciduous forests (a), coniferous forests (b) , mixed forests (c) , pastures (d) , and transitional woodlands and shrubs (e) during the examined period - one year before and seven years after the fire.
In order to assess the dynamics of the different vegetation communities, the burnt area was divided to several classes - broad-leaved forests, coniferous forests, mixed forests, pastures, and transitional woodlands and shrubs. The average NDVI values for each class were extracted in order to assess and monitor the post-fire vegetation status of the different communities for the whole study period (Fig. 5).
It is obvious that the NDVIs of the different vegetation classes follows one and the same trend during the years differing only in their values. Deciduous forests exhibit higher NDVI values (Fig. 5a) and tend to regenerate faster in comparison to coniferous forests (Fig. 5b). The predominant species in the mixed forests are the broad-leaved trees, which makes the curve character of the mixed forests very similar to the one of the broad-leaved. The class of the pastures shows the lowest NDVI values (Fig. 5d).
4.2. Climate Data
The average NDVI values were compared with the average monthly temperature, average monthly precipitation, and average monthly evapotranspiration sum for the study area (Fig. 6). For these reasons climate data have been collected and analyzed in GIS for the whole study period. Thus, the trends to change the vegetation, depending on the changes of different climate factor, can be followed [Milanova et al., 2014]. In all diagrams the point corresponding to the fire shows the lowest NDVI values, the highest temperature, the lowest precipitation and the highest evapotranspiration sum. The distribution of the NDVI values of other points is directly dependent on the values of the climate characteristics, which determines the vegetation conditions.
|
a) |
b) |
|
c) |
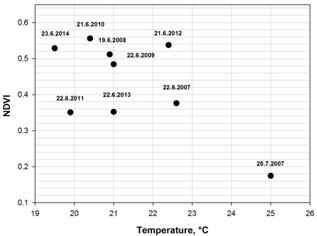
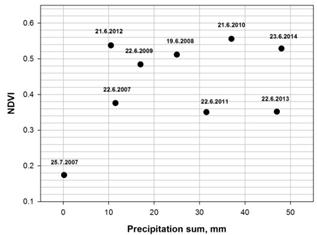
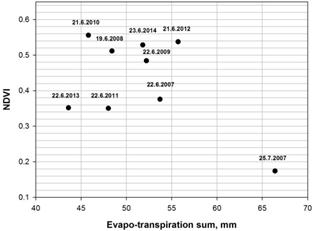
Figure 6. Relationship between NDVI and the average monthly temperature (a), average monthly precipitation (b), and average monthly evapotranspiration sum (c) for the whole study period.
4.3. Spectral Reflectance Curves
Because of the low density of vegetation after the fire, the slope of the red edge is not as steep (Fig. 7b) as it is on the other graphs (Fig. 7a,c,d,e). A gradual change in reflectance of the vegetation in the red-infrared range of the electromagnetic spectrum can be seen (Fig. 7b). Due to the reduction of chlorophyll, the absorption in the red range is significantly less and the spectral reflectance in the near infrared range approaches the spectral reflectance of the soil.
This state of vegetation can also be seen in the scatter diagram (Fig. 8b) which shows that most of the elements of the land cover are situated within the cluster of the soil.
4.4. Scatter Diagrams
Since the changes in the recovery process are very subtle, the dynamics of the ecosystem restoration could be assessed using these scatter diagrams referring to the soil line (Fig. 8) [Milanova and Mateeva, 2014]. The line where the PVI is zero corresponds to the soil line for these images.
It is seen that the Perpendicular Vegetation index (PVI) is very high before the fire (Fig. a), while during the fire it decreases (Fig. b), because of the loss of vegetation. After the fire this index has not changed a lot, because of the subtle recovery process. PVI increases in the recent years because of the recovery process indicating that the cluster of the vegetation separates from that of the soil.
|
22/06/2007; |
25/07/2007; |
|
19/06/2008; |
22/06/2009; |
|
21/06/2010. |
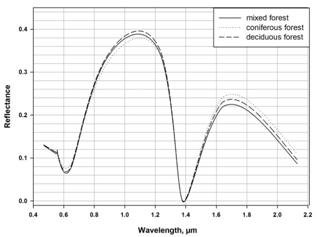
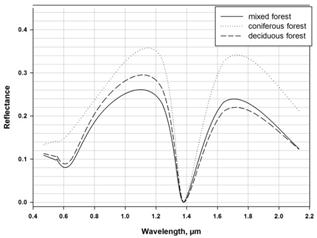
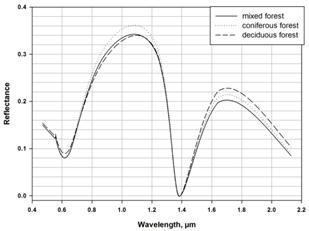
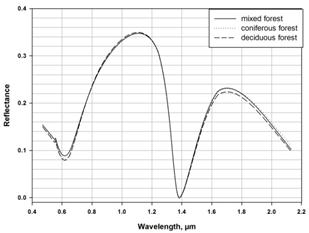
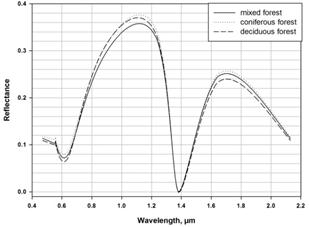
Figure 7. Graphs of spectral reflectance curves of selected areas with deciduous, coniferous and mixed forests before the fire (a), a few days after the fire (b), 1 year after the fire (c), 2 years after the fire (d), and 3 years after the fire (e).
|
22/06/2007; |
25/07/2007; |
19/06/2008; |
|
22/06/2009; |
21/06/2010; |
22/06/2011; |
|
21/06/2012; |
22/0613. |
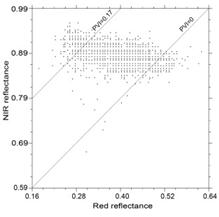
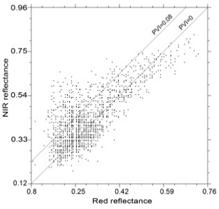
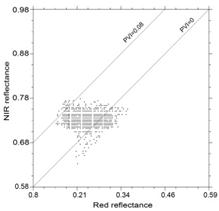
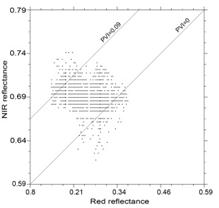
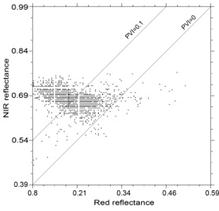
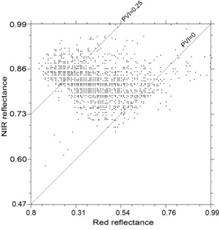
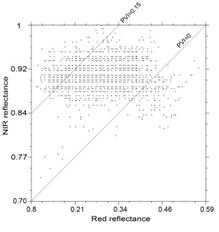
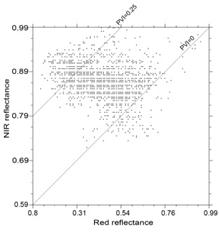
Figure 8. Isolines for the PVI and scatter diagrams showing the relationship between near infrared and red reflectance for the study area before the fire (a), a few days after the fire (b), 1 year after the fire (c), 2 years after the fire (d), 3 years after the fire (e), etc.
5. Conclusion
The regenerative process after fire could be evaluated with the use of satellite data. It spreads over long period of time and one of the ways to assess this process is to monitor the variations of the NDVI values during the years.
The variations of these values are due to the different vegetation conditions which depend on the fluctuations of the climate elements characteristics. The index fluctuations which accompany the regenerative processes are within narrow ranges and are related to the appearance of various invasive species. Thus, it could be concluded that the study period displace a solid tendency towards recovery of the studied plant communities.
Acknowledgements
This work was supported by the Operational Program Human Resources Development of the Bulgarian Ministry of Education, Youth and Science funded by the European Social Fund (ESF), CONTRACT BG051PO001-3.3.06-0051.
References
- Birds Directive, 2009/147/EC
- Boerner R.E.J. (1982) - Fire and nutrient cycling in temperate ecosystems, Bioscience, 32: 187-192.
- Bondev I. (1991) - The vegetation of Bulgaria, "Kliment Ohridski" (in Bulgarian)
- Carreira J.A., Niell F.X., Lajtha K. (1994) - Soil nitrogen availability and nitrification in Mediterranean shrublands of varying fire history and successional stage, Biogeochemistry, 26: 189-209.
- Dimitrova M., Ivanova I., Zaharinova M., Nedkov R. (2011) - Application of aerospace methods of monitoring of forest fires and evaluation of burned area in Haskovo region in the summer of 2011, Seventh Scientific Conference with International Participation - Space, Ecology, Safety, 87-98. (in Bulgarian)
- Dimitrova M., Nedkov R. (2014) - Registration of Floods and Fires using MODIS, Ecological Engineering and Environment Protection, 3(4)/2015: 19-24, ISSN 1311 – 8668. (in Bulgarian)
- Habitats Directive, 92/43/EEC
- HiltyJ.H., EldridgeD.J., RosentreterR., Wicklow-HowardM.C., PellantM. (2004)-Recovery of Biological Soil Crusts following Wildfire in Idaho,Journal of Range Management, 57: 89-96.
- Holben B.N., Kimes D.S., Fraser R.S. (1986) - Directional reflectance in AVHRR red and near-infrared bands for three cover types and varying atmospheric conditions,Remote Sensing of Environment, 19: 213-236.
- Jones H., Vaughan R. (2010) -"Remote sensing of vegetation. Priciples, techniques, and applications", OXFORD University Press, ISBN: 978-0-19-920779-4.
- Lillesand T.M., Kiefer R.W., Chipman J.W., Remote Sensing and Image Interpretation, 6 ed., John Wiley & Sons, Inc., NJ – USA, 2007.
- Miettinen J. (2007) - Variability of fire-induced changes in MODIS surface reflectance by land-cover type in Borneo,International Journal of Remote Sensing, 28: 4967-4984.
- Milanova Y., Avetisyan D., Nedkov R. (2014) - Comparative analysis of the state and dynamics of agricultural and forest vegetation based on satellite and ground data, Scientific conference with international participation -Geography and Regional Science, 30-31 October 2014, Pazardzhik, Bulgaria, 145-151.(in Bulgarian)
- Milanova Y., Mateeva Z. (2014) - A multidisciplinary approach to study climate-determined productivity of agricultural crops, In CD Proceedings, XXIV International Symposium on Modern technologies, education and professional practice in geodesy and related fields, Sofia, November 6-7, 2014. ISSN 2367-6051.
- Nedkov R., Dimitrova M., Zaharinova M., Ivanova I. (2008) - Web-based monitoring of the fires in the Balkans using satellite data during July and August 2007,Ecological engineering and environmental protection, No1: 13-19. (in Bulgarian)
- NIMH-BAS (1982) - „Agroclilmatic atlas of Bulgaria", CIRD in Cartography, NIMH (in Bulgarian)
- Richardson A.J., Wiegand C.L. (1977) - Distinguishing vegetation from soil background, Photogrammetric Engineering and Remote Sensing, 43: 1541-1552.
- Rouse J.W., Haas R.H., Schell J.A., Deering D.W. (1973) - Monitoring Vegetation Systems in the Great Plains with ERTS, Proceedings of Third Earth Resources Technology Satellite-1 Symposium, Greenbelt, MD, USA, pp. 309-317.
- Schlesinger W.H., Reynolds J.F., Cunningham G.L., Huenneke L.F., Jarrel W.M., Virginia R.A., Whitford W.G. (1990) - Biological feedbacks in global desertification, Science, 247: 1043-1048.
- Schowengerdt R. A. (2007) - Remote Sensing. Models and Methods for Image Processing, Third Edition, Academic Press, ISBN-13: 978-0-12-369407-2.
- Soukup, T. (2007) - Guidelines for CLC2006 delivery.
- Stankova N., Nedkov R. (2015) - Investigation of forest vegetation dynamics before and after a fire by using aerospace data, Ecological Engineering and Environment Protection, 1/2015: 40-46, ISSN 1311 – 8668.
- Thomas C.M., DavisS.D. (1989)-Recovery Patterns of Three Chaparral Shrub Species after Wildfire,Oecologia,80:1432-1939.
- Topalova L., Velizarova E. (2005) - Forest fires impact on some chemical characteristics of soils in the region of State Forestry "Ivaylovgrad", Scientific Reports "Management, use and protection of soil resources", 15-19 May 2005, Sofia, 345-349.(in Bulgarian)
- Tucker C.J. (1979) - Red and Photographic Infrared Linear Combinations for Monitoring Vegetation,Remote Sensing of Environment, 8: 127-150. doi:http://dx.doi.org/10.1016/0034-4257(79)90013-0.
- Velizarova E., Jorova K., Tashev A. (2001a) - Studies on some characteristics of forest soils affected by fires in Pinus nigra Arn. stands I. Physical characteristics, Forest Science, 1/2: 29-34.(in Bulgarian)
- Velizarova E., Jorova K., Tashev A. (2001b) - Studies on some characteristics of forest soils affected by fires in Pinus nigra Arn. stands II. Chemical characteristics, Forest Science, 1/2: 35-43.(in Bulgarian)
- Viedma O., Meliá J., García-Haro J., Segarra D. (1996) - Monitoring forest regrowth rates after fires with multitemporal Landsat TM imagery,EARSel Advantages in Remote Sensing, Vol 4: 145-154.
- http://rapidfire.sci.gsfc.nasa.gov/subsets/?subset=Europe_3_03
- http://marswiki.jrc.ec.europa.eu/datadownload/index.php


