
Journal of Environment Protection and Sustainable Development, Vol. 1, No. 3, July 2015 Publish Date: May 26, 2015 Pages: 107-120
Detection of Urban Change and Urban Sprawl of Madurai City, Tamilnadu Using GIS and RS
Tamilenthi S.1, *, Arul P.2, Chandramohan K.3
1Dept. of Geography, Kalinga University, Raipur, India
2Dept. of Geography, Govt. Arts College (Auto), Salem, India
3UGC-Academic Staff College, Madurai Kamaraj University, Madurai, Tamil Nadu, India
Abstract
There has been rapid change in the land use and land-cover types in Madurai city, Tamilnadu in the past 26 years. The major change is the conversion of agriculture and forest lands into urban areas mostly in an un-planned manner making urban sprawl characterizing the urban change dynamics. The principal aim of this research was to apply remotely sensed data, geospatial tools to detect, quantify, analyze, and detect the urban land use changes of Madurai city. Madurai City, located in South Central Tamil Nadu, is the second largest city after Chennai and is the headquarters of Madurai District. In 2011, the jurisdiction of the Madurai Corporation was expanded from 72 wards to 100 wards covering area 151 Sq.Kms. It is extended geographically from 9o50‟ North latitude to 10o North latitude and 78o 02‟ East longitude to 78º12‟ East longitude, and approximately 100 m above MSL. The corporation limit was extended from 52.18 km2 to 147.9 km2 in 2011. As per 2011 census the population of the city is 15.35 lakhs. The city spreads over 147.9 km2 which divided into 100 wards for administrative purpose. The ultimate objective of the research is to detect the land use/land-cover change of Madurai city from 1980 to 2006. Satellite images of Madurai city at different periods, 1980, 1990, and 2006 were analyzed. The software programs that have been used in this study to process, quantify, analyze and change detection are ArcGIS 9.2, ArcMap and ERADAS 2013.Change detection techniques namely post classification comparison (indirect method) and image-to-image comparison change detection (direct method) were employed. Post-classification comparison change detection was conducted to reveal the areas that have changed over the period of 26 years.
Keywords
Urban Change, Urban Sprawl, GIS, Madurai Corporation
Received: April 10, 2015
Accepted: April 30, 2015
Published online: May 25, 2015
@ 2015 The Authors. Published by American Institute of Science. This Open Access article is under the CC BY-NC license. http://creativecommons.org/licenses/by-nc/4.0/
Contents
1. Introduction 1.1. Land Use and Land Cover Types 1.2. Urban Sprawl 1.3. Aims and Objectives 1.4. Significance of the Study 1.5. Research Hypothesis and Questions 2. Study Area 3. Overview of Urban Sprawl and Change Detection 4. Methodology 4.1. Flow Chart for the Methods Employed 4.2. Sources of Data 4.3. Tools Used in the Study 4.4. Limitations of the Study 4.5. Image Classification 4.6. Post Classification Comparison Change Detection 5. Image Analysis 5.1. Land Use / Land Cover 5.2. Change Detection 5.3. Urban Sprawl Change Direction 5.4. Performance of NDVI 5.5. Principal Component Analysis (PCA) 6. Conclusion
1. Introduction
The history of urban growth indicates that urban areas are the most dynamic places on the Earth’s surface. Despite their regional economic importance, urban growth has a considerable impact on the surrounding ecosystem (Yuan et al., 2005). Most often the trend of urban growth is towards the urban-rural-fringe where there are less built-up areas, irrigation and other water management systems. In the last few decades, a tremendous urban growth has occurred in the world, and demographic growth is one of the major factors responsible for the changes. By 1900 only 14% of the world’s population was residing in urban areas and this figure had increased to 47% by 2000 (Brinkerhoff, 2000). The report also revealed that by 2030, the percentage of urban population is expected to be 60%. Urban growth is a common phenomenon in almost all countries over the world though the rate of growth varies. Currently, these are the major environmental concerns that have to be analyzed and monitored carefully for effective land use management. The rapid urban growth and the associated urban land cover changes have also attracted many researchers.
A substantial amount of data from the Earth’s surface is collected using Remote Sensing (RS) and Geographic Information Systems (GIS) tools. RS provides an excellent source of data from which updated land use/land cover (LULC) information and changes can be extracted, analyzed and simulated efficiently. RS in the form of aerial photography provides comprehensive information of urban changes (Bauer et al., 2003). It is not, however, without limitations: costs of the acquisition and the analogue data format are the most obvious problems. The cost of acquiring data causes many analysts to remain sceptical about the potential of remotely sensed data (Rowlands and Lucas, 2004). It should also be noted that LULC mapping using remote sensing has long been a research focus of various investigators (Civco et al., 2002).
Recent advancement in GIS and remote sensing tools and methods also enable researchers to model and predict urban growth more efficiently than the traditional approaches. Several modeling approaches have also been developed to model and forecast the dynamic urban features. One of the approaches is the Cellular Automata-CA. CA is a dynamical discrete system in space and time that operates on a uniform grid-based space by certain local rules (Alkheder and Shan, 2005, Hand 2005). The CA is consisting of cells and transition rules are applied to determine the state of a particular cell. Its ability to represent complex systems with spatio-temporal behavior from a small set of simple rules and states made it very interesting for urban studies (Alkehder and Shan, 2005). In this study an integrated approach of GIS, RS and modeling has been applied to identify and analyze the patterns of urban changes and provide quantitative and spatial information on developments of urban areas.
1.1. Land Use and Land Cover Types
In this research, the land cover categories established are: 1) Forest 2) Scrub 3) Barren land 4) Settlement 5) Com.&Ind.area 6)Water body 7) River and 8)Airport.
1.2. Urban Sprawl
Many organizations have attempted to provide a definition, but it turns out that the definition depends on that organization’s perspective, usually polarized between a pro-growth and an anti-sprawl viewpoint.
1.3. Aims and Objectives
The principal aim of this research is to apply remotely sensed data, geospatial tools to detect, quantify, analyze, and urban land use changes.
The following were also some of the specific objectives of the research:
1. Quantify and investigate the characteristics of urban land use over the study area based on the analysis of satellite images.
2. To analyze the land use and land cover pattern for the specific periods.
3. To detect land use and land cover pattern Urban sprawl for the study period.
1.4. Significance of the Study
One of the major impacts of urban land cover dynamics is a shrinking amount of cultivated land through the development of infrastructures and various developments projects. Therefore, urban land use change studies are important tools for urban or regional planners and decision makers to consider the impact of urban sprawl. The results of this study would provide information relevant to contribute in the environmental management plans and improve urban planning issues. It is also expected to:
1) Provide information on the status and dynamics of the urban land use of the area and the use of remote sensing from satellite imagery for such analysis for planners. Assist environmentalist, regional (urban) planners, and decision makers to consider the potential of geospatial tools for monitoring and planning urban environment.
2) Provide elements for long term bench-mark monitoring and observation relating to resource dynamics.
3) Provide a base line for eventual research follow-up, by identifying specific and important topics that should be considered in greater detail by those interested in the area. Urban sprawl and growth information are relevant to variety of people, agencies etc. for decision making. Among these users are both government and non-governmental agencies. Some of these potential users are town and country planners, urban planners, statisticians, environmental agencies, land owners etc.
1.5. Research Hypothesis and Questions
This study is based on the hypothesis that there have been considerable urban land use changes in the study area. It also tests two research assumptions:
1 It is possible to use RS and GIS tools to study urban growth analysis.
2. Have there have been major changes in the urban environment of the study areas?
3. What was the spatial extent of the land cover change and where was the highest rate of changes?
4. What were the major deriving forces for the changes?
2. Study Area
Madurai City, located in South Central Tamil Nadu, is the second largest city after Chennai and is the headquarters of Madurai District. The municipality of Madurai was constituted on 1 November 1866 as per the Town Improvement Act of 1865.The municipality was headed by a chairperson and elections were regularly conducted for the post except during the period 1891 to 1896, when no elections were held due to violent factionalism. In 2011, the jurisdiction of the Madurai Corporation was expanded from 72 wards to 100 wads covering area 151 Sq.Km, dividing into four regions Zone I, II, III, IV. There has been rapid growth in Madurai from 1967 and it has gradually increased over the years in Madurai and its surrounding areas. Most of the areas around Madurai are least developed and are in the transformation stage.
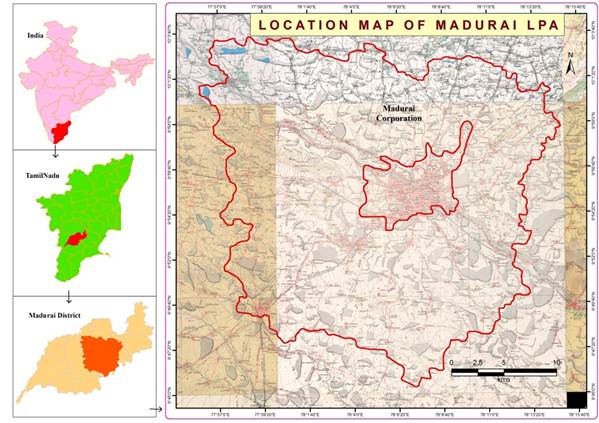
Fig (1). Study area.
Madurai, a temple city and bustling city, is the birthplace of "Tamil", one of the oldest languages in India. It extended geographically from 9o50‟ North latitude to 10o North latitude and 78o 02‟ East longitude to 78º12‟ East longitude, and approximately 100 m above MSL. The terrain of the city is gradually sloped from the north to south and west to east. The River Vaigai is the prominent physical feature which bisects the city into North and South zones with the north sloped towards Vaigai River and the south zone sloped away from the river. The city became municipality in 1867 and was upgraded as a corporation in 1971 after 104 years. The corporation limit was extended from 52.18 km2 to 147.9 km2 in 2011. As per 2011 census the population of the city is 15.35 lakhs. The city spreads over 147.9 km2 which divided into 100 wards for administrative purpose.
3. Overview of Urban Sprawl and Change Detection
Urbanization, which may be broadly defined as the process of expanding urban influence, has been taking place for more than 6000 years, has increased markedly since the beginning of this century. The process of urbanization in India has been slow but steady. As per 2001 census, only less than 1/3rd of India was urban. Predominantly its urban growth has been due to the enlargement of existing towns at every level and not significantly due to the addition of new towns.. India’s big cities now account for a large share of total urban population. In 2001, the share of metropolitan cities was 37.8 % up from 32.5% in 1991 and 26.4% in 1981.
Abbas et.al (2010) has studied the changes in land use and land cover in Kafur local government area of Katsina state, Nigeria over 13 years period. The study made land use and land cover map of the study area for 1995 and Google earth imagery of 2008.The image and the map were digitized in to GIS environment using ArcView 3.2 GIS software for analysis. A paired t-test analysis was also used to see if there was significant change in the land use and land cover between 1995 and 2008.This paper highlights the land use and land cover types, the change over the years and the cause of the change. The importance of remote sensing and GIS techniques in mapping and change detection was also highlighted.
Prakasam (2010) Land use and and cover is an important component in understanding the interactions of the human activities with the environment and thus it is necessary to be able to simulate changes. In this paper an attempt is made to study the changes in land use and land cover in Kodikanal Talus over the 40 years period (1969-2008).The study has been done through remote sensing approach using SOI Taluk map of Kodikanal(1969), and land sat imageries of 2003 and 2008.The land use and land cover classification was performed based on the survey of India, Kodikanal taluk map and satellite imageries. GIS software is used to prepare the thematic maps.
Renuka Devi (2010) had studied the changes in Land use and land cover is a dynamic process taking place on the surface and the spatial distribution of the changes that have taken place over a period of time and space is of immense importance in many a natural resources studies. In recent years remote sensing and geographical information system have gained importance as vital tools in the analysis of change detection at district and city level. This paper describes the changes in land use and land cover pattern in Coimbatore district of Tamilnadu state in between 2004 to 2007 so as to detect the changes that has taken place in this status between these periods.
Rajesh et.al (2010) have studied the land use and land cover change detection of Hamavathi watershed in Cauvery basin in Karnataka state. Mainly two sets of LISS-III satellite imagery were (1998 to 2008) taken into the account and the change detection was analyzed Sakthivel et al (2010) focused on the role of remote sensing and geographic information system (GIS) in assessment of changes in forest cover, between 1931 and 2001, in the Kalrayan hills, Tamilnadu. The trend of forest cover changes over the time span of 70 years was precisely analyzed using high resolution satellite data. The study analyses the forest cover change in the tropical deciduous forest region of Eastern Ghats of India. It is envisaged that the study would prove the usefulness of remote sensing and GIS in forest restoration planning.
Sumathi et al (2011) have studied the aims to find out the land use and land cover of Pudukottai district of Tamilnadu, India. The total area of the district is 4,663 sq km. The study has made use of satellite imagery for identifying the land use and land cover of Pudukkottai district. In this study Arc-GIS software was used to demarcate the land use and land cover pattern. The district has been classified into five classes in level I and 11 classes of level II.
Tamilenthi.S et al (2011) study attempts to identify such sprawls change for 1973-2010. The study was carried out Salem corporation, Tamil nadu, India using the techniques of GIS and remote sensing to identify and detect the urban sprawl. The spatial data along with the attribute data of the region aided to analyze statistically and fore casting. It is found that the Old suramangalam cluster or north west cluster extends from andipatti to Burns colony. The Kalarampatti to NGGO colony /Chinna kollapatti extensions is second cluster which occupies in the north eastern part of the corporation. This implies that by 2020 and 2050, the built-up area in the region would rise beyond the corporation limits and hence the corporation limit will be extended.
Tamilenthi.S et.al (2011) study results were based on Image classification and its interpretation .The mapping of the urban development of Salem town shows the development of urban lands had brought changes in other part of the city as well. The interpretation of multi-date satellite and other data helped in the preparation of urban sprawl map of the study area. The study of the spatial growth of the city over the years has revealed that the built-up area has spread along main transportation corridors in a radial pattern viz. Namakkal, Dharmapuri, Attur and Erode. The decrease in agricultural area is due to conversion of urban land use or discontinuation of agricultural lands. The Barren land has been reduced considerably. Similar studies can be under taken for other cities also to estimate the quantum of damage caused to the environment by urbanization.
Sunarakumar et al (2012) their attempted to identify such urban sprawl change for 1973-2009 from the Land sat images of Vijayavada city. Remote sensing has the capability of monitoring such changes, extracting the change in information from satellite data. The images of 1973 MSS, 1990 TM, 2001 ETM+ and 2011 ETM+ which are rectified and registered in Universal Transverse Mercator(UTM) are obtained. The land use and land cover maps of the study area are developed by supervised classification of the images. There are five land use class have been identified as Urban (built-up), Water body, Agricultural land, Barren land and Vegetation.
4. Methodology
In order to detect areas that have changed as a result of the expansion of the urban fringe, the procedures as shown in the flow chart were followed. The first thing to consider is the processing of the remotely sensed data to extract change information. Basically, the main processes involve are pre-processing (geometric registration and radiometric correction), followed by image classification, change detection and finally assessing the statistical accuracies of the classification in change detection process (Fig 2).
4.1. Flow Chart for the Methods Employed
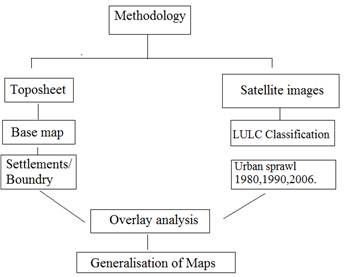
Fig (2). Flow chart for methodology employed in digital change detection.
Table (1). Data Source
| Sl. No | Sensor | WRS:_2 Path /Row | Resolution | Year of production | Source |
| 1 | Lansat-7,TM | 143/53 | 30 x 30 | 1980,1990 | GLCF |
| 2 | Lansat -8, ETM | 143/53 | 30 x 30 | 2006 | GLCF |
| 3 | Topographic map | 58 K | 1:25,000 | 1990 | GLCF |
| 4 | Administrative Map of Madurai corporation. | 9o45’ to 9o59’ N 77o58’ to 78o11’ E. | 1:30,000 | 2010 | Madurai corporation, Madurai. |
4.2. Sources of Data
For the study, Landsat satellite images of Salem city were acquired for 3 Epochs; Landsat LISS-III 1980, 1990, and 2006. The Epochs were obtained from Global Land Cover Facility (GLCF) an Earth Science Data Interface.
The Landsat data were acquired from the global land-cover website at the University of Maryland, USA. URL;http://glcfapp.umiacs. umd.edu:8080/ esdi/ index.jsp. The satellite data were different resolutions but these all converted into 30m spatial resolutions.
It is also important to state that Salem city and its environs which were carved out using the local government boundary map and Salem city Administrative map was also obtained from Salem corporation office. topographic map at a scale of 1:25,000 for 1990. The data were acquired from the GLCF, Maryland, USA.
4.3. Tools Used in the Study
Various software programs have been used in this study to process, quantify, analyze, and model the spatial dataset. For the preliminary data processing, extracting the study area and mosaicking satellite images, ERADAS 2013 and ArcGIS 9.2 version was used.
4.4. Limitations of the Study
The present research is not completely free of limitation. First of all, considering the technical aspects of the satellites images used are restricted to certain spatial and spectral resolution. The effectiveness of the Object Oriented method has a great impact on then resolution. Secondly, for accuracy assessment, a true high quality reference data or ground truth data with the same number of classes was not available. Thirdly, due to time limitations, the choice of data, aerial extent of study area and number of methodologies used are also restricted.
4.5. Image Classification
In order to make use of the multitude of digital data available from satellite imagery, it must be processed. This processing involves categorizing the land into its various use functions. Classification techniques are widely used for Land use/Land-cover mapping and can be used as source of information for many different applications.
4.6. Post Classification Comparison Change Detection
To minimize phonological effects of remotely-sensed data, the post-classification comparison method was employed for image processing, as this method is less sensitive to radiometric variations between the scenes (Mas 1999). The supervised classified maps were used because of its higher accuracy as compare to the unsupervised maps.
Digital change detection techniques aim to detect changes in images over a period of time. Change detection techniques rely upon differences in radiance values between two or more dates. Unfortunately, few quantitative comparative studies of change detection techniques are available. There is no universally 'optimal' change detection technique. The choice is dependent upon the application. The selection of an appropriate change detection algorithm is very important. Most change-detection projects require that the ‘from-to’ information be readily available in the form of maps and tabular summaries. Post-classification change detection was chosen because:
i) It produces a transition matrix. This matrix describes each pixel if it has changed and if it has, from which class to what. This change information is valuable for analyses and for planning purposes.
ii) There is no need for radiometric normalization of the images use in the analysis
iii) Sensitive to the spectral variations
iv) It provides "from-to" change information.
5. Image Analysis
5.1. Land Use / Land Cover
To achieve this study the two different land-covers and land use classes were analysed. These values quantify the percentage change in each land cover category. The change ‘from to’ makes post classification change detection so unique. The other task is the detection of the urban expansion as described in the post classification change detection processes. In order to determine the "urban sprawl" the images for 1980, 1990 and 2006 were classified as shown in figures 3, 4 and 5. The results indicate a moderate growth of towns in the study area. The town is recorded with moderate to fast urban growth.. Town expansion is attributed to the commercial and industrial activities. The intra-regional variations in growth are mainly associated with acceleration of economic activity, transportation network, administrative and government interventions.
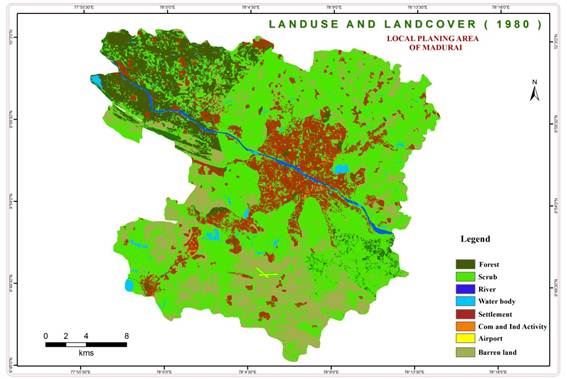
Fig (3). Land use land cover change 1980
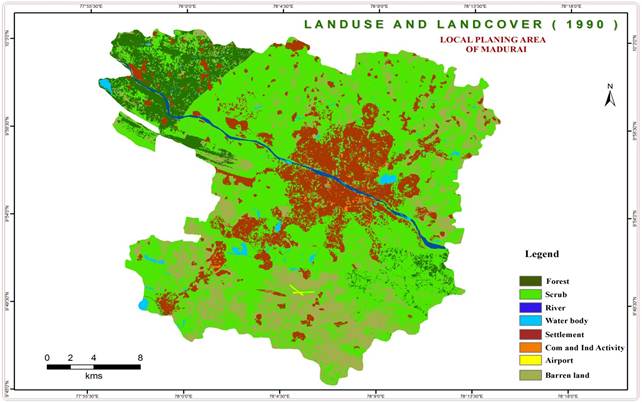
Fig (4). Land use land cover change 1990
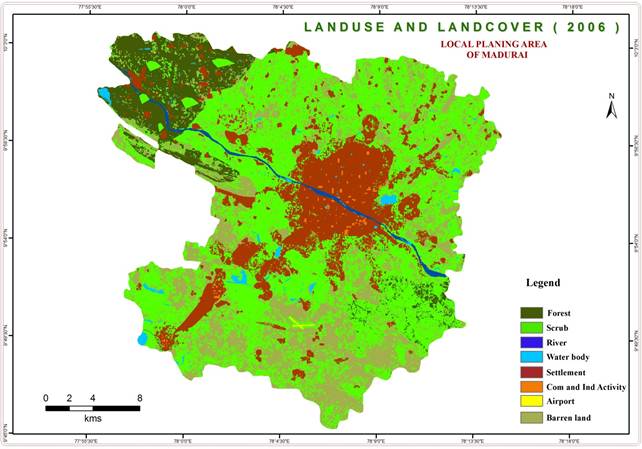
Fig (5). Land use land cover change 2006
5.2. Change Detection
An important aspect of change detection is to determine what is actually changing to what i.e. which land use class is changing to the other. This information will reveal both the desirable and undesirable changes and classes that are "relatively" stable overtime. This information will also serve as a vital tool in management decisions. This process involves a pixel to pixel comparison of the study year images through overlay. In terms of location of change, the emphasis is on built-up land. The map in Figures 3, 4&5 shows the change between 1980, 1990 and 2006. The observation here is that there seem to exist a growth away from the city center due to high land value, closer to new bus stand. New industries emerge depending on the raw material which could be by the road and railway station accessibility.
5.3. Urban Sprawl Change Direction
Defining this dynamic phenomenon and predicting the future sprawl is a greater challenge than the quantification of sprawls. Although different sprawl types were identified and defined there has been an inadequacy with respect to developing mathematical relationships to define them. This necessitates characterization and modeling of urban sprawl, which will aid in regional planning and sustainable development. Urban sprawl dynamics was analyzed considering some of the causal factors. The below figures 6,7,8 &9 shows most spread urban areas during the different decadal points with red colour and the green colour is for least spread. The yellow colour is given for starting or existing occupancy of urban.
Table (2). Land use land cover change 1980-2006
| Classification | 1980(Hect) | 2006(Hect) | Area change (Hect) | Area change (%) |
| Forest | 9851 | 4074 | -5777 | -58.64 |
| Scrub | 53018 | 34932 | -18086 | -34.11 |
| Barren land | 5299 | 18332 | +13033 | +245.95 |
| Settlement | 3176 | 14193 | +11017 | +346.88 |
| Commerc&Ind. Activity | 76 | 250 | +174 | +228.94 |
| Water body | 1051 | 753 | -298 | -28.35 |
| River | 700 | 623 | -77 | -11 |
| Airport | 21 | 33 | +12 | +57.14 |
| Total area | 73191 | 73191 |
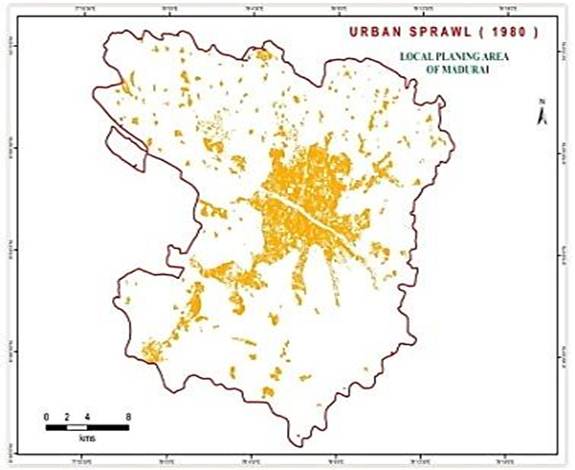
Fig (6). Urban sprawl direction from 1980
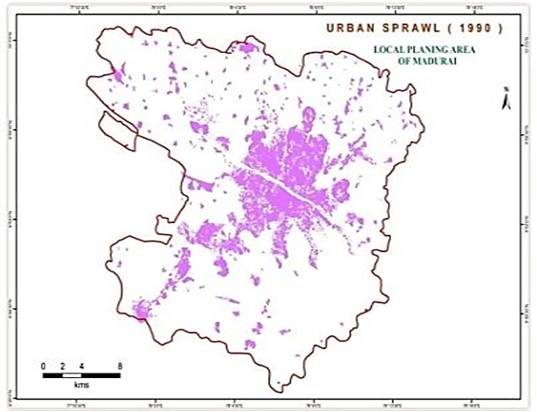
Fig (7). Urban sprawl direction from 1990
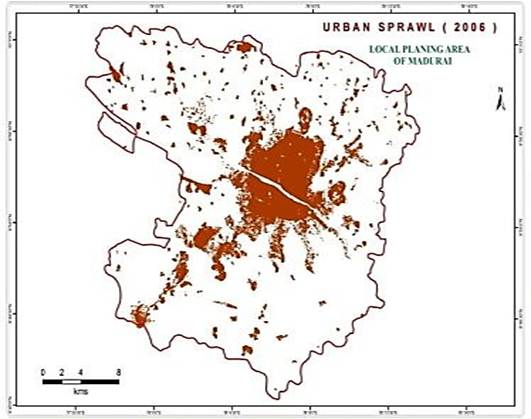
Fig (8). Urban sprawl direction from 2006
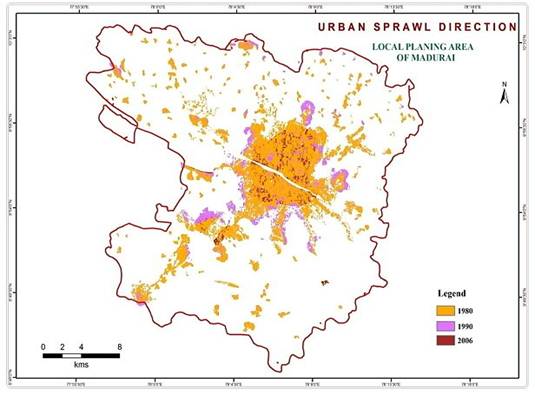
Fig (9). Urban sprawl direction from 1980–2006
5.4. Performance of NDVI
It can be seen from its mathematical definition that the NDVI of an area containing a dense vegetation canopy will tend to have positive values (say 0.3 to 0.8) while clouds fields will be characterized by negative values of this index. There is a clear indication (Figures 10,11 &12) that water cover and existing urban/bare areas did not change and such have zero or a very lower value. The brighter areas which represent change in vegetation are as a result of evolution of urban/bare areas. The NDVI differencing hence is vital in identifying changes in urban areas by investigating the changes in the vegetation cover. (As is the case when the NDVI is calculated directly on the basis of raw measurements)
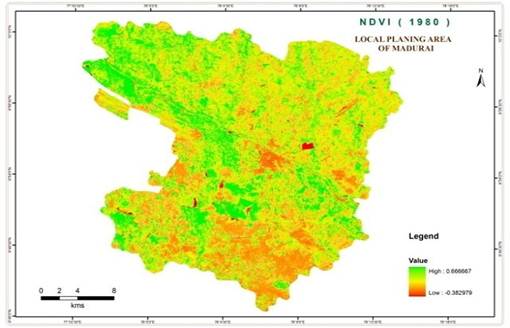
Fig (10). NDVI for 1980
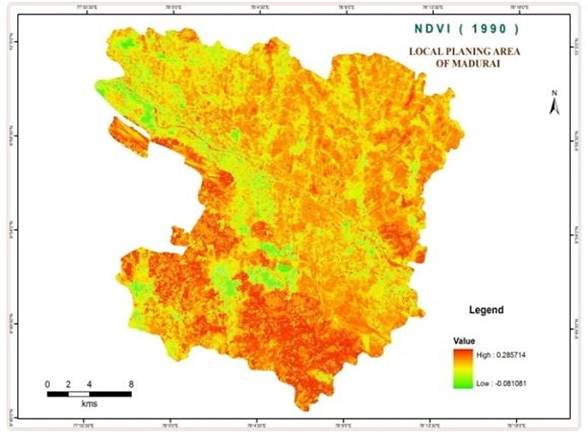
Fig (11). NDVI for 1990
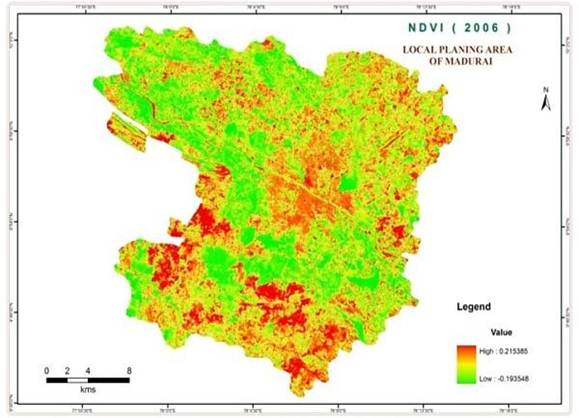
Fig (12). NDVI for 2006
5.5. Principal Component Analysis (PCA)
In Figures 13, 14 and 15, the pink areas represent urban/bare areas in 1980, 1990 & 2006. This is because in the PCA analysis of the image, urban areas have a high reflectance values than any other land-cover/land-use category. The other areas are represented by dark blue colour. From Figures (13,14&15 ), the PCA has proven to be a good technique in identifying the new urban area that has evolved within the decade. The new urban area evolved is also an indication that there has been lost of vegetation within the two periods.
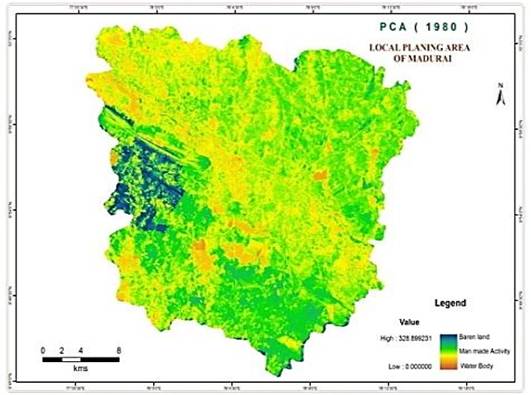
Fig (13). Principal component analysis-1980
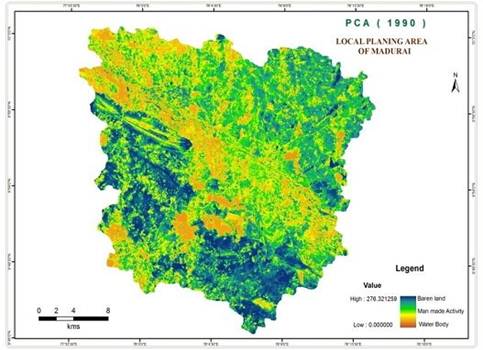
Fig (14). Principal component analysis-1990
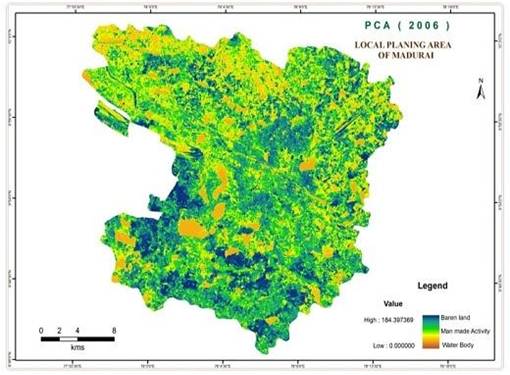
Fig (15). Principal component analysis-2006
6. Conclusion
The urban area of Madurai city has increased tremendously within the 26 years. This resulted from rural-urban migration. Madurai is one of the most developing cities in Tamilnadu, after Chennai. Education institutions, industries, and factories etc are located and upcoming here. As a result, rural-urban migration has been characterizing in Madurai city. The overall percentage increased during the period of 26 years about 245.95%, 346.88%, 228.94% and 57.14%. barren land, Settlement, Comm. & Industrial activity and Airport respectively. There has been decrease in the Forest, Scrub, Water body and River with 58.64%, 34.11%, 28.3 5% and 11% respectively.
The results of this study were based on Image classification and its interpretation. The mapping of the urban development of Madurai town shows the development of urban lands had brought changes in other part of the city as well. The interpretation of multi-date satellite helped in the preparation of urban sprawl map of the study area. The decrease in agricultural/Scrab area is due to conversion of urban land use or discontinuation of agricultural lands. The Barren land has been increase as cultivable land is left with discontinuation of cultivation due to lack of irrigation facility and seasonal variations are made them to be available as such. Similar studies can be under taken for other major cities also to estimate to make necessary arrangement to plan accordingly to preserve the natural environment.
References
- Adeniyi P.O and Omojola A. (1999) Landuse Land cover change evaluation in Sokoto –Rima Basin of North Western Nigeria based on Archival of the Environment (AARSE)on Geoinformation Technology Applications for Resource and Environmental Management in Africa. Pp 143-172.
- Barr, S. L. (1992). Object-based Re-classification of High Resolution Digital Imagery for Urban Land-Use Monitoring. International Archives of Photogrammetry and Remote Sensing (ISPRS, Washington, D.C.1992). Vol. XXIX, Part B7, Commission VII, 969-76.
- Barnsley, M.J., Barr, S. L., and Sadler, G. J. (1991) Spatial Re-classification of Remote Sensed Images for Urban Land Use Monitoring. Proc. Spatial Data 2000, 17-20 September1991, Oxford University, (Nottingham: Remote Sensing Society), 106-117.
- Campbell, James B (1983) "Mapping the Land Aerial Imagery for Land Use Information" Resource Publications in Geography, Association of American Geographers, Washington D.C.
- Olorunfemi J.F (1983). Monitoring Urban Land – Use in Developed Countries – An aerialphotographic approach, Environmental Int.9, 27 – 32.
- Santos,A.P.;Foresti,C.;Novo,E.M.L.M.;Niero,M.;Lombardo,M.A. (1981).Metodologia deinterpretação de dados de sensoriamento remoto e aplicações no uso da terra.São José dos Campos,INPE.61 (INPE-2261-MD/016).
- Tamilenthi.S et al(2011) Dynamics of urban sprawl, changing direction and mapping: A case study of Salem city, Tamilnadu ,India. Archives of Applied Science Research, 2011, 3 (1):277-286.
- Tamilenthi.S and Baskaran.R(2011) Detecting Urban Change of Salem City of Tamil Nadu, India from 1990 to 2010 Using Geospatial TechnologyInternational Transaction Journal of Engineering, Management, & Applied Sciences & Technologies. Volume 2 No.2. 183-195.
- Tonjes, R., Growe S., Bucker J.and Liedtke C.–E. (1999).Knowledge-Based Interpretation ofRemote Sensing Images Using Semantic Nets. Photogrammetric Engineering & Remote Sensing, 65, 811-821.
- 10)Vieira,I.M.;Kurkdjian,M.L.N.O. (1993).Integração de dados de expansão urbana e dadosgeotécnicos como subsídio ao estabelecimento de critérios de oupação em áreas urbanas. In: simpósio brasileiro de sensoriamento remoto, 7.Curitiba, PR.Anais. Curitiba.v. 1.163-171.
- Valerio Filho,M. (1998).Técnicas de Sensoriamento remoto e geoprocessamento aplicadas aoplanejamento regional. VI Simpósio Nacional de Controle de Erosão. Presidente Prudente, São Paulo.CD-ROM.
- White house, S. (1990). A spatial land use classification of an urban environment using highresolution multispectral satellite data.Proc.16th Ann. Conf. Remote Sensing Society Remote Sensing and Global Change, University Collage Swansea,19-21 September 1990, (Nottingham: Remote Sensing Society), 433-437.
- Welch, R., (1982). Spatial resolution requirements for urbans studies. International Journal ofRemote sensing, 3(2): 139-146.
- Young, Anthony, Feb. (1994), Towards an international classification of land use, Consultancy report to UNEP/FAO, page 6. Visited on 11/11/2007 from URL:http://www.fao. org/ag/agl/agll/landuse/docs/young1994.doc.
- Yuan, D., and Elvidge, C. (1998). NALC land cover change detection pilot study: Washington D.C. area experiments. Remote Sensing of Environment, 66, 166-178.


