
Journal of Environment Protection and Sustainable Development, Vol. 1, No. 2, May 2015 Publish Date: May 6, 2015 Pages: 66-73
Evidence of Climate Change in Iraq
A. A. Azooz1, *, S. K. Talal2
1Department of Physics, College of Science, Mosul University, Mosul, Iraq
2Department of Physics, Faculty of Education, Zakho University, Zakho Kurdistan, Iraq
Abstract
Nonlinear regression is applied to compiled historical data related to mean monthly temperatures, and precipitations for four main cities in Iraq, Results shows significant occurrence of climate changes. The compiled primary data for the four cities and their corresponding starting years are Baghdad (1887), Mosul (1900), Basra (1923), and Kurkuk (1935). The ending year for all four data sets is 2013. The main two manifestations of such climate change are temperatures increases coupled decrease in precipitations. Extrapolation to future predictions for temperature agrees well with conclusions of the Intergovernmental Panel for Climate Change 2007 (IPCC2007) report on green house effect warming.
Keywords
Global Warming, Climate Change, IPCC, Iraq Weather
Received: March 31, 2015 / Accepted: April 13, 2015 / Published online: May 5, 2015
@ 2015 The Authors. Published by American Institute of Science. This Open Access article is under the CC BY-NC license. http://creativecommons.org/licenses/by-nc/4.0/
1. Introduction
Intensive scientific interest has been paid in the last few decades to the possible consequences of human activities on earth climate [1,2,3].One main such activity is considered to be the increasing levels of atmospheric CO2 concentrations. The possible effect of CO2 spectral infrared absorption properties on the earth climate was first discussed by Arrhenius [4] who pointed out that reducing atmospheric CO2 levels by half, may bring Europe into an ice age.
These concerns have triggered the international community to establish the "Intergovernmental Panel on Climate Change" IPCC in 1988. This panel of a large number of scientists is concerned with the task of assessing the effect of CO2 and other gases on the earth climate. The IPCC issued several reports since it was established. The IPCC used all published results related to climate change to build its famous IPCC2007 report 5. The most important conclusion in this report is that there is at least 90% probability that the earth climate is getting warmer as a result of the increase of CO2 emissions. Even so, there has been a significant number of research works which tend to dispute the results of the IPCC 2007 report arguing that the observed climate change cannot specifically linked to increased atmospheric CO2 concentration. Reasons such as natural cyclic weather changes or sun activity are blamed for any climate change observed6,7,8,9. A compilation of many references related to both sides of the argument can be found in reference [10].
This increased interest in climate change has induced many scientists all over the world to perform studies of local climatological changes in their native areas using locally collected meteorological data ,11,12,13,14.
In this work an assessment of the presence of any observable changes in Iraq’s mean monthly temperatures and precipitations over the past decades. For such purpose, mean monthly temperatures and precipitation data of four main Iraqi cities. These cities and their associated time periods covered by the data are: Baghdad (1887-2013), Mosul (1900-2013), Basra (1923-2013) and Kurkuk (1935-2013).
2. The Data
A comprehensive compilation of monthly mean temperatures and precipitation data is carried out. Four major Iraqi cities are selected for such purpose. These cities are the capital Baghdad, Mosul, Basra and Kurkuk. The main reason for such selection was the availability of data for these cities covering a period starting from the late 19th or early 20th century. The data are obtained from three main sources;
1 The British Meteorological office temperature data [15]
2 The tutiempo weather website [16]
3 USA National Oceanographic Data center (NOAA) [17]
All data are entered into MATLAB data files manually. Overlapping data records from different sources are compared, and crosschecked against each other. It must be emphasized however, that the original source of all these data is the Iraqi Meteorological office. The rain fall data in particular, which are obtained from NOAA for example, were originally prepared over the years by the Meteorological office which was then, an establishment of the Iraqi Ministry of Works and Transport. The data are contained in a document supplied by the Iraq Development Board to the association of Harza Engineering Company of Chicago and Bennie Deacon and Gourley Company of London as part of the requirements to prepare a hydro- geological survey of Iraq. The document was digitized in 1999 as part of NOAA Environmental Data Rescue Program.
The data involve some gaps of monthly and yearly missing data. These missing data are associated with periods of one type of political unrest or another over 20th century Iraq’s history. The most significant part of the missing data is those for the period of the first gulf war 1980-1988. The data for Baghdad, Mosul, and Kurkuk, for the period 2003- 2008 also contain many gaps. It must be mentioned however, that Basra’s data are mostly available after August 2003 . It can be said that recent five years data for all four cities are in good form. The data used in this work are the most available updates until the end of November 2013.
3. Data Analysis and Modelling
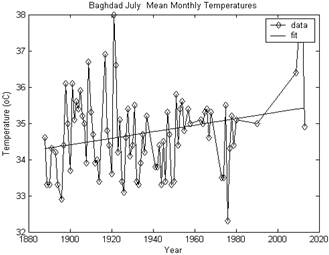
Mean monthly temperatures for all months and precipitation data for all rainy season months for all four cities under consideration are analyzed. However, and due to space considerations, only two sample figures for each of the climate metrics for each city will be presented. Other figures show the same pattern. Figure (1) shows the mean monthly temperatures for Baghdad in January and July. Figure (2) show the precipitations during the months of December and March in Baghdad. Figure (3) and (4) show other sample month’s data in Mosul for temperatures and precipitations respectively. Similar results are presented for Basra in figures (5) and (6) and for Kurkuk in figures (7) and (8).
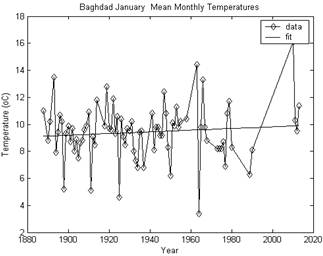
Figures (1). Mean monthly temperatures for Baghdad for January and July
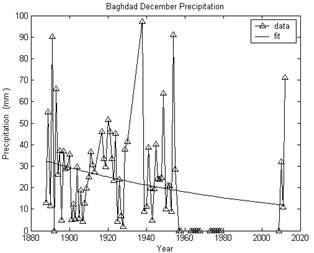
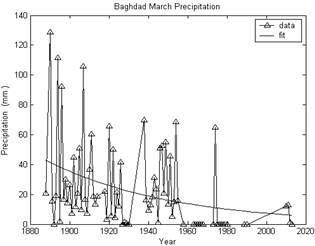
Figure (2). Precipitations during the months of December and March in Baghdad
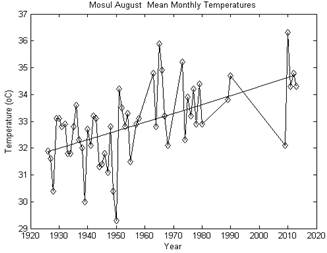
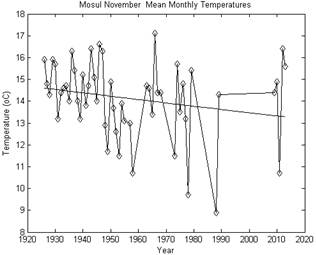
Figure (3). Mean monthly temperatures for Mosul for January and November
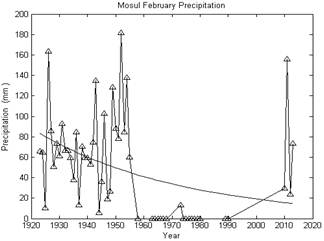
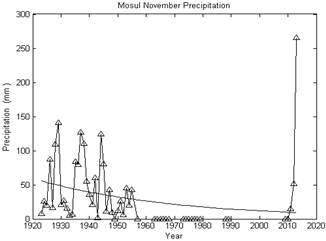
Figure (4). Mosul precipitations during the months of February and November
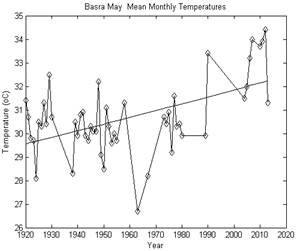
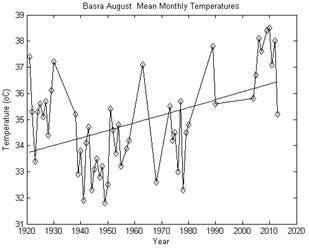
Figure (5). Mean monthly temperatures for Basra in May and August
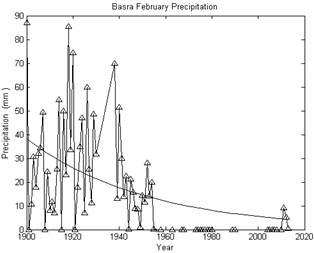
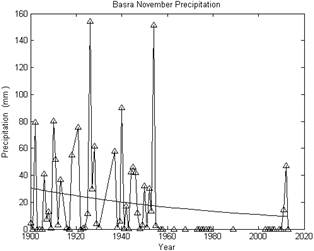
Figure (6). Basra precipitations during the months of February and November
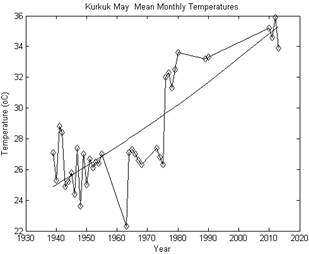
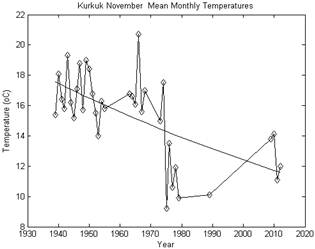
Figure (7). Mean monthly temperatures for Kurkuk for May and November
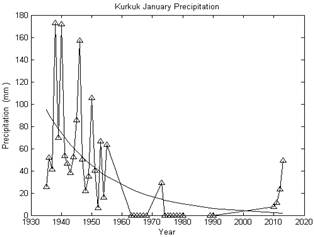
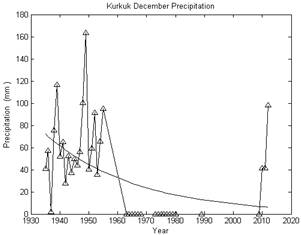
Figure (8). Kurkuk precipitations during the months of January and December
Although above and other similar figures show few cases of decreasing temperatures the general over all trends for all other months at all locations, indicate increasing temperatures over the years. This will be discussed further blow. The trends of rainfall show significant decrease over the period of years studied. These two effects clearly indicate that Iraq is very much affected by the global warming.
In order to asses this effect further, some form of empirical representation of the yearly temperatures and precipitation is required. Linear regression has been used is some previous works 18,19. However, it is thought here that such linear correlations may not provide physically meaningful representation of the data when extrapolated to predict expected future behaviours. For example, using linear fitting to describe the precipitation data, will lead to an unphysical negative extrapolated precipitations predictions some time in the future. The same linear back time extrapolation leads to wrong negative past temperature results. Instead, a more physically acceptable non linear exponential form is attempted here.
With T, and P being the monthly temperatures, and precipitations respectively, and Y being the year number, the following two fitting equations are attempted
![]() (1)
(1)
![]() (2)
(2)
It must be emphasized here that while equation (1) can be extrapolated for past and short term future, equation (2) can only extrapolated to future years values. The result of all fits using these two equations are shown as sold lines on the figures.
The fitting parameters![]() ,
,![]()
![]() and
and ![]() ,
, ![]() ,
, ![]() describe physical parameters. The two parameters
describe physical parameters. The two parameters![]() , and
, and ![]() , represent the estimated starting year temperature and precipitation values. The parameters
, represent the estimated starting year temperature and precipitation values. The parameters ![]() and
and ![]() represent estimated starting years. The two parameters
represent estimated starting years. The two parameters ![]() and
and ![]() have special importance as they describe the estimated rate of change of the temperature and precipitation respectively. Positive fitted values of these two parameters represent increasing effects while negative fitted values are indication of a decreasing temperature and precipitation respectively. In the fitting procedure, the values of the parameters
have special importance as they describe the estimated rate of change of the temperature and precipitation respectively. Positive fitted values of these two parameters represent increasing effects while negative fitted values are indication of a decreasing temperature and precipitation respectively. In the fitting procedure, the values of the parameters![]() , and
, and![]() , are constrained to the range temperatures and precipitations during the first five years of the particular data set under consideration. The same constrains are applied to the fitting parameters
, are constrained to the range temperatures and precipitations during the first five years of the particular data set under consideration. The same constrains are applied to the fitting parameters ![]() and
and![]() . The parameters
. The parameters ![]() and
and ![]() are left completely free to be determined by the MATLAB fitting program. This procedure ensured the fits convergence with over 95% confidence levels.
are left completely free to be determined by the MATLAB fitting program. This procedure ensured the fits convergence with over 95% confidence levels.
4. Results and Discussions
4.1. Temperatures Data
The monthly temperatures fit results obtained for the rate of change parameter ![]() for the four cities considered are shown in figure (9). These results indicate that the values of this parameter are season dependent with values generally higher for winter and spring months than those for summer and autumn months. In some cases, the later months tend to show even some decrease trend in temperature indicated by the negative values of
for the four cities considered are shown in figure (9). These results indicate that the values of this parameter are season dependent with values generally higher for winter and spring months than those for summer and autumn months. In some cases, the later months tend to show even some decrease trend in temperature indicated by the negative values of ![]() obtained. Even so, the overall general trend seems be directing towards increasing temperatures effects. The mean yearly values of the parameter
obtained. Even so, the overall general trend seems be directing towards increasing temperatures effects. The mean yearly values of the parameter ![]() for all four cities are shown in table (1). The over all weighted mean value for Iraq is calculated from results of the four cities considered. The value for each city is weighted by the reciprocal of the standard deviation. The overall mean value for Iraq is
for all four cities are shown in table (1). The over all weighted mean value for Iraq is calculated from results of the four cities considered. The value for each city is weighted by the reciprocal of the standard deviation. The overall mean value for Iraq is ![]() per year. Substituting this value into equation (1) gives estimated increase in mean temperatures in Iraq between the years 1900 – 2050 of about
per year. Substituting this value into equation (1) gives estimated increase in mean temperatures in Iraq between the years 1900 – 2050 of about ![]() 0C. In spite of the expected statistical errors due to data size and fluctuations, the mean value obtained suggests close agreement with the conclusions suggested by the IPCC 2007 report for the expected global warming.
0C. In spite of the expected statistical errors due to data size and fluctuations, the mean value obtained suggests close agreement with the conclusions suggested by the IPCC 2007 report for the expected global warming.
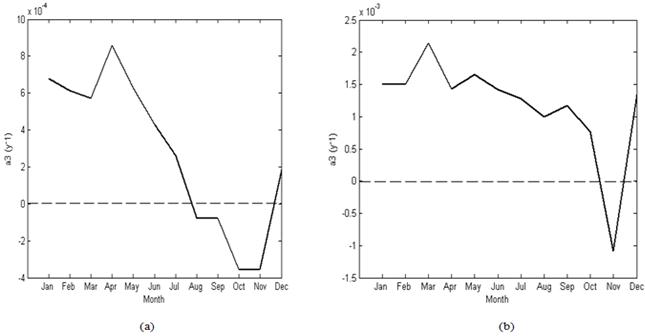
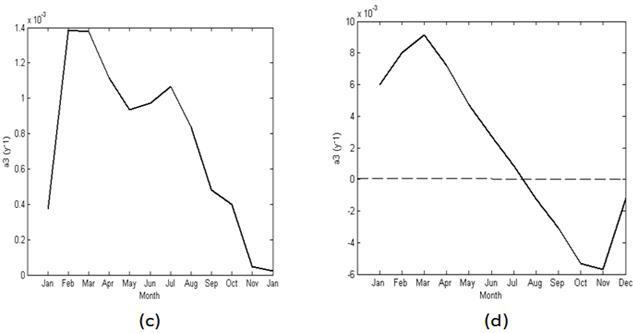
Figure (9). Variations of monthly values of the fitting parameter a3 for the four Iraqi cities (a) Baghdad, (b) Mosul, (c) Basra, (d) Kurkuk)
Table (1). Mean yearly values for the fitting parameter ![]() for the four cities
for the four cities
| a3 | Baghdad | Mosul | Basra | Kurkuk | Iraq Weighted mean |
| Mean | 0.3 | 1.0 | 0.8 | 1.8 | 0.7 |
| Std | 0.4 | 0.8 | 0.5 | 5.3 |
4.2. Precipitation Data
The monthly precipitations fit to equation (2) results obtained for the rate of change parameter ![]() for the four cities considered are shown in figure (10). It is interesting that all fits produced negative values of this parameter. No clear seasonal variations can be observed. Table (2) shows the values of the yearly mean for the four cities together with the overall weighted average for Iraq. The latter has a value of
for the four cities considered are shown in figure (10). It is interesting that all fits produced negative values of this parameter. No clear seasonal variations can be observed. Table (2) shows the values of the yearly mean for the four cities together with the overall weighted average for Iraq. The latter has a value of ![]() . Substituting this mean value into equation (2) gives an estimation that a drop of about 25% in precipitation might occur by the year 2050 compared to that for the year 1900.
. Substituting this mean value into equation (2) gives an estimation that a drop of about 25% in precipitation might occur by the year 2050 compared to that for the year 1900.
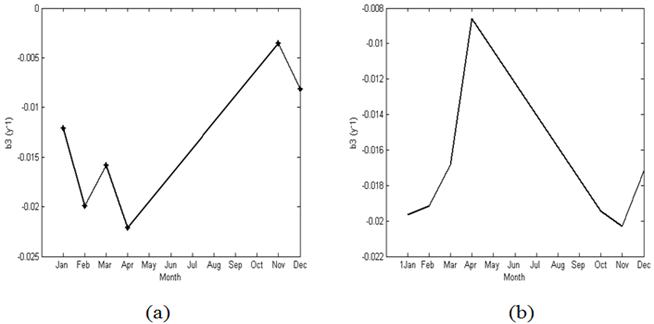
Figure (10). Variations of monthly values of the fitting parameter b3 for the four Iraqi cities (a) Baghdad, (b) Mosul, (c) Basra, (d) Kurkuk).
Table (2). Mean yearly values for the fitting parameter ![]() for the four cities
for the four cities
| b2 | Baghdad | Mosul | Basra | Kurkuk | Iraq Weighted mean |
| Mean | -11.4 | - 4.6 | - 13.4 | - 9.1 | - 9.6 |
| Std | 7.1 | 4.0 | 3.5 | 7.1 |
5. Conclusions
Analysis of available historical climatological data for the monthly temperatures and precipitations for four major Iraqi cities covering a time span of about one century provided evidence that there is significant climate change in the country. This climates change is manifested as estimated increase in temperature and reduced precipitations. Extrapolations of results of fits to the temperature data gives an estimation that there may be an increase in mean temperature of about 2.2 C by the year 2050 compared to those of 1900. This is inline with the global estimation suggested by the IPCC 2007 report. Precipitation estimation suggests some decrease of about 25% for the same period.
Acknowledgement
We are grateful to Mr H. Babahami for all his help and effort during the work on this paper.
References
- Möller, F. On the Influence of Changes in the CO2 Concentration in Air on the Radiation Balance of the Earth's Surface and on the Climate. J. Geophysical Research 68: 3877-86 (1963).
- Lorenz, E N. Climate Change as a Mathematical Problem. J. Applied Meteorology 9: 325-29 (1970).
- Bryson, R. A., & Wayne, M. W. Climatic Effects of Atmospheric Pollution. Global Effects of Environmental Pollution, edited by S. F. Singer, pp. 130-38. New York: Springer-Verlag (1970).
- Arrhenius, S. Philosophical Magazine and Journal of Science Series 5, Volume 41, 237-276 (1896).
- Climate Change 2007: Synthesis Report Summary for Policymakers An Assessment of the Intergovernmental Panel on Climate Change (2007).https://www.myclimate.org/en/information-climate-tips/climate-politics/ipcc-reports.html
- Balling, R. The Increase in Global Temperature: What it Does and Does Not Tell Us. Marshall Institute Policy Outlook (2003).
- Glassman, J. A. The Cause Of Earth’s Climate Change Is The Sun The Cross Fit Journal April (2010).
- Bernaerts A. "The Circumstances of the Arctic Warming in the early 20th Century1 Published at: CLIMATE 2009 / KLIMA 2009, 02 to 06 November (2009).
- Khandekar, M. L. Questioning the Global Warming Science:An Annotated bibliography of recent peer-reviewed papers (Short Version)http://www.intellectualtakeout.org/library/environment-natural-resources/climate-change-101/research-analysis-reports/questioning-global-warming-science-annotated-
- R. Borna, G. Roshan, A. K. Shahkoohi, Advances in Environmental Biology, Vol. 5 No.11: 3511-3517, 2011.
- R. K. Mall, A. Gupta, R. Singh, R. S. Singh and L. S. Rathore, Current Science, Vol. 90, No. 12, 2006.
- A. Busuioc, A. Dumitrescu, E. Soare and A. Orzan, Romanian Journal of Meteorology, Vol. 9, No. 1-2, 2007.
- J. P. Evans Theor Appl Climatol (2010) 99:389–402.
- http://www.cru.uea.ac.uk/cru/data/temperature/#sciref
- http://en.tutiempo.net/climate/iraq.html
- http://www.grida.no/publications/vg/climate/page/3062.aspx
- J. Zhou and K. TungJournal of the Atmospheric Sciences, Vol. 70, No. 1: pp. 3-8 (2013)
- G. WittJournal of Statistics Education Volume 21, Number 1 pp 1-24 (2013)


