
Journal of Environment Protection and Sustainable Development, Vol. 1, No. 3, July 2015 Publish Date: Jun. 6, 2015 Pages: 126-133
Comparative Assessment of Physical and Chemical characteristics of Water in Ekerekana and Buguma Creeks, Niger Delta Nigeria
Makinde O. O.1, Edun O. M.2, Akinrotimi O. A.2, *
1Department of Microbiology, University of Port Harcourt, Port Harcourt, Nigeria
2African Regional Aquaculture Centre/ Nigerian Institute for Oceanography and Marine Research Buguma, Port Harcourt, Nigeria
Abstract
Comparative assessment and seasonal variations of some physical and chemical parameters of waters in Ekerekana and Buguma creek were investigated from July 2012 to February 2013 for a period of eight months. Water samples were collected bi-monthly and analysed using standard methods. The results obtained indicated that significant differences (P<0.05) were recorded in all the parameters investigated in both creeks in all the months of study. Seasonally, variations were observed in all the parameters, with the exception of pH, alkalinity, and water hardness. Conversely, temperature, conductivity, salinity and nitrates were significantly (P<0.05) higher in dry season in both creeks, while the values of biological oxygen demand, turbidity, total dissolved solids (TDS), sulphates and chlorides were elevated in wet season.
Keywords
Water Quality, Environment, Creek, Niger Delta, Hydrology
Received: March 31, 2015
Accepted: April 19, 2015
Published online: June 3, 2015
@ 2015 The Authors. Published by American Institute of Science. This Open Access article is under the CC BY-NC license. http://creativecommons.org/licenses/by-nc/4.0/
1. Introduction
Water quality is defined in terms of its chemical, physical and biological contents. The water quality of rivers changes with seasons, human activities and geographical areas. It provides basic scientific information about water quality parameters, ecological relevant and toxicological threshold values to protect specific water uses [1]. Important physical and chemical parameters influencing the aquatic environment are temperature, rainfall pH, salinity, dissolved oxygen and carbon dioxide. Others are total suspended and dissolved solids, total alkalinity and the nutrient levels. These parameters are the determining factors for the survival of aquatic organisms [2,3].
Temperature is a limiting factor in the aquatic environment; water temperature is probably the most important environmental variable. It affects metabolic activities, growth, feeding reproduction distribution and migratory behaviours of aquatic organisms [4]. It affects solubility of gasses in water, gas solubility decrease with increase temperature. Hydrogen ion concentration or pH as one of the vital environmental characteristics, decides the survival, metabolisms, physiology and growth of aquatic organisms. Ramanatha et al. [5] recommended optimum range of pH 6.5-8.7 for growth of aquatic organisms, pH is influenced by acidity of the bottom sediment and biological activities. High pH may result from high rate of photosynthesis by dense phytoplankton blooms. According to Abowei [6], pH of between 7 to 8.5 is ideal for biological productivity, while pH that is lower then 4 is detrimental to aquatic life. pH of rivers may be affected by heavy metal toxicants as a result of water discharge, and run offs from surrounding environment [6].
Salinity is a degree of saltiness of a water body, it is a dynamic indicator of the nature of the exchange system. And expressed as the total concentration of electrical charge ions (cations) in water in part per thousand (‰). The cations include carbonates, sulphates and others. It is expressed either as a mass of these ions per unit volume or as milli-equipment of the ions per volume of water. It determines distribution of organisms in aquatic environments. The salinity of the water within the estuary tells us how much fresh water has mixed with sea water. [7]. The salt concentration directly affects the salinity, which impacts circulation within estuaries and coastal regions. In effect, dense saline water tends to flow under fresh water. Salinity is an important ecological parameters in its own right and it is important in some chemical processes [8].
Various human endeavours such as industrial, mining, farming and domestic activities also significantly affect the quality of water. Farming increase concentration of nutrients, pesticides and suspended sediments. Industrial activities also increase concentration of metals and toxic chemical, add suspended sediment, increases temperature and lower the dissolved oxygen in the water [9, 10]. Each of these effects can have a negative impact on the aquatic ecosystem and make water unsuitable for potential uses [11]. The quality of water in an aquatic environment is vital for its productivity,. It is an index of health and well being of the ecosystem and has an indirect impact on human health. Physicochemical parameters of water provide nutritional balance and ultimately govern the biotic relationships of organisms in an aquatic ecosystem; including ability to withstand pollution load. Conversely, urbanization and modern agriculture practices directly impact the water resources quantitatively and qualitatively. Many industries are sited near these bodies of water presumably to facilitate easy discharge of effluents and other pollutants into them. [12, 13] Ekerekana and Buguma creeks are unique aquatic environment in the tropical belt with marked maritime influence due to riverine inflow, vertical mixing, coastal nutrient enrichment, oil pollution and other anthropogenic sources. They are also one of the ecologically and economically rich marine ecosystems in the Niger Delta region of Nigeria, providing breeding grounds for a variety of fish and shrimp species. Numerous activities such as oil exploitation and exploration, laundry, fuel wood exploitation and capture fisheries take place along the creeks. This study seeks to provide basic information and to enrich the scientific knowledge of the coastal ecosystem of Nigeria with particular reference to Ekerekana and Buguma for its effective management and sustainability of aquatic resources in the area.
2. Materials and Methods
2.1. Study Area
The study area investigated consists of one effluent receiving sites in the Okirika arm (Ekerekana creek) of the Bonny River estuary and the Buguma creek, all in the Rivers State. Ekerekana creek is located in Okirika Local Government Area of Rivers State and is spatially located between latitude 040 and 500N and longitude 070 and 100E. About 95% of the total area is wet land, characterized by a network of meandering water channels, comprising mainly of creeks and small rivers which drain into short swift coastal rivers. The creek receives faecal matters, domestic wastes and industrial effluents on regular basis. While Buguma creek is located in Asari Toru Local Government Area of Rivers State. It is located between longitude 60 47’E and 60 59’E and 40 36’N and 40 59’N. The Buguma creeks systems consist of the main creek channel and associated inter connecting creeks, which interconnect and surround Buguma and other communities [14].![]()
![]()
![]()
![]()
![]()
2.2. Sampling Procedure
The sampling was carried out bi-monthly between July 2012 and February 2013, covering four wet months (July to October) and four dry months (November to February). Water samples were collected monthly with sterile plastic containers from Ekerekana Creek in Okirika Local Government Area and Buguma creek in Buguma Town, Asari Local Government Area, both in Rivers State of Nigeria. The containers were rinsed three times with the water samples to be collected at the site before collection was made.
2.3. Measurement of Water Quality Parameters
Water temperature was measured in-situ using mercury-in-glass thermometer. The turbidity of the water was also measured in-situ by using a secchi disc [15]. Biochemical oxygen demand (BOD) was determined by the Winkler’s method [15]. Hydrogen-ion concentration (pH) and conductivity were measured in the laboratory with pH meter and conductivity meters, respectively. Salinity was obtained by hand held salinometer. Total dissolved solids (TDS), ammonia, nitrate and sulphate were determined gravimetrically (APHA 1998). The chloride, alkalinity and water hardness content was determined by titrimetric method [15].
2.4. Stastitical Analysis
The data obtained from the laboratory were collated. The Microsoft Excel was used for the graphical presentation.
3. Results and Discussion
The results of the physicochemical analysis of water from Ekerekana and Buguma Creek are presented in Figures 1 to 12. The results revealed that pH varied from 6.6 to 7.2 (Fig.1). The pH values in Ekerekana was more alkaline in the months of July, August, September, December and February, while Buguma water have higher values in October, November and January (Fig. 1) The pH varied significantly between the two creeks, the pH of water in Ekerekana creek was found to be higher in the wet season months, while higher values were observed in Buguma creek in the dry season months of November to January (Fig.1). The higher pH value in Ekerekana creek in wet season may be associated with high fresh water emptying into the creek from the adjoining streams and municipal drains [16, 17]. This implies that season has a significant role in the pH of the creeks, similarly, Egborge [18] reported same at Orugbo creek in Warri during the rainy season. The lower levels of pH observed in Buguma creek may be due to excessive flooding of acidic sulphates from the soil into the creeks [19]. The elevated levels of pH in dry season’s months observed in Buguma creek, is similar to the one obtained by Orhibabor et al. [20] in the same creek. This may be attributed to the reduced rainfall in these months, which also reduces flooding of the acid sulphate from the soil into the creeks.
The turbidity values recorded in this study ranges from 1.00 to 7.00 NTU. The lowest mean turbidity value (1.00 NTU) was recorded in Buguma creek in the dry months (December, January and February). While the highest value (6.91 NTU) was recorded in Ekerekana creek in the month of August (Fig. 2). Interestingly, the values of Turbidity in Ekerekana creek were higher than Buguma creek, in all the months of study (Fig. 2). The turbidity in the two creeks was higher in the rainy season (July to October) than the dry season months (November to February). This phenomenon may be due to continuous and excessive washing of debris, silt and clay into the creeks [21]. Asuquo and Etim [22] also reported that high turbidity could result from the presence of colloidal particles arising from clay and silt during rainfall or from discharges of sewage and industrial waste or the presence of large number of microorganisms. Turbidity is an important operational parameters in process control and can indicate problems with treatment process, particularly coagulation/sedimentation and filtration [23].
The water temperature recorded in this study ranged between 27.42 – 31.10c. The lowest water temperature (27.200c) was recorded in Buguma creek in the month of August, and the highest temperature value (31.10c) was recorded in both creeks in January and February (Fig. 3). The temperature values shown slight variations with seasons. This observation was found to be consisted with the trends reported in previous studies in Niger Delta [24, 25, 26]. The conductivity values recorded in this work ranged from 18,000 to 27,000.0 S/m. Seasonally, lower values of conductivity were observed in the dry seasons months (November to February) compared to wet seasons months (July to August). The lowest value of (18,000 S/m) was recorded in Ekerekana creek in the month of August (Fig. 4). The conductivity values ranged from 18,000 S/m to 28,000 S/m. which is indicative that the water is brackish as reported by Egborge [(27] in his study of Warri River, he further classified waters with conductivity values above 40,000 0s/cm as marine, below 1000 0s/cm as fresh water and in between these two as brackish. The variation in these creeks is suggestive of the one influence of the sea while the seasonal differences observed for the conductivity is a clear indication of the role of season in the ionic distribution in the two creeks. The higher conductivity values in the dry season could also be attributed to the combination of low precipitation and high atmospheric temperatures, resulting in high evapotranspiration rates, high ionic concentration, and saline intrusion from underground sources or the ocean. The levels of conductivity measured in the two creeks are consistent with values obtained in most waters of the Niger Delta by Nwadiaro [28], Agbozu and Emperor[(29], Agbozu and Izidor [30], and Obunwo [31].The level of salinity observed in this study is typical of the brackish water environ found in the Niger Delta area [32]. The variations between the dry and wet season may be due to precipitation rate which is low in dry season and rate of evaporation which is high in the dry season [33].
The values of salinity measured in the two creeks under study, ranged from 5.2 to 20.81‰. The lowest (5.21%) and highest (18.89%) salinity values were both recorded Buguma Creek in August and February respectively. It was observed that salinity was higher in the dry season months than the wet season (Fig. 5).The Total Dissolved Solids (TDS) values recorded in this work, ranged from 60.10 to 180.10NTU. The TDS values in Ekerekana creek was found to be consistently higher than the Buguma creek in all the months, with the lowest value (60.10NTU) at Buguma Creeks in the month of February, while the highest (178.64NTU) at Ekerekana creeks in the month of August (Fig.6). The total Dissolved Solids (TDS) obtained in the two creeks is in line with the one obtained by Otobo [34] in Taylor creek in Niger Delta. The TDS obtained in Ekerekana creek was higher than that obtained in Buguma creek. The high TDS load of Ekerekana creek may be attributed partly to the turbulence occasioned by the movement of speed boats and dredging activities. Another possible important factor is the tidal related factor of waves and currents which agitate the sediment. Furthermore, bioturbation could be very important in contributing to the high TDS, as the estuary labours several species of polychaetes, crabs and other benthic feeders and dwellers capable of reworking and agitating the bottom sediment [35, 36].
The nitrate values recorded during the study varied between 0.08mg/l and 0.46mg/l. The values of nitrate in Ekerekana creek was significantly (p < 0.05) higher than Buguma creek in all the months, with the lowest value (0.07mg/l) in Buguma creek in the month of September and the highest 0.46mg/l in Ekerekana creek in the month of January (Fig. 7).The sulphate values recorded during the study was between 7.10 and 24.64mg/l. With the lowest value (7.34mg/l) recorded at Buguma creek in the month of February and the highest 22.88 in Ekerekana creek in the months of September and October (Fig. 8). In this study, the values of sulphate ions were found to be higher in the wet season’s months (July to August) than the dry season’s months (November to February) and found to also be consistently higher in Ekerekana than Buguma creek (Fig. 8). The values of chloride (Cl-) recorded during the study ranged from 10.12 to 27.81mg/l. The highest value (26.11mg/l) was recorded in Ekerekana creek in the month of September and the lowest value (11.21mg/l) in the month of February. The chloride values in this study were found to be higher in water from Ekerekana creek than Buguma creek in all the months under considerations (Fig. 9). The available nutrients in the two creeks under consideration were generally low. Low nutrient levels have been reported for the Niger Delta river system by other researchers [37, 38, 39]. The reason for the low nutrients have been attributed to high activity rate of organisms and their ability to generally use up the nutrient in water column and also to the nature of the bedrock of the drainage basin which is not essentially rich in sulphate and nitrate. The type and density of organisms in the water bodies may be responsible for the rapid uptake of nutrients [40].The high concentrations of No3- and S042- in Ekerekana creek may be attributed to oxidation of sulphite to sulphate from decaying organic materials. Furthermore, the various activities going on by the shores of the creek, such as lower sewage discharge, drainage, soil disturbance during construction, stream channelization and dredging have been identified as major sources of nutrients and other elements introduced into the aquatic environment [41]. The concentration of chloride recorded during this work is in line with that of Davies et al. [42] in Trans-Amadi creek but contrary to the findings of Ekeh and Sikoki [43] in New Calabar River. The difference observed may be as a result of environmental factors. The higher levels of chloride ions recorded in Ekerekana creek may be attributed to the influx of allochtonous and inorganic materials such as effluents from the surrounding area.
The values of alkalinity observed in this work ranged from 5.8 to 11.6mg/l. The lowest mean value (6.11mg/l) observed in Ekerekana creek in September and the highest value (10.6mg/l) recorded in Buguma within December. Interestingly, the water alkalinity values in Buguma creek were consistently higher than that of Ekerekana creek in all the months of study (Fig. 10). High alkaline water with high pH with elevated levels of dissolved solids. Such water is not suitable for use in boilers, for processing municipal water systems [43]. It shows the ability of the water to support algal growth and other aquatic life (water fertility). The level of alkalinity of the two creeks is below permissible level of 200mg/l and therefore does not pose challenge [44]. The water hardness in Ekerekana creek was generally higher than that of Buguma creek in all the months of study. This may be due to high levels of calcium and magnesium carbonates consequent of continuous discharge of effluents into the Ekerekana creek [45].
The water hardness recorded in this study was between 20.2 and 43.92mg/L with the highest value (40.81mg/l) observed in Ekerekana creek, in the month of September and the lowest (21.2mg/l) in January. Interestingly, the water hardness in Ekerekana creeks was consistently higher than that of Buguma creek in all the months under consideration (Fig. 11). The values of Biological Oxygen Demand ranged from 1.8 to 6.49mg/l; with the highest value (6.49mg/l in Ekerekana creek in the month of October, while the lowest value (2.21mg/l) was recorded in Buguma creek in the moths of December and January. The BOD values recorded in Ekerekana creek were comparatively higher than those of Buguma creek throughout the study (Fig 12). The pattern of BOD variations in the two creeks indicated that the value of BOD in Ekerekana was consistently higher than the one of Buguma creek, with Ekerekana exceeding permissible limit of 4.0mg/l [45]. According to the rankings of World Health Organization [45] water bodies with BOD levels between 1.0 and 2.0mg/l are considered clean, 3.0mg/l, fairly clean; 5.0mg/l doubtful, and 10.0mg/l definitely bad and polluted. The Ekerekana creek which has BOD concentrations lower than 6.0mg/l may be said to be doubtful. The high BOD is indicative of the presence of organic and inorganic pollutants. The mean BOD values for Okerekana creek exceeded the recommended maximum allowable concentrations (RMC) set by the European Union for good quality water. (3.0 - 6.0) (46). Unpolluted waters typically have BOD values of 2mg/l or less. Where as those receiving waste waters may have values up to 8mg/l or more (47). It was reported that BOD is responsible for odour and taste of water. The high BOD values may be due to the discharge of untreated or incompletely treated industrial effluents into the river from the Port Harcourt Refinery.
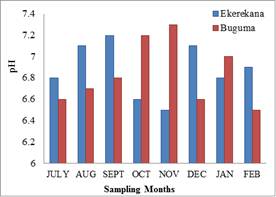
Fig. 1. Variations in pH values of water in Ekerekana and Buguma Creeks.
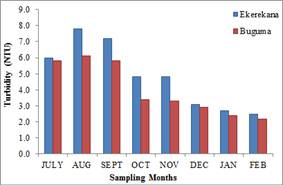
Fig. 2. Variations in the values of Water Turbidity in Ekerekana and Buguma Creeks.
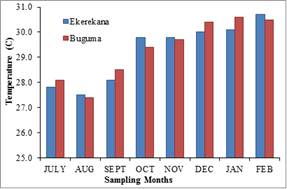
Fig 3. Variations in the values of Water Temperature in Ekerekana and Buguma Creeks.
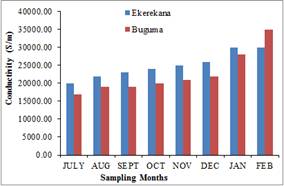
Fig. 4. Variations in the values of Water Conduvtivity in Ekerekana and Buguma Creeks.
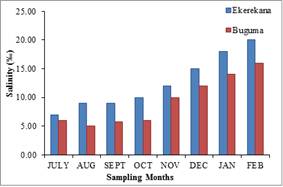
Fig. 5. Variations in the values of Water Salinity in Ekerekana and Buguma Creeks.
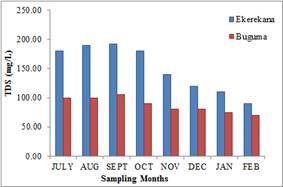
Fig. 6. Variations inTotal dissolved solids (TDS) of water in Ekerekana and Buguma Creeks.
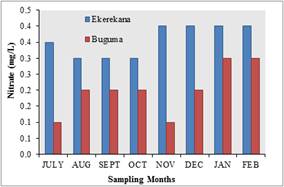
Fig. 7. Variations in the values of Nitrate of water from Ekerekna and Buguma Creeks.
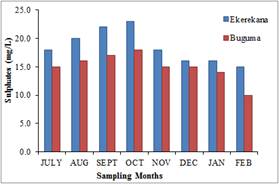
Fig. 8. Variations in the values of Sulphates in water from Ekerekana and Buguma Creeks.
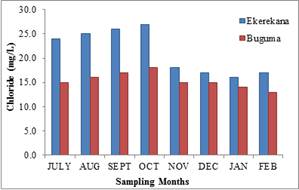
Fig. 9. Variations in the values of Chlorides in water from Ekerekana and Buguma Creeks.
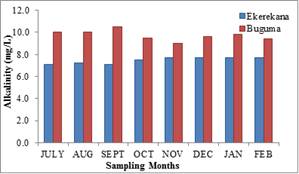
Fig. 10. Variations in the values of Alkalinity in water from Ekerekana and Buguma Creeks.
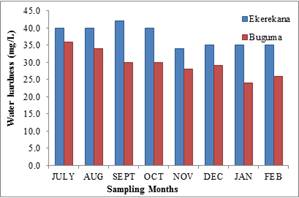
Fig. 11. Variations in Water hardness in Ekerekana and Buguma Creeks.
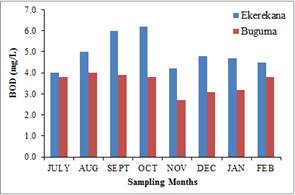
Fig. 12. Variations in Biological Oxygen Demand (BOD) in Water from Ekerekana and Buguma Creeks.
4. Conclusion
Seasonal variations were observed in the concentrations of various water quality parameters, most of these parameters evaluated showed higher concentrations during the rainy season when water volume is increased to its maximum. Sulphate and nitrate which are components of agricultural fertilizers commonly used by farmers in the Niger Delta, showed reduced concentration. Nutrients level in the receiving water body has been associated with the oil operations because of the changes in concentrations during the rainy season which suggests an additional source of nutrients in the water body. However, higher turbidity values were attributed to periods of higher runoff, flooding and erosion. Additionally, ongoing sand dredging/mining activities in the River Niger region as well as the lotic distribution of suspended particles contributed to the overall turbidity of the river. This study has shown that industry effluents discharged into Ekerekana creek resulted in the presence of high concentrations of pollutants in the water body.
References
- Lawson, E.O. (2011). Physico-chemical parameters and heavy metal contents of water from the mangrove swamps of Logos, Lagoon, Nigeria Advances in Biological Research 5(1): 08-21.
- Chitmanat, C. and S. Traichaiyaporn, S., (2010). Spatial and temporal variations of physico-chemical parameters of water quality and some heavy metals in water, sediments and fish of Mae Kuang River, Northern Thailand. International Journal of Agriculture and Biology, 12(6): 816-820.
- Akinrotimi, O., Aranyo, A.A. and Ibemere, I.F. (2011). Effects of capture handing and confinement on the glucose levels of black jaw tilapia, Sarotherodun melanotheron. Advances in Students Research 2: 27 – 30.
- Crillet, C. and Quetin P. (2006). Effect of temperature changes onassociated cholera-like diarrhea and blood stream infection in the United States Journal of Infection., 187: 866-868.
- Ramanatha, N, P. Padmavathy, T., Francis, S., Athithian P.G and Selvaranjitham N. (2005). Manual on polyculture of tiger shrimp and carps in freshwater. Tamil Nadu Veterinary and Animal Sciences University, Fisheries and Research Institute, thothukudi, pp: 1-161.
- Abowei, J. F. N. (2010). Salinity, dissolved oxygen, pH and surface water temperature conditions in Nkoro River, Advances Journal of Food Science Technology., 2(1): 16-21.
- Edokpayi, C. A. (2005). Variation of chemical constituents of a brackish water prawn habitat in Southern Nigeria. Acts SATECH, 2(1): 11-18.
- Abowei, J. F. N. and A. D. I. George, (2010). Some physical and chemical characteristics in Okpoka creek, Niger Delta. Research Journal Environment and Earth Science. 1(2): 45-53.
- Tery, C. K., R. Asmah and C. A. Biney, (2009). Trace Metal Levels in Water and Sediment from the Sakumo II and Muni lagoons, Ghana. Ecology, 16: 75-94.
- Akinrotimi, O.A., Edun, O.M. and Mebe, E.D (2013). Effects of clove seed as anaesthetic agents in two species of grey mullets Liza falcipinnis and Liza grandisqumis. Journal of Aquatic Science, 1(1): 7 – 10.
- 11.Burgman, U. (2003). Metal speciation and Toxicity of free metal ions to aquatic biota. In Aquatic toxicity, Advances in Environment Science and Technology. (Nriagu, J. O. ed), 13: 47-73. John Willey & Sons, New York.
- Udoessien, E. I. (2003). Basic principles of environmental Science", Etiliew InternationalPublishers, Uyo,Nigeria, 339p.
- Edokpayi, C.A., Saliu, J. K., & Eruteya, O. J. (2010). Assessment of Temporal Fluctuations in Water Quality ofthe Coastal Waters of Training Mole, Tarkwa Bay, Nigeria. Journal of American science, 6(10): 1179 -1185.
- Orhibhabor, B. J. and Ogbeibu, A. E. (2009). Concentrations of heavy metals in a Niger Delta mangrove creek, Nigeria. Global Journal of Environmental Sciences 8(2):112- 120.
- APHA, (1998). Standard Methods for the Examination of Water and wastewater. 20th Ed., American Public Health Association, New York, USA. 1218pp.
- Chindah, A.C., Braide, S.A., Oranye, R.O., (2004). Response of a community Niger Delta wetland Catfish to changes in pH. Niger Delta Biologia 4(2), 56-65.
- Akinrotimi, O.A., Gabriel, U.U and Deekae, S.N. (2014). Investigations on the potential of Indian almond free (Terminalia catapaa) leaf extracts as anesthetic agents in African catfish (Clarias gariepinus). Journal of Aquatic Sciences 29(1B): 223 – 231.
- Egborge, A.B.M. (1994). Industrialization and heavy metals pollution in Warri River. 32nd Inaugural lecture, University of Benni, Benin city Nigeria 32pp.
- Nduka, J.K., Orisakwe, O.E and Ezenweke, L.O (2008). Some physio0chemical parameters of potable water supply in Warri, Niger Delta Area of Nigeria. Scientific Research and Essay 3(11): 547-551.
- Ekeh, I. B., & Sikoki, F. D. (2003). The State and Seasonal variability of some pysico-chemical parameters in the New Calabar River, Nigeria. Supp ad Acta Hydrobiol. 5, 45-60.
- Obunwo C.C (2003): Assessment of the water quality and heavy metal concentrations in sediments and some aquatic organisms from Port Harcourt streams. Ph.D Thesis River State University of Science and Technology. 258pp.
- Asuquo, J.E and Etim, E.E (2012) physio-chemical and bacteriological analysis of borehole water in selected area of Uyo metropolis. International Journal of Modern Chemistry 2(1): 7-14.
- Chindah, A.C., Braide, S.A., and Nduaguibe, S.A (2008). Tolerance of periwinkle Tympanotonus fuscatus and shrimp to waste water from bonny light crude oil tank farm. Polish Journal Environment 21:61-72.
- Chindah A. C, Sibeudu O. C, Braide S. A. Onyebuchi C. (1991) Distribution of hydrocarbons and heavy metals in sediment and a crustacean (Shrimps – Penaeus notialis) from the bonny/new calabar river estuary, Niger Delta. African Journal Environment Assessment Management 9: 1 – 17.
- Ebere, N. (2002). The Impact of Oil refinery effluents on the distribution, abundance and community structures of Macrobenthos in Okrika Creek. Ph.D Thesis. Rivers State University of Science and Technology, Port Harcourt.
- Otokunefor, T.V. and Obiukwu, C. (2005). Impact of refinery effluent on the physicochemical properties of a water body in the Niger Delta. Applied Biology and Environment Ressearch 3 (1):61-72.
- Egborge, A.B.M. (1994). Industrialization and heavy metals pollution in Warri River. 32nd Inaugural lecture, University of Benni, Benin city Nigeria 32pp.
- Nwadiaro, C.S (1989): Icthyofauna of Lake Oguta a shallow Lake in Southern Nigeria. Arch Hydrobiology 115 (3): 413-425.
- Agbozu I.E and Emperor J. (2004). Effect of Waste Dump on Water Quality of Central Sombreiro River in the Niger Delta, Nigeria. Journal of Agricultural and Environmental Engineering Technology. (1) 1p: 48-54.
- Agbozu, T. E, Izidor K. Heavy metals in sediments from lower Taylor Creek in the Niger Delta area of Nigeria. African Journal of Science 5(1): 1043 –1049.
- Obunwo C.C (2003): Assessment of the water quality and heavy metal concentrations in sediments and some aquatic organisms from Port Harcourt streams. Ph.D Thesis River State University of Science and Technology. 258pp.
- Chindah A. C, Sibeudu O. C, Braide S. A. Onyebuchi C. (1991) Distribution of hydrocarbons and heavy metals in sediment and a crustacean (Shrimps – Penaeus notialis) from the bonny/new calabar river estuary, Niger Delta. African Journal Environment Assessment Management 9: 1 – 17.
- Chindah, A.C, and Pudo, J. (1991) A Preliminary checklist of Algae found in plankton of Bonny River in Niger Delta, Nigeria – Gragm. Fragment of florized Geology and Botany 36 (1): 112-126.
- Otobo, A.J. T (1995). The ecology and Rislery of the pygmy Herriry Sierrtheriss, leonensis in the Nun River and Taylor creek of the Niger Delta Ph.D Thesis. University of Port-Harcourt.
- Nweke A.A (2000). Impact of Organic Waste Pollution on the Macrobenthos and fish fauna of Elechi Creek. Ph.D Thesis. RSUST, PH. 386pp.
- Edet, E.J., Etim, E.E. and Titus, O.M (2012). Bacterioligical and streams water in Nduetory Oku community Uyo, Akwa Ibom State, Nigeria. International Journal of Modern Chemistry 3 (1): 65-73.
- Erondu, E S and Chinzah, A.C (1991). Variations in the physic-chemical feature and phytoplankton of New Calabar River at Alor, River State, Nigeria. Nigeria Institute of Oceanography and Marine Research Technical Paper 75: 3-18.
- Chindah, A.C, Hart, A.I. and Uzoma, A. (2009). Prepiphyton associated with submerged macrophyte (Nations Journal of Agriculture Biotechnology and Environment) in the Upper reaches of the New Calabar River, Niger Delta1 (2). 37-40.
- Chindah, A.C, Braide, S.A, Amakiri, J. and Chikwendu. S.O.N (2003). Heavy Metal concentrations in Sediment and Periwinkle Tympanotorus fuscatus in the different ecological zones of Bonny Rivers State, Niger delta, Nigeria. The Open Environmental Pollution and Toxicology Journal 10:93-106.
- Etim, E.E., Odoh, R., Itodo, A.u and Lawal, U (2013). Water quality Index for the Assessment of water quality from different sources in the Niger Delta region of Nigeria. Frontiers in science 3(3): 89-95.
- Burse, E., Arscolt, D. B and Tocker, K (2009). Sources and distribution of organic carbon and nitrogen in the Tagliamento River, Aquatic Sciences 66:103.
- Davies, O.A., Allison, M.E. and Uyi A.S (2006). Bioaccumulation of heavy metals in waters, sediment and periwinkle from Elechi Creek Niger Delta. African Journal of Biotechnology 5(10): 968-983.
- Agbaire P.O and Obi C.G (2009). Seasonal Variations of some physico0chemical properties of River Ethiopic water in Abraka, Nigeria. Journal of Applied Science Environment Management 13 (1): 55- 57.
- Fakayode, S.O (2005). Impact of industrial effluent on water quality of the receiving Alaro River in Ibadan, Nigeria. Ajeam-Rageea Journal 10:1-3.
- WHO (2005). Risk and Protein requirements. Report of a joint FAO/WHO Ad Hoc Expert committee, FAO. Rome.
- Okoli, C. G., Ogbuagu D. H., Gilbert, C. L ., Madu S., Njoku-Tony, R. F (2011). Proximal innul of polynuclear aromatic hydrocarbons in ground water sources of Okirika mainland Nigeria. Journal of Environmental Protection 2:848-854.
- Ogbuagu, D. A; Okoli, G. C; Gilbert, C. L and Madu, S. (2011). Determination of the contamination of ground water sources in Okirika mainland with Polynuclear Aromatic hydrocarbons. British Journal of Environmental and Climate Change 1(3): 90-102.


