
International Journal of Materials Chemistry and Physics, Vol. 1, No. 3, December 2015 Publish Date: Sep. 13, 2015 Pages: 229-241
Synthesis and Acoustical Study of Pyrazolo Quinazoline Derivatives in N, N-dimethyl Formamide at Different Temperatures
Shipra Baluja*, Paras Ramavat, Kajal Nandha
Physical Chemistry Laboratory, Department of Chemistry, Saurashtra University, Rajkot (Gujarat), India
Abstract
Some new pyrazolo quinazoline derivatives have been synthesized and their structure confirmation was done by spectroscopic methods such as IR, 1H NMR and 13C NMR. The acoustical properties of these synthesized derivatives were done in N, N-dimethyl formamide (DMF) solutions of different concentration by measuring density, sound velocity and viscosity at different temperatures. The density and sound velocity were measured by using Anton Paar Density and Sound Velocity meter (DSC 5000M) whereas viscosity has been measured by the Ubbelohde viscometer. From these experimental data, some acoustical parameters such as adiabatic compressibility (κs), intermolecular free length (Lf), internal pressure (π), free volume (Vf), solvation number (Sn), apparent molar compressibility (fk), apparent molar volume (fv), etc., have been evaluated. The results are interpreted in terms of solute-solute and solute-solvent interactions to understand the behavior of synthesized compounds in solutions. It is observed that sound velocity and solvation number increase with increase in concentration whereas intermolecular free path length and adiabatic compressibility decrease with increase in concentration. These studied parameters suggest that as increase in concentration of solute, solute-solvent interaction increases. The positive values of solvation number are due to appreciable solvation of compounds in DMF. The evaluated apparent properties also confirm the predominance of solute-solvent interactions in DMF solutions of studied compounds.
Keywords
Pyrazolo Quinazoline Derivatives, Ultrasonic Velocity, Apparent Molar Compressibility, Apparent Molar Volume, N,
N-dimethyl Formamide
Received: August 5, 2015
Accepted: September 3, 2015
Published online: September 13, 2015
@ 2015 The Authors. Published by American Institute of Science. This Open Access article is under the CC BY-NC license. http://creativecommons.org/licenses/by-nc/4.0/
1. Introduction
Pyrazolo quinazolines are the important class of compounds which exhibits a wide spectrum of pharmacological activities such as anti cancer [1, 2], anti inflammatory [3-5], anti bacterial [6-9], anti viral [10], anti fungal [11,12] etc. A large number of quinazoline derivatives are known to be used for the synthesis of various drugs [13, 14].
Ultrasonic technology is known to have various applications in numerous fields such as engineering [15], food [16], chemical [17], water treatment [18], medicine [19] etc. Further, ultrasonic velocity measurements have been used in investigating various pure liquids, their mixtures and solutions to study molecular interactions [20, 21]. Many types of molecular interactions that may operate between molecules of different types are dispersion forces, hydrogen bonding and dipole and dipole-induced dipole interactions. The study of molecular interactions in liquid mixtures and solutions is important for the elucidation of the structural properties of molecules [22]. Acoustical parameters obtained by density, viscosity and ultrasonic speed provide information about the nature and strength of these molecular interactions [23, 24]. It also gives information about bonding between molecules and formation of complex at different temperatures through various interactions [25]. Acoustical properties of some solutions of compounds such as Schiff bases, dihydropyrimidines, drugs etc. [26-29] have been studied by our research group.
In the present work, some new quinazoline derivatives have been synthesized and their density, sound velocity and viscosity were measured in N, N, dimethylformamide solutions at different temperatures (298.15 K, 308.15 K and 318.15 K) over a wide range of concentrations. From these experimental data, some acoustical parameters such as adiabatic compressibility (κs), intermolecular free length (Lf), solvation number (Sn), apparent molar compressibility (fk), apparent molar volume (fv) etc., have been evaluated in order to study molecular interactions in solutions.
2. Experimental
Materials:
α-tetralone and different substituted benzaldehydes used for the synthesis, were supplied from Spectrochem Pvt. Ltd. (Mumbai, India) and were used without any treatment.
The DMF used was of AR grade supplied by Spectrochem Pvt. Ltd. (Mumbai, India) and was purified according to the standard procedure [30]. The distilled DMF was stored over molecular sieves. The purity of DMF was confirmed by GC-MS (SHIMADZU-Model No.-QP-2010) equipped with column (DB-5MS, 25 m in length, 0.20 mm internal diameter and 0.33μm film) and was found to be 99.99%.
Synthesis:
Synthesis of different chalcones (Int.-I):
Equimolar mixture of α-tetralone and different substituted benzaldehydes in methanol were stirred at room temperature (RT) for 4 hrs in presence of catalytic amount of potassium hydroxide. The completion of reaction was confirmed by analytical thin layer chromatography (TLC) (Performed on aluminum coated plates Gel 60F254 (E. Merck)) using (7:3-Hexane: Ethyl acetate) as mobile phase. After completion of reaction, the reaction mass was cooled and the resulting solid was filtered, washed with water and dried under vacuum to give crude product. The obtained crude product was purified by adding suitable solvent (diethyl ether) to remove colored, non polar impurity by scratching/stirring. The product was then allowed to settle down and the above solution was decanted. The procedure was repeated 3-4 times to remove impurities. The purity of resulting compound (Int.-I) was 99.5% as determined by gas chromatography.
Synthesis of 5-amino-3-(methylthio)-1H-pyrazole-4-carbonitrile (Int.-II):
A mixture of malanonitrile (0.01 mol) and dry K2CO3 (0.012 mol) were stirred in dry DMF at room temperature for 30 min. To this reaction mixture, 0.02 mole of carbon disulphide was added drop wise and the resulting solution was stirred for 2.5 hrs at room temperature. The solution was then cooled at 0 to 5°C. To this cooled solution, 0.02 mole dimethyl sulphate (DMS) was added and the solution was again stirred for 5-6 hrs at room temperature. The progress of the reaction was monitored by thin layer chromatography. After completion of the reaction, it was poured into crushed ice to give solid product. The resulting solid was filtered, washed with cold water and dried under vacuum to give crude product.
Equimolar solution of this crude product and hydrazine hydrate in isopropyl alcohol (IPA) was refluxed for 30 min. The reaction mixture was then poured into crushed ice. The resulting solid was filtered, washed with water and dried under vacuum to give product. The obtained crude product (Int.-II) was purified using hexane and was used in the next step without further purification.
Synthesis of pyrazolo quinazoline derivatives:
An equimolar mixture of Int-I (chalcones) and Int-II (5-amino-3-(methylthio)-1H-pyrazole-4-carbonitrile) were refluxed in n-butanol for 5-6 hrs. The completion of reaction was confirmed by Thin Layer Chromatography using (6:4- Hexane: Ethyl acetate) as a mobile phase. The reaction mixture was then allowed to cool and the resulting solid was filtered, washed with diethyl ether to remove impurities. The procedure was repeated 3-4 times to free the product from impurities.
Overall, five pyrazolo quinazoline derivatives are synthesized.
KC-1:7-(4-chlorophenyl)-10-(methylthio)-5,6,7,9-tetra hydrobenzo[h]pyrazolo[5,1-b]quinazoline-11-carbonitrile
KC-2:7-(4-methoxyphenyl)-10-(methylthio)-5,6,7,9-tetrahydrobenzo[h]pyrazolo[5,1-b]quinazoline-11-carbonitrile
KC-3:7-(4-fluorophenyl)-10-(methylthio)-5,6,7,9-tetrahydrobenzo[h]pyrazolo[5,1-b]quinazoline-11-carbonitrile
KC-4:7-(4-bromophenyl)-10-(methylthio)-5,6,7,9-tetra hydrobenzo[h]pyrazolo[5,1-b]quinazoline-11-carbonitrile
KC-5:7-(3,4-dimethoxyphenyl)-10-(methylthio)-5,6,7,9-tetrahydrobenzo[h]pyrazolo[5,1-b]quinazoline-11-carbonitrile
The reaction scheme is given in Figure 1.
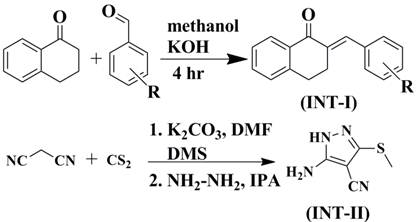
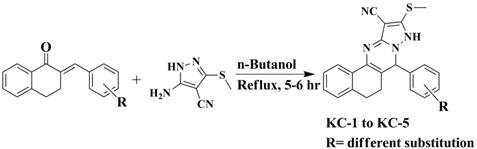
Figure 1. Reaction scheme of pyrazolo quinazoline derivatives.
Spectroscopy study:
The characterization of all these synthesized compounds was done by IR, NMR and mass spectral data. IR spectra were recorded on Shimadzu FT-IR-8400 instrument using KBr pellet method. The Mass spectra were recorded on Shimadzu GC-MS-QP-2010-Ultra model using direct inlet probe technique. 1H NMR spectra were taken on Bruker Avance II 400 MHz in DMSO-d6 using TMS as an internal standard. 13C NMR Spectra were also taken on Bruker Avance II 400 MHz in DMSO-d6 using TMS as an internal standard. Elemental analysis was done by Elemental analyser EURO EA 3000 instrument.
Melting points were measured by Differential Scanning Calorimeter (Shimatzu-DSC-60) with an accuracy of ±10C.
The physical properties of all the synthesized compounds are given in Table 1 with their substitutions.
Table 1. Physical properties of synthesized pyrazolo quinazoline derivatives.
| Compound Code | Substitution R | Molecular Formula | Molecular Weight | Yield (%) | Melting Point 0C |
| KC-1 | -4-Cl | C22H17ClN4S | 404.09 | 78 | 242 |
| KC-2 | -4-OCH3 | C23H20N4OS | 400.14 | 79 | 253 |
| KC-3 | -4-F | C22H17FN4S | 388.46 | 78 | 249 |
| KC-4 | -4-Br | C22H17BrN4S | 449.37 | 76 | 268 |
| KC-5 | -3,4-diOCH3 | C24H22N4O2S | 430.52 | 71 | 227 |
3. Measurements of Density, Viscosity and Ultrasound Velocity
Apparatus and Procedure
Solutions of different concentrations (0.01 to 0.1M) were prepared in DMF for all the five synthesized compounds and were kept at desired temperatures in air tight bottles. An electrical balance (Mettler Toledo AB204-S) with an accuracy of ±0.1 mg was used for the preparation of solutions.
Measurements of Density, and Ultrasound velocity:
Ultrasonic velocity and density measurements of pure DMF and solutions of compounds have been done by using Anton Paar Density and Sound Velocity meter (DSC 5000M) with accuracy of ±0.5 m/s and ±0.000005 g/cm3 respectively. The instrument was fully automated and the temperature was automatically controlled. Calibration was carried out using Milli-Q-water (Millipore Pvt. Ltd. Bangalore, India).
Measurement of viscosity:
The Ubbelohde viscometer of 25 ml capacity was used for the measurement of viscosity. The pore size of capillary of viscometer was 0.5 mm. The viscometer was calibrated with Milli-Q-water. A digital stop watch (Hanhart-Germany) with accuracy of ±0.01 s was used to measure the flow time of water and solutions. The flow time of water was found to be 44.42 sec. The temperature stability was maintained within ± 0.1 K by circulating thermo stated (NOVA NV-8550 E, accuracy of ± 0.1 K) water around the viscometer. The accuracy of viscosity is ± 0.06 %.
4. Results and Discussion
The IR, 1H NMR and 13C NMR spectrums for the compound KC-2 are shown in Figs. 2, 3 and 4 respectively.
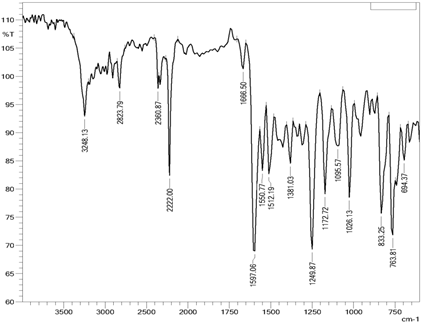
Figure 2. IR spectrum of compound KC-2.
Figure 3. 1H NMR spectrum of compound KC-2.
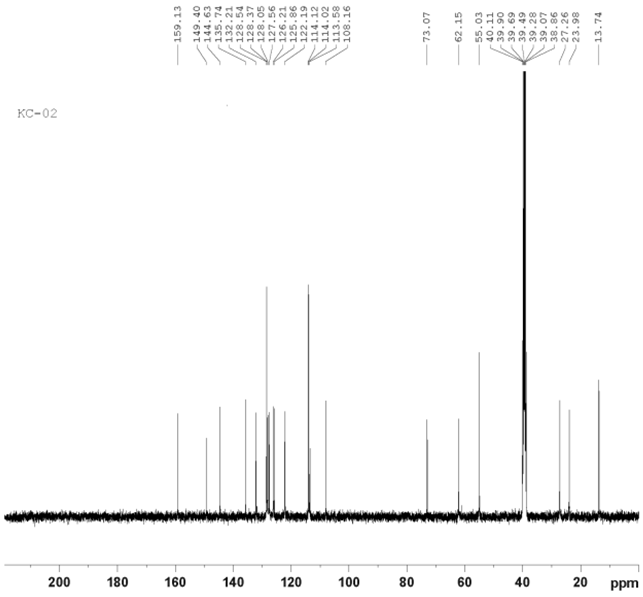
Figure 4. 13C NMR spectrum of compound KC-2.
Spectral Data:
KC-1:
IR (cm-1, KBr): 3475.85 (-NH (sec.) str.), 3049.56 (Ar-H str.), 2924.18(-CH2 sym. str.), 2227.86 (-CN str.), 1664.62(C=C str. α,β unsaturated 6-member ring), 1604.83(-NH bending vib. Secondary amine), 1381.08 (-CH bending.), 1315.50(C-N (sec) bending.), 1242-1010(C-H in plane bending, phenyl ring), 767.69 (C-H str. 5-adjecent c atoms), 767.69(C-Cl str.); 1H NMR (DMSO-d6) δ(ppm): 2.400 (3H, singlet, -CH3), 1.785-2.750 (4H, multiplet, C-H), 6.068 (1H, singlet, C-H), 7.216-7.704 (8H, multiplet C-H), 10.139 (1H, singlet, -NH); MS: (m/z) = 404; Elemental analysis: %C = 65.29 (65.34), %H = 4.21 (4.20), %N = 13.88 (13.86), %S = 7.92 (7.92).
KC-2:
IR (cm-1, KBr): 3284.83 (-NH (sec.) str.), 3064.99 (Ar-H str.), 2908.75(-CH2 sym. str.), 2225.93 (-CN str.), 1666.55(C=C str. α,β unsaturated 6-member ring), 1604.83(-NH bending vib. Secondary amine), 1383.01 (-CH bending.), 1336.71(C-N (sec) bending.), 1242-1010 (C-H in plane bending, phenyl ring), 767.69 (C-H str. 5-adjecent c atoms), 731.05(C-H in plane bending); 1H NMR (DMSO-d6) δ(ppm): 2.443 (3H, singlet,-CH3), 3.696 (3H, singlet-OCH3), 1.798-2.757(4H, multiplet, C-H), 5.937 (1H, singlet, C-H), 6.896-7.691 (8H, multiplet C-H), 10.009 (1H, singlet, -NH); MS: (m/z) = 400; Elemental analysis: %C = 68.92 (69.00), %H = 5.06 (5.00), %N = 13.97 (14.00), %S = 8.03 (8.00),%O = 4.02 (4.00).
KC-3:
IR (cm-1, KBr): 3479.70 (-NH (sec.) str.), 3037.99 (Ar-H str.), 2918.40(-CH2 sym. str.), 2227.86 (-CN str.), 1666.55 (C=C str. α,β unsaturated 6-member ring), 1599.04 (-NH bending vib. Secondary amine), 1381.08 (-CH bending.), 1319.08 (C-N (sec) bending.), 1242-1010(C-H in plane bending, phenyl ring), 1093.67 (C-F str.), 725.26 (C-H str. 5-adjecent C atoms); 1H NMR (DMSO-d6) δ(ppm): 2.419 (3H, singlet, -CH3), 1.791-2.767 (4H, multiplet, C-H), 5.987 (1H, singlet, C-H), 7.148-7.684 (8H, multiplet C-H), 10.251 (1H, singlet, -NH); MS: (m/z) = 388; Elemental analysis: %C = 68.07 (68.04), %H = 4.42 (4.38), %N = 14.41 (14.43), %S = 8.25 (8.24).
KC-4:
IR (cm-1, KBr): 3257.88 (-NH (sec.) str.), 3047.63 (Ar-H str.), 2929.97 (-CH2 sym. str.), 2227.86 (-CN str.), 1653.05 (C=C str. α,β unsaturated 6-member ring), 1604.83 (-NH bending vib. Secondary amine), 1383.01 (-CH bending.), 1315.50 (C-N (sec) bending.), 1242-1010 (C-H in plane bending, phenyl ring), 723.33 (C-H str. 5-adjecent c atoms), 582.52 (C-Br str.); 1H NMR (DMSO-d6) δ(ppm): 2.422 (3H, singlet, -CH3), 1.799-2.787 (4H, multiplet, C-H), 5.993 (1H, singlet, C-H), 7.210-7.815 (8H, multiplet C-H), 10.247 (1H, singlet, -NH); MS: (m/z) = 448; Elemental analysis: %C = 58.87 (58.93), %H = 3.79 (3.80), %N = 12.45 (12.50), %S = 7.07 (7.14).
KC-5:
IR (cm-1, KBr): 3236.66 (-NH (sec.) str.), 3007.12 (Ar-H str.), 2929.97 (-CH2 sym. str.), 2224.40 (-CN str.), 1666.55(C=C str. α,β unsaturated 6-member ring), 1604.83(-NH bending vib. Secondary amine), 1383.09 (-CH bending.), 1334.78 (C-N (sec) bending.), 1242-1010 (C-H in plane bending, phenyl ring), 702.11 (C-H str. 5-adjecent c atoms), 731.05(C-H in plane bending); 1H NMR (DMSO-d6) δ(ppm): 2.451 (3H, singlet,-CH3), 3.708 (3H, singlet-OCH3), 4.023 (3H, singlet –OCH3), 1.798-2.757(4H, multiplet, C-H), 5.981 (1H, singlet, C-H), 7.002-7.758 (8H, multiplet C-H), 10.087 (1H, singlet, -NH); MS: (m/z) = 430; Elemental analysis: %C = 66.91 (66.97), %H = 5.21 (5.12), %N = 13.08 (13.02), %S = 7.49 (7.44), %O = 7.31 (7.44).
IR spectra:
The IR spectrum of KC-2 is depicted in Fig.2. The IR data shows a –NH (secondary) stretching and bending band at 3475.85 and 1604.83 cm-1 respectively. The band at 3049.56 confirms the presence of aromatic C-H stretching. C-N stretching and bending bands are at 2227.86 and 1315.50 respectively.
1H-NMR spectra:
The 1H NMR spectra of compound KC-2 is shown in Figure 3. Residual peak of DMSO is shown as a singlet at 3.327 dppm. The peak of S-CH3 is shown around 2.396 dppm. Protons of cyclo hexane ring are shown in aliphatic region at the range 1.798-2.757 dppm. Protons of –OCH3 are near about 3.696 dppm as singlet. Chiral proton is clearly shown at 5.937 dppm which is proof of ring cyclization. Aromatic protons of two phenyl rings are shown in the aromatic range between 6.896-7.691 dppm with their appropriate multiplicity. Double doublet is present at the range of 7.179-7.210 which is confirmation of attachment of –OCH3 group at para position. One proton is at 10.009 dppm as singlet, which gives confirmation of pyrazole ring. Due to attachment of one proton with nitrogen, this is shown at highly deshielded region.
13C-NMR spectra:
The 13C NMR spectra of compound KC-2 is shown in Figure 4. The peak of S-CH3 is shown around 13.74 dppm. Carbons of cyclo hexane ring are shown at aliphatic range at 23.98 dppm and 27.16 dppm. Carbon of –OCH3 is near about 39.49 dppm. Aromatic carbons are shown with their appropriate multiplicity at their appropriate dppm.
Density, viscosity and ultrasonic velocity study:
The experimental values of density (ρ), viscosity (η) and ultrasonic velocity (U) of pure DMF are given in Table 2 along with the literature values. There is fairly good agreement between experimental and literature values. Table 3 shows experimental data of density, ultrasonic velocity and viscosity for solutions of all the synthesized compounds in DMF at different temperatures. It is evident from the Table 3 that as concentration increases, density, ultrasonic velocity and viscosity increases.
Table 2. Density, Viscosity and Ultrasonic velocity of pure DMF.
| Solvent | Temp.K | ρ Kg/m3 | η mPs | U m/s | |||
| This work | Ref. | This work | Ref. | This work | Ref. | ||
| DMF | 298.15 | 943.94 | 943.90[28] | 0.8158 | 0.8040[42] | 1457.71 | 1457.49[41] |
| 943.94[41] | |||||||
| 308.15 | 934.38 | 934.60[43] | 0.7011 | 0.7103[41] | 1418.80 | 1418.95[41] | |
| 934.64[41] | |||||||
| 318.15 | 924.77 | 925.80[43] | 0.6337 | 0.6348[41] | 1380.15 | 1379.60[44] | |
Table 3. Density (ρ), ultrasonic velocity (U) and viscosity (η) of pyrazolo quinazoline derivatives in DMF at different temperatures.
| Concentration (M) | Density a Kg/m3 | Velocity b m/s | Viscosity c mPs | Density a Kg/m3 | Velocity b m/s | Viscosity c mPs |
| 298.15 K | ||||||
| KC-1 | KC-2 | |||||
| 0.00 | 943.94 | 1457.71 | 0.8158 | 943.94 | 1457.71 | 0.8158 |
| 0.01 | 946.15 | 1462.21 | 0.8190 | 945.56 | 1462.97 | 0.8190 |
| 0.02 | 947.87 | 1465.53 | 0.8334 | 946.70 | 1465.53 | 0.8336 |
| 0.04 | 949.71 | 1469.90 | 0.8597 | 949.81 | 1467.63 | 0.8547 |
| 0.06 | 952.61 | 1472.70 | 0.8869 | 951.93 | 1469.77 | 0.8796 |
| 0.08 | 955.35 | 1475.23 | 0.9082 | 954.30 | 1471.74 | 0.9021 |
| 0.10 | 957.58 | 1478.09 | 0.9222 | 957.08 | 1474.14 | 0.9248 |
| KC-3 | KC-4 | |||||
| 0.00 | 943.940 | 1457.71 | 0.8158 | 943.940 | 1457.71 | 0.8158 |
| 0.01 | 945.488 | 1461.89 | 0.8400 | 945.924 | 1463.15 | 0.8317 |
| 0.02 | 947.216 | 1463.12 | 0.8566 | 947.785 | 1467.69 | 0.8592 |
| 0.04 | 949.652 | 1464.97 | 0.8742 | 950.681 | 1471.72 | 0.8869 |
| 0.06 | 951.736 | 1466.31 | 0.8876 | 953.780 | 1474.48 | 0.9064 |
| 0.08 | 953.825 | 1468.12 | 0.9101 | 956.939 | 1477.37 | 0.9380 |
| 0.10 | 955.622 | 1470.14 | 0.9313 | 959.979 | 1479.62 | 0.9541 |
| KC-5 | ||||||
| 0.00 | 943.940 | 1457.71 | 0.8158 | |||
| 0.01 | 944.235 | 1462.98 | 0.8113 | |||
| 0.02 | 945.872 | 1465.48 | 0.8226 | |||
| 0.04 | 948.000 | 1468.75 | 0.8419 | |||
| 0.06 | 950.205 | 1471.42 | 0.8605 | |||
| 0.08 | 952.200 | 1473.73 | 0.8810 | |||
| 0.10 | 955.380 | 1476.26 | 0.9101 | |||
| 308.15 K | ||||||
| KC-1 | KC-2 | |||||
| 0.00 | 934.38 | 1418.80 | 0.7011 | 934.38 | 1418.80 | 0.7011 |
| 0.01 | 935.60 | 1424.82 | 0.7256 | 936.01 | 1425.04 | 0.7268 |
| 0.02 | 937.32 | 1427.99 | 0.7402 | 938.16 | 1427.54 | 0.7442 |
| 0.04 | 940.17 | 1431.89 | 0.7647 | 940.27 | 1429.49 | 0.7600 |
| 0.06 | 943.08 | 1434.14 | 0.7889 | 942.41 | 1431.87 | 0.7866 |
| 0.08 | 945.83 | 1437.74 | 0.8063 | 944.79 | 1433.69 | 0.8005 |
| 0.10 | 947.06 | 1441.75 | 0.8249 | 946.58 | 1436.21 | 0.8265 |
| KC-3 | KC-4 | |||||
| 0.00 | 934.38 | 1418.80 | 0.7011 | 934.38 | 1418.80 | 0.7011 |
| 0.01 | 935.78 | 1424.17 | 0.7350 | 936.06 | 1424.92 | 0.7336 |
| 0.02 | 937.67 | 1425.47 | 0.7481 | 937.93 | 1429.75 | 0.7564 |
| 0.04 | 939.11 | 1427.17 | 0.7644 | 940.82 | 1433.88 | 0.7808 |
| 0.06 | 941.21 | 1429.05 | 0.7839 | 943.93 | 1436.68 | 0.8066 |
| 0.08 | 943.30 | 1430.81 | 0.8047 | 947.09 | 1439.60 | 0.8312 |
| 0.10 | 945.11 | 1433.19 | 0.8224 | 950.13 | 1441.97 | 0.8544 |
| KC-5 | ||||||
| 0.00 | 934.38 | 1418.80 | 0.7011 | |||
| 0.01 | 935.54 | 1424.41 | 0.7233 | |||
| 0.02 | 936.33 | 1427.06 | 0.7389 | |||
| 0.04 | 938.46 | 1430.91 | 0.7572 | |||
| 0.06 | 941.08 | 1433.29 | 0.7692 | |||
| 0.08 | 943.18 | 1435.76 | 0.7896 | |||
| 0.10 | 946.57 | 1438.35 | 0.8046 | |||
| 318.15 K | ||||||
| KC-1 | KC-2 | |||||
| 0.00 | 924.77 | 1380.15 | 0.6337 | 924.77 | 1380.15 | 0.6337 |
| 0.01 | 926.00 | 1386.91 | 0.6434 | 927.41 | 1386.91 | 0.6402 |
| 0.02 | 927.72 | 1389.89 | 0.6600 | 928.57 | 1389.74 | 0.6564 |
| 0.04 | 930.57 | 1393.96 | 0.6791 | 930.69 | 1391.89 | 0.6710 |
| 0.06 | 933.49 | 1396.77 | 0.6977 | 932.84 | 1394.12 | 0.6889 |
| 0.08 | 936.25 | 1399.86 | 0.7130 | 935.24 | 1396.25 | 0.7083 |
| 0.10 | 938.50 | 1402.85 | 0.7332 | 937.04 | 1398.96 | 0.7202 |
| KC-3 | KC-4 | |||||
| 0.00 | 924.77 | 1380.15 | 0.6337 | 924.77 | 1380.15 | 0.6337 |
| 0.01 | 927.02 | 1385.75 | 0.6509 | 927.54 | 1386.68 | 0.6523 |
| 0.02 | 928.07 | 1386.98 | 0.6644 | 929.35 | 1390.95 | 0.6709 |
| 0.04 | 930.52 | 1388.61 | 0.6790 | 933.23 | 1395.44 | 0.6902 |
| 0.06 | 932.63 | 1390.47 | 0.6987 | 935.61 | 1397.86 | 0.7146 |
| 0.08 | 934.73 | 1392.69 | 0.7181 | 938.91 | 1400.77 | 0.7332 |
| 0.10 | 936.54 | 1394.74 | 0.7380 | 941.26 | 1403.85 | 0.7565 |
| KC-5 | ||||||
| 0.00 | 924.77 | 1380.15 | 0.6337 | |||
| 0.01 | 925.32 | 1386.24 | 0.6437 | |||
| 0.02 | 927.73 | 1389.77 | 0.6572 | |||
| 0.04 | 929.88 | 1393.14 | 0.6746 | |||
| 0.06 | 932.10 | 1395.86 | 0.6896 | |||
| 0.08 | 934.12 | 1398.75 | 0.7093 | |||
| 0.10 | 937.28 | 1400.99 | 0.7209 | |||
a: Uncertainty of Density is ±0.000005 g/cm3
b: Uncertainty of Sound velocity is ±0.5 m/s
c: Uncertainty of digital stopwatch for Viscosity is ±0.01 s
To study molecular interactions of compounds in solutions, some acoustical and apparent parameters such as adiabatic compressibility (κs), intermolecular free length (Lf), internal pressure (π), free volume (Vf), solvation number (Sn), apparent molar compressibility (fk) and apparent molar volume (fv) were evaluated using experimental data of ultrasonic velocity (U), density (ρ) and viscosity (η) by following equations:
Adiabatic compressibility [31]: ks = 1/U2r (1)
Intermolecular free path length: ![]() (2)
(2)
where Kj is a temperature-dependent Jacobson’s constant (93.875 + 0.375T) × 10-8.
Internal pressure [32] (p):![]() (3)
(3)
Free volume [33]:
 (4)
(4)
Solvation number: ![]() (5)
(5)
where X is the number of grams of solute in 100 gm of the solution. M1 and M2 are the molecular weights and kS1 and kS are adiabatic compressibility of pure solvent and solute respectively.
Apparent molar compressibility: fk = 1000/mro (roks -rko) + (ko m /ro) (6)
where ks, r and k0, r0 are represents the adiabatic compressibility and density of solution and solvent respectively, m is the molar concentration of solute.
Apparent molar volume: fv = (M/r)-[1000(r-ro)/mrro] (7)
Some of these thermodynamic parameters are given in Table 4.
Table 4. Some acoustical parameters in DMF solutions of pyrazolo quinazoline derivatives at different temperatures.
| Conc. (M) | Lf×10-11 m | κs×10-5 m2.N-1 | π ×1010 N/m2 | Vf×10-12 m3 | Sn | Lf×10-11 m | κs×10-5m2.N-1 | π ×1010 N/m2 | Vf×10-12 m3 | Sn |
| 298.15 K | ||||||||||
| KC-1 | KC-2 | |||||||||
| 0.00 | 4.5925 | 4.9856 | 1.5623 | 2.8942 | - | 4.5925 | 4.9856 | 1.5623 | 2.8942 | - |
| 0.01 | 4.5730 | 4.9433 | 1.5307 | 3.0095 | 2.7987 | 4.5721 | 4.9413 | 1.5305 | 3.0105 | 2.6182 |
| 0.02 | 4.5585 | 4.9121 | 1.5109 | 3.1882 | 3.2236 | 4.5613 | 4.9181 | 1.5112 | 3.1856 | 3.4467 |
| 0.04 | 4.5406 | 4.8734 | 1.4706 | 3.5436 | 4.2543 | 4.5474 | 4.8880 | 1.4702 | 3.4961 | 4.7929 |
| 0.06 | 4.5250 | 4.8401 | 1.4357 | 3.9230 | 4.9468 | 4.5357 | 4.8629 | 1.4342 | 3.8505 | 5.7537 |
| 0.08 | 4.5108 | 4.8097 | 1.3987 | 4.2860 | 5.4866 | 4.5240 | 4.8379 | 1.3991 | 4.2099 | 6.4097 |
| 0.10 | 4.4968 | 4.7800 | 1.3581 | 4.6163 | 5.9045 | 4.5101 | 4.8081 | 1.3668 | 4.5933 | 6.7073 |
| KC-3 | KC-4 | |||||||||
| 0.00 | 4.5925 | 4.9856 | 1.5623 | 2.8942 | - | 4.5925 | 4.9856 | 1.5623 | 2.8942 | - |
| 0.01 | 4.5756 | 4.9490 | 1.5526 | 3.1177 | 2.9808 | 4.5706 | 4.9382 | 1.5331 | 3.1054 | 3.0690 |
| 0.02 | 4.5676 | 4.9316 | 1.5380 | 3.2983 | 4.0546 | 4.5520 | 4.8980 | 1.5160 | 3.3928 | 3.3322 |
| 0.04 | 4.5560 | 4.9066 | 1.4960 | 3.5816 | 5.5672 | 4.5326 | 4.8564 | 1.4626 | 3.8220 | 4.5458 |
| 0.06 | 4.5469 | 4.8869 | 1.4534 | 3.8507 | 6.7255 | 4.5168 | 4.8225 | 1.4084 | 4.2223 | 5.4357 |
| 0.08 | 4.5363 | 4.8642 | 1.4207 | 4.1965 | 7.3338 | 4.5005 | 4.7878 | 1.3680 | 4.7386 | 6.0131 |
| 0.10 | 4.5258 | 4.8417 | 1.3884 | 4.5529 | 7.7852 | 4.4866 | 4.7581 | 1.3203 | 5.1648 | 6.5782 |
| KC-5 | ||||||||||
| 0.00 | 4.5925 | 4.9856 | 1.5623 | 2.8942 | - | |||||
| 0.01 | 4.5753 | 4.9482 | 1.5160 | 2.9825 | 3.5878 | |||||
| 0.02 | 4.5635 | 4.9228 | 1.4893 | 3.1527 | 4.2853 | |||||
| 0.04 | 4.5482 | 4.8899 | 1.4361 | 3.4854 | 5.6636 | |||||
| 0.06 | 4.5347 | 4.8608 | 1.3872 | 3.8322 | 6.5629 | |||||
| 0.08 | 4.5229 | 4.8354 | 1.3436 | 4.2130 | 7.3234 | |||||
| 0.10 | 4.5076 | 4.8028 | 1.3109 | 4.6818 | 7.5657 | |||||
| 308.15 K | ||||||||||
| KC-1 | KC-2 | |||||||||
| 0.00 | 4.7426 | 5.3166 | 1.5070 | 2.2141 | - | 4.7426 | 5.3166 | 1.5070 | 2.2141 | - |
| 0.01 | 4.7194 | 5.2649 | 1.4970 | 2.4152 | 2.4654 | 4.7177 | 5.2610 | 1.4993 | 2.4200 | 2.2452 |
| 0.02 | 4.7046 | 5.2319 | 1.4791 | 2.5684 | 3.0180 | 4.7040 | 5.2305 | 1.4857 | 2.5850 | 2.9072 |
| 0.04 | 4.6847 | 5.1877 | 1.4414 | 2.8614 | 3.9875 | 4.6923 | 5.2046 | 1.4409 | 2.8211 | 4.4961 |
| 0.06 | 4.6701 | 5.1555 | 1.4070 | 3.1678 | 4.8118 | 4.6792 | 5.1755 | 1.4091 | 3.1363 | 5.3896 |
| 0.08 | 4.6517 | 5.1148 | 1.3684 | 3.4559 | 5.1513 | 4.6674 | 5.1494 | 1.3689 | 3.3906 | 6.0992 |
| 0.10 | 4.6357 | 5.0798 | 1.3316 | 3.7723 | 5.5290 | 4.6548 | 5.1216 | 1.3404 | 3.7418 | 6.5837 |
| KC-3 | KC-4 | |||||||||
| 0.00 | 4.7426 | 5.3166 | 1.5070 | 2.2141 | - | 4.7426 | 5.3166 | 1.5070 | 2.2141 | - |
| 0.01 | 4.7211 | 5.2687 | 1.5101 | 2.4545 | 2.4535 | 4.7179 | 5.2616 | 1.4970 | 2.4733 | 2.8466 |
| 0.02 | 4.7121 | 5.2485 | 1.4943 | 2.5900 | 3.4575 | 4.6973 | 5.2157 | 1.4784 | 2.6967 | 3.1138 |
| 0.04 | 4.7029 | 5.2280 | 1.4528 | 2.8194 | 5.3506 | 4.6766 | 5.1697 | 1.4254 | 3.0404 | 4.3077 |
| 0.06 | 4.6914 | 5.2026 | 1.4177 | 3.0803 | 6.2788 | 4.6598 | 5.1326 | 1.3794 | 3.4157 | 5.1921 |
| 0.08 | 4.6804 | 5.1783 | 1.3860 | 3.3635 | 6.9419 | 4.6426 | 5.0948 | 1.3364 | 3.8116 | 5.7784 |
| 0.10 | 4.6682 | 5.1512 | 1.3531 | 3.6457 | 7.3062 | 4.6275 | 5.0618 | 1.2960 | 4.2234 | 6.3293 |
| KC-5 | ||||||||||
| 0.00 | 4.7426 | 5.3166 | 1.5070 | 2.2141 | - | |||||
| 0.01 | 4.7209 | 5.2683 | 1.4898 | 2.4130 | 2.9876 | |||||
| 0.02 | 4.7102 | 5.2443 | 1.4676 | 2.5805 | 4.0106 | |||||
| 0.04 | 4.6922 | 5.2043 | 1.4151 | 2.8619 | 5.1975 | |||||
| 0.06 | 4.6779 | 5.1726 | 1.3628 | 3.1188 | 6.1209 | |||||
| 0.08 | 4.6646 | 5.1433 | 1.3213 | 3.4442 | 6.8312 | |||||
| 0.10 | 4.6479 | 5.1064 | 1.2802 | 3.7524 | 7.0819 | |||||
| 318.15 K | ||||||||||
| KC-1 | KC-2 | |||||||||
| 0.00 | 4.9006 | 5.6769 | 1.4895 | 1.8254 | - | 4.9006 | 5.6769 | 1.4895 | 1.8254 | - |
| 0.01 | 4.8735 | 5.6143 | 1.4647 | 1.9372 | 2.1959 | 4.8698 | 5.6057 | 1.4633 | 1.9215 | 1.8908 |
| 0.02 | 4.8585 | 5.5799 | 1.4510 | 2.0779 | 2.8406 | 4.8568 | 5.5759 | 1.4495 | 2.0580 | 2.6738 |
| 0.04 | 4.8369 | 5.5303 | 1.4104 | 2.3023 | 3.7832 | 4.8438 | 5.5461 | 1.4058 | 2.2511 | 4.1541 |
| 0.06 | 4.8197 | 5.4909 | 1.3732 | 2.5366 | 4.4971 | 4.8305 | 5.5156 | 1.3686 | 2.4730 | 5.0866 |
| 0.08 | 4.8019 | 5.4506 | 1.3352 | 2.7667 | 4.9565 | 4.8169 | 5.4847 | 1.3359 | 2.7172 | 5.7264 |
| 0.10 | 4.7859 | 5.4143 | 1.3038 | 3.0405 | 5.3759 | 4.8030 | 5.4529 | 1.2976 | 2.9330 | 6.1857 |
| KC-3 | KC-4 | |||||||||
| 0.00 | 4.9006 | 5.6769 | 1.4895 | 1.8254 | - | 4.9006 | 5.6769 | 1.4895 | 1.8254 | - |
| 0.01 | 4.8749 | 5.6175 | 1.4802 | 1.9731 | 2.1316 | 4.8703 | 5.6068 | 1.4681 | 1.9917 | 2.4082 |
| 0.02 | 4.8678 | 5.6012 | 1.4676 | 2.1004 | 3.3549 | 4.8506 | 5.5616 | 1.4477 | 2.1626 | 2.9370 |
| 0.04 | 4.8557 | 5.5733 | 1.4281 | 2.2897 | 4.9347 | 4.8249 | 5.5029 | 1.3939 | 2.4285 | 3.9147 |
| 0.06 | 4.8437 | 5.5459 | 1.4000 | 2.5400 | 5.8869 | 4.8104 | 5.4699 | 1.3492 | 2.7382 | 4.9712 |
| 0.08 | 4.8306 | 5.5158 | 1.3641 | 2.7519 | 6.4241 | 4.7920 | 5.4280 | 1.3040 | 3.0376 | 5.5484 |
| 0.10 | 4.8188 | 5.4889 | 1.3284 | 2.9623 | 6.9286 | 4.7755 | 5.3907 | 1.2654 | 3.3896 | 6.0766 |
| KC-5 | ||||||||||
| 0.00 | 4.9006 | 5.6769 | 1.4895 | 1.8254 | - | |||||
| 0.01 | 4.8776 | 5.6238 | 1.4598 | 1.9456 | 2.9357 | |||||
| 0.02 | 4.8589 | 5.5807 | 1.4385 | 2.0815 | 3.2496 | |||||
| 0.04 | 4.8416 | 5.5409 | 1.3879 | 2.3150 | 4.6292 | |||||
| 0.06 | 4.8264 | 5.5062 | 1.3396 | 2.5491 | 5.5695 | |||||
| 0.08 | 4.8112 | 5.4716 | 1.2993 | 2.8260 | 6.2206 | |||||
| 0.10 | 4.7954 | 5.4358 | 1.2567 | 3.0674 | 6.6592 | |||||
Conc. = Concentration
The variation of ultrasonic velocity and intermolecular free length (Lf) with concentration are shown in Figures 5 and 6 respectively at 298.15 K.
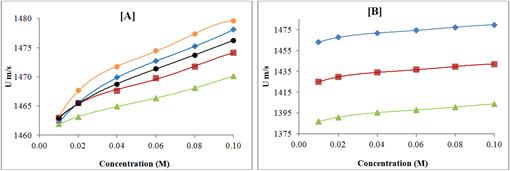
Figure 5. Variation of ultrasonic velocity with concentration of pyrazolo quinazoline derivatives in DMF at 298.15 K; [A] KC-1, (♦); KC-2, (■); KC-3, (▲); KC-4, (●); KC-5, (●); and Ultrasonic velocity of KC-4 at different temperatures; [B] 298.15 K, (♦); 308.15 K, (■); 318.15 K, (▲);
It is clear from these figures that ultrasonic velocity increases with increase in concentration for all the compounds whereas intermolecular free length (Lf) decreases with increase in concentration. Thus, ultrasonic velocity is reverse of intermolecular free length (Lf). The decrease of intermolecular free length (Lf) with increase of concentration suggests that the distance between solute and solvent molecules decrease due to increase in solute-solvent interactions, which causes velocity to increase.
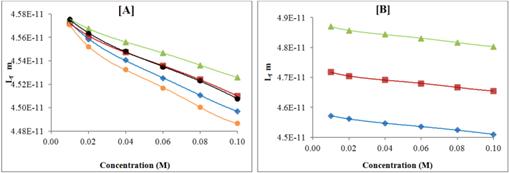
Figure 6. Variation of free path length (Lf) with concentration of pyrazolo quinazoline derivatives in DMF at 298.15 K; [A] KC-1, (♦); KC-2, (■); KC-3, (▲); KC-4, (●); KC-5, (●);and free path length (Lf) of KC-2 at different temperatures; [B] 298.15 K, (♦); 308.15 K, (■); 318.15 K, (▲);
Further, as temperature increases, ultrasonic velocity (U) decreases whereas intermolecular free length (Lf) increases as shown in Tables 3 and 4 respectively. Thus, temperature plays an important role in molecular interactions in solutions. Further, viscosity of solutions of all the compounds also decreases with increase in temperature as expected.
Figure 7 shows the variation of adiabatic compressibility (ks) with concentration. It is clear from Figure 7 that adiabatic compressibility (ks) decreases with increase in concentration.
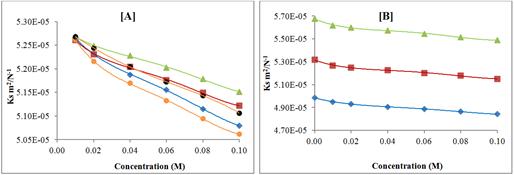
Figure 7. Variation of adiabatic compressibility (κs) with concentration of pyrazolo quinazoline derivatives in DMF at 308.15 K; [A] KC-1, (♦); KC-2, (■); KC-3, (▲); KC-4, (●); KC-5, (●); and Variation of adiabatic compressibility (κs) of KC-3 at different temperatures; [B] 298.15 K, (♦); 308.15 K, (■); 318.15 K, (▲);
The decrease in adiabatic compressibility again proves that there is strong interaction between solvent and solute molecules. By increase in concentration of solute, molecular associations are enhanced and newly formed aggregates cause adiabatic compressibility to decrease. The increase in temperature causes decrease in adiabatic compressibility (ks).
Further, it is observed from Figures 5, 6 and 7 that for all the five synthesized compounds, order is same i.e., ultrasonic velocity is maximum for KC-4 and minimum for KC-3, indicating thereby maximum molecular interactions for KC-4 and minimum for KC-3. The type and magnitude of interaction depends upon structure of compound as well as solvent. In the present study, solvent is same for all the compounds so different structure is responsible for magnitude of molecular interactions. For all the compounds, central moiety is same but side chains are different. Table 1 shows that compound containing p-bromo group (KC-4) exhibited maximum molecular interaction in DMF whereas minimum molecular interaction is observed for KC-3 containing p-fluoro group. This suggests that electro negativity of groups play an important role in DMF solution of studied compounds. Lower the electro negativity, maximum is the molecular interaction.
The type of interactions between solute and solvent molecules can also be suggested by a parameter solvation number (Sn), which is the number of solvent molecules attached to the solute molecule. It gives the information about structure forming tendency or structure breaking tendency of a compound in solutions. Depending upon structure of compound, the solvation number is either positive or negative. Figure 8 shows solvation number of compounds at different temperatures.
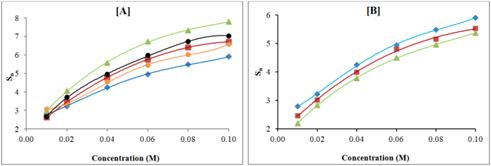
Figure 8. Variation of solvation number (Sn) with molar concentration pyrazolo quinazoline derivatives in DMF at 298.15 K; [A] KC-1, (♦); KC-2, (■); KC-3, (▲); KC-4, (●); KC-5, (●); and Variation of solvation number (Sn) of KC-1 at different temperatures; [B] 298.15 K, (♦); 308.15 K, (■); 318.15 K, (▲);
Table 5. Coefficients of equations (8), (9) and (10) for DMF solutions of pyrazolo quinazoline derivatives at different temperatures.
| Coefficient | KC-1 | KC-2 | KC-3 | KC-4 | KC-5 |
| 298.15 K | |||||
| A | -3.8 | -2.85 | -2.45 | -4.3 | -2.9 |
| B | 4.67 | 3.85 | 2.86 | 6.33 | 3.57 |
| f°k x 10-2 N-1mol-1 | -6.95 | -7.2 | -6.0 | -7.36 | -4.56 |
| Sk x 10-13 m3.mol-1 | 15.71 | 20.7 | 15.35 | 15.71 | 9.07 |
| f°v N-1m3mol-1 | -156.5 | -191.0 | -184.0 | -186.0 | -118.0 |
| Sv x 108N-1m-3/2.mol-3/2 | 25.00 | 200.0 | 192.85 | 57.14 | 25.0 |
| 308.15 K | |||||
| A | -4.90 | -3.65 | -2.75 | -4.95 | -3.5 |
| B | 7.72 | 5.71 | 3.57 | 7.25 | 4.28 |
| f°k x 10-2 N-1mol-1 | -7.80 | -9.35 | -7.95 | -8.85 | -5.53 |
| Sk x 10-13 m3.mol-1 | 16.00 | 28.3 | 26.8 | 20.8 | 11.2 |
| f°v N-1m3mol-1 | -160.0 | -220.0 | -224.0 | -229.0 | -130.5 |
| Sv x 108N-1m-3/2.mol-3/2 | 33.78 | 293.33 | 358.82 | 292.66 | 48.00 |
| 318.15 K | |||||
| A | -5.75 | -4.20 | -3.20 | -5.75 | -4.55 |
| B | 10.38 | 6.42 | 4.28 | 8.33 | 5.33 |
| f°k x 10-2 N-1mol-1 | -8.15 | -12.6 | -11.25 | -11.25 | -7.09 |
| Sk x 10-13 m3.mol-1 | 17.7 | 37.28 | 38.5 | 30.92 | 14.64 |
| f°v N-1m3mol-1 | -164.20 | -269.0 | -300.0 | -306.0 | -171.0 |
| Sv x 108N-1m-3/2.mol-3/2 | 39.64 | 432.94 | 557.14 | 417.64 | 152.5 |
It is observed that for the studied compounds, the solvation numbers are positive, indicating thereby appreciable solvation of compounds. Thus, in DMF, the studied compounds exhibited structure forming tendency due to solute-solvent interactions between solute and solvent molecules which causes an increase in solvation number. As solute concentration increases, solute-solvent interactions also increases which causes increase in aggregation of molecules i.e., structure forming tendency of solute. So, there is increment in solvation number with concentration [34]. Further, for all compounds, solvation number (Sn) decreases with increase in temperature. This is due to the fact with increase in temperature, due to molecular movements or disturbances, interactions become weak, so solvation number decreases.
The type and magnitude of interactions can also be confirmed by apparent molar properties. Apparent molar compressibility (fk) and apparent molar volume (fv) of solutions are fitted to Gucker’s [35] (equation 8) and Masson [36] relations (equation 9) respectively.
fk = f°k + Skm1/2 (8)
and
fv = f°v + Svm1/2 (9)
where f°k and f°v are the limiting apparent molar compressibility and limiting apparent molar volume at infinite dilutions. Sk and Sv are interaction parameters [37,38].
The values of f°k and Sk (of equation 8) and of f°v and Sv (of equation 9) are calculated by the least square method and are reported in Table 5.
The molecular interactions in solutions can also be suggested by Bachem’s relation [39], which is:
![]() (10)
(10)
where A and B are constants, C is molar concentration of solutions, and ![]() and
and ![]() are adiabatic compressibilities of the solution and solvent respectively. The constants A and B have been determined from the intercept and slope of the plots (κs -
are adiabatic compressibilities of the solution and solvent respectively. The constants A and B have been determined from the intercept and slope of the plots (κs -![]() )/C verses C1/2 and are given in Table 5.
)/C verses C1/2 and are given in Table 5.
As shown in Table 5, values of A, f0k and f°v values are negative whereas B, Sk and Sv values are positive for all the synthesized compounds at different temperatures. The negative f0k and f°v values confirm the existence of solute-solvent interactions in the studied solutions. In a solution, when solute causes electrostriction in a solution, it causes decrease in compressibility which is reflected by negative f0k values. The positive Sk and Sv values for all the compounds again indicate the structure forming tendency of compounds in DMF solutions. This is again supported by Bechem’s constants A and B (Table 5). The negative A and positive B for all the compounds confirms solute-solvent interactions in all the solutions of compounds [40].
5. Conclusion
In DMF solutions of the studied compounds, sound velocity increases with concentration whereas there is decrease in intermolecular free path length and adiabatic compressibility with concentration. The increase in sound velocity and decrease in intermolecular free path length and adiabatic compressibility suggests predominance of solute-solvent interactions in studied solutions. These interactions are found to decreases with temperature. The magnitude of interaction depends upon different side chains present in the studied compounds having the same central moiety. The compound KC-4 containing p-bromo group exhibited maximum molecular interaction whereas minimum molecular interaction is observed for KC-3 containing p-fluoro group. Thus, lower the electro negativity, maximum is the molecular interaction. The positive solvation suggests structure forming tendency of studied compounds in DMF solutions. This structure forming tendency of studied compounds is also confirmed by apparent molar properties. Further, with increase in temperature, structure forming tendency of studied compounds decreases in DMF solutions.
Nomenclature
| U | Ultrasonic velocity |
| r | Density |
|
| Viscosity |
|
| Adiabatic compressibility |
| X | Number of grams of solute in 100 gm of the solution |
| Lf | Intermolecular free length |
| fk | Apparent molar compressibility |
| fv | Apparent molar volume |
| f°k | Limiting apparent molar compressibility |
| f°v | Limiting apparent molar volume |
| Sk & Sv | Interaction parameters |
| Sn | Solvation number |
| A & B | Bachem’s constants |
Abbreviation
| DMF | N, N-dimethylformamide |
| AR | Analytical reagent |
| DMS | Dimethyl sulphate |
| IPA | Iso propyl alcohol |
| RT | Room temperature |
References
- K. R. A. Abdellatif, E. K. A. Abdelall, M. A. Abdelgawad, R. R. Ahmed, R. B. Bakr,, Molecules, 19 (2014) 3297-3309.
- M. A. Ali, M. Shaharyar, A. A. Siddiqui, Eur. J. Med. Chem., 42 (2007) 268-275.
- M. Garg, M. Chauhan, P. K. Singh, J. M. Alex, R. Kumar, Eur. J. Med. Chem., 97 (2015) 444-461.
- P. Kumar, N. Chandak, P. Kaushik, C. Sharma, D. Kaushik, K. R. Aneja, P. K. Sharma, Med. Chem. Res., 21 (2012) 3396-3405.
- A. A. Abu-Hashem, M. A. Gouda, F. A. Badria, Eur. J. Med. Chem., 45 (2010) 1976-1981.
- P. M. S. Bedi, V. Kumar, M. P. Mahajan, Bioorg. Med. Chem. Lett., 14 (2004) 5211-5213.
- A. M. Khalil, M. A. Berghot, M. A. Gouda, Eur. J. Med. Chem., 44 (2009) 4434-4440.
- I. Khan, A. Ibrar, W. Ahmed, A. Saeed, Eur. J. Med. Chem., 90 (2015) 124-169.
- D. Wang, F. Gao, Review article: Wang and Gao Chem. Central J., (2013) 7-95.
- R. Storer, C. J. Ashton, A. D. Baxter, M. M. Hann, C.L.P. Marr, A. M. Mason, C.-L. Mo, P. L. Myers, S.A. Noble, C. R. Penn, N.G. Weir, J.M. Woods, P.L. Coe, Nucleosides & Nucleotides, 18 (1999) 203–216.
- V. K. Pandey, L. P. Pathak, S. K. Mishra, Ind. J. Chem., 44 (2005) 1940-1944.
- N. V. Kavitha, K. Divekar, B. Priyadarshini, S. Gajanan, M. Manjunath, D. Pharm. Chem., 3(2011)55-62.
- M. G. Ferlin, B. Gatto, G. Chiarelotto, M. Palumbo, Bioorg. Med. Chem., 8 (2000) 1415-1422.
- A. Mahamoud, J. Chevalier, A. Davin-Regli, J. Barbe, J. M. Pages, Current Drug Targets, 7 (2006) 843-847.
- S. J. McNeil, R. A. McCall, Ultra. Sonochem. 18 (2011) 401-406.
- Z. J. Dolatowski, J. Stadnik, D. Stasiak, Acta Sci. Pol., Technol. Aliment. 6 (2007) 89-99.
- A. Abou-Okeil,A. El-Shafie,M. M. El Zawahry,Ultras. Sonochem.,17(2010) 383–390.
- C. Petrier,A. Francony,Water Sci. Techn., 35(1997) 175–180.
- M. Patil, V. Onuora,Injury, 25 (1994) 177-178.
- V. S. Prasad, E. Rajagopal, N. M. Murthy, J. Mol. Liq., 124 (2006) 1-6.
- S. C. Bhatia, R. Bhatia, G. P. Dubey,,Phys. Chem. Liqds, 48 (2010) 199-230.
- A. Ali, S. Hyder, A. K. Nain, J. Mol. Liqds., 79 (1999), 89-99.
- D. R. Andrews, San Diego (2001) 269-287.
- S. Chauhan, K. Kumar, B. S. Patil, Ind. J. Pure Appl. Phys., 51 (2013) 531-541.
- A. M. E. Raj, L. B. Resmi, V. B. Jothy, M. Jayachandran, C. Sanjeeviraja, Fluid Phase Equilib., 281 (2009) 78-86.
- S. Baluja, N. Vekariya and J. Movaliya, Iran. J. Chem. Chem. Eng., 27 (2008) 129-135.
- S. Baluja, R. Bhalodiya, R. Gajera, Int. J. Appl. Chem., 5 (2009) 47-55.
- S. Baluja, S. Oza, Fluid Phase Equilib., 4933 (2002) 1-8.
- S. Baluja, R. Bhalodiya, Russ. J. Phy. Chem. A, 87 (2013) 2176-2180.
- J.A. Riddick, W.B. Bunger, T. Sakano, New York, (1986).
- M. Hasan, A. P. Hiray, U. B. Kadam, D. F. Shirude, K. J. Kurhe, A. B. Sawant, J. Sol. Chem., 40 (2011) 415-429.
- C. V. Suryanarayana, J. Kuppuswamy, Role of internal pressure in the chemistry of electrolyte solutions, J. Acoust. Soc., 9 (1981) 4-8.
- S. Bagchi, S. K. Nema, R. P. Singn, Eur. Polym. J., 25 (1989) 441-444.
- R. Palani, K. Jayachitra,Ind.J. Pure Appl. Phys., 46 (2008) 251-254.
- F.T. Gucker, Chem. Rev.,13 (1933) 111-130.
- D.O. Masson,Magazine.8 (1929) 218-235.
- R. Gopal, M. A. Siddiqi, J. Phys. Chem., 73 (1969) 3390-3394.
- N. Saha, B. Das, D. K. Hazra, J. Chem. Eng. Data, 40 (1995) 1264-1266.
- C.H. Bachem, Z. Physik, 101 (1936) 541-577.
- P. S. Nikam, H. R. Ansari, M. Hasan, J. Pure Appl. Ultrason., 20 (1998) 75-78.
- D. Papamatthaiakis, F. Aroni, V. Havredaki, J. Chem. Thermodyn., 40 (2008) 107–118.
- A. Pal, A. Kumar, J. Chem. Eng. Data., 50 (2005) 856-862.
- V. K. Syal, B. S. Patial, S. Chauhan, Ind. J. Pure Appl. Phys., 37 (1999) 366-370.
- S. Baluja, A. Shah, Fluid Phase Equili., 215 (2004) 55-59.


