
International Journal of Materials Chemistry and Physics, Vol. 1, No. 2, October 2015 Publish Date: Aug. 12, 2015 Pages: 124-131
Assessing Pavement Surface Macrotexture Using Sand Patch Test and Close Range Photogrammetric Approaches
Saad Issa Sarsam*, Amal Mahdi Ali
Department of Civil Engineering, College of Engineering, University of Baghdad, Baghdad, Iraq
Abstract
Pavement surface texture determines the comfort riding quality and serviceability conditions for road users. Pavement macrotexture has great impact on drainage and skid attributes. The pavement surface texture should maintain low levels of noise and roughness. Many transportation departments perform routine check for skid resistant and texture, the type of equipment used for testing varies depending on the preference of each transportation department. The macrotexture of pavement surface is usually assessed using the traditional sand patch method or the automated lazier scanning of the surface. It was felt that there is a need to introduce the close range photogrammetry technique which is simple and can be conducted with lower price than lazier scanning, and it is lower labour consuming as compared to sand patch method. The aim of this work is to study the feasibility of using the close range photogrammetry in assessing the macrotexture condition of the pavement. The methods used in this work consisted of measurement the macrotexture of cement concrete and asphalt concrete pavement surface in the field using both techniques, the sand patch method and the close range photogrammetry technique. Visual inspection of pavement surface, was done by a walking along the pavement sections and selecting the spots for macrotexture assessment. Stereo images capture and sand patch test were conducted for each of the 28 selected spots on the pavement surface for the two types of pavement. The test results were verified, modelled and correlated to each other. It was concluded that such modelling could provide instant data in the field for pavement condition which may help in pavement maintenance management. Moreover, the photogrammetric technique could provide a permanent documentation of the pavement surface condition, which could be referred when needed.
Keywords
Macrotexture, Sand Patch, Close Range Photogrammetry, Modelling
Received: July 12, 2015
Accepted: August 3, 2015
Published online: August 12, 2015
@ 2015 The Authors. Published by American Institute of Science. This Open Access article is under the CC BY-NC license. http://creativecommons.org/licenses/by-nc/4.0/
Contents
1. Introduction 1.1. Measurement of Pavement Surface Texture 1.2. Sand Patch Method 1.3. Stereo Photogrammetric Techniques 1.4. Application of Visual Measurement 1.5. Application of Close Range Photogrammetry for Pavement Condition Survey 2. Materials and Methods 2.1. Total Station Device 2.2. Differential Global Positioning System (DGPS) 2.3. Digital Camera 2.4. Measurements of Ground Control Points 2.5. Manual Data Collection 3. Discussion of Test Results 3.1. Macrotexture of Asphalt Concrete Pavement 3.2. Macrotexture of Cement Concrete Pavement 4. Conclusions
1. Introduction
Deterioration of the pavement surface in terms of smoothing or polishing along with surface water accumulation in the form of rain, snow, or ice, can result in inadequate provision of skid resistance, which can lead to higher incidences of skid related crashes. There is currently no agreement on a standardized testing procedure for pavement macrotexture to adopt despite a significant amount of research conducted, [1,2,3,4]. In this sense, pavement surface characteristics are a significant issue because of its influence in preserving roadway safety. Maintaining these characteristics during pavement construction or rehabilitation may mitigate or even prevent crashes and incidents related to loss of vehicle control, hydroplaning, and/or excessive skidding, [5].
The pavement - tire interaction is affected by the texture characteristics of the pavement such as the coefficient of friction, skid resistance, and hydroplaning effect on wet surface.
1.1. Measurement of Pavement Surface Texture
Surface texture was measured by [6] from images and indicated texture classification by Power spectrum using Current One-Dimensional Texture indicator, Root Mean Square Roughness (RMSR) and Mean Profile Depth (MPD). Moreover, [7] Developed a method for estimating the macro-texture in terms of the Mean Profile Depth determined from the aggregate gradation and binder content, Macro-texture of asphalt concrete pavement surface was investigated by [8,9,10] in the field using four different methods (the sand patch method, out flow time method, sand cone method and British portable tester).
1.2. Sand Patch Method
The mean texture depth (MTD) is determined using the traditional method-based test method (ASTM E 965) [11], also referred to as the Sand Patch Test. This method is suitable for field tests to determine the average macrotexture depth of asphalt concrete and Portland cement concrete pavement surface. The sand patch test kit includes brush for cleaning the pavement surface of selected area, a sample cup for portioning the volume of test material (silica sand), a spreading tool, and a scale tape. Commonly used volumes for each sand patch test is100 gram (pass sieve no.30 and retained on sieve no.50). The portioned material is placed on the test area and spread into a circular patch with the spreading tool. As shown in Fig.1. Before making the actual volume measurements at field, sand was calibrated to determine its density.
The diameter of the resulting circular patch is measured on four axes and the values are averaged. This value is used to calculate the mean texture depth (MTD).The Mathematical equation (1) is implemented for MTD calculation, [11].
MTD = 4 V / 3.14 D2 (1)
Where:
MTD = Texture depth (mm).
D = average diameter of sand patch circle (cm2).
V = volume of sand used (cm3), (Weight of Sand/ Density of Sand).
1.3. Stereo Photogrammetric Techniques
A major part of the photogrammetric community’s effort has, for a long time, been the recovery of the three-dimensional description of the object space by stereoscopy. Stereo vision is a natural phenomenon that makes the overlapping area of two images, acquired from two different viewpoints by the same sensor; appear as one three dimensional scene if each photograph is viewed with one eye separately. Therefore, the missing depth information can be recovered. As shown in Fig.2, stereo imaging involves obtaining two view of the object of interest. The distance between the centres of the two camera lens locations is called the base line (in the close range). If an object point P appears in the scene, the objective is to find the object space coordinates (X, Y,Z) of the point, given its image point coordinates (xL, yL) on the left photograph and (xR, yR) on the right photograph, in addition to the camera parameters, [12]. Image-collection technology is seemingly the most popular approach. Most systems record pavement surface images using a video camera or photographic camera mounted on a survey vehicle [13]. [14] Stated that stereo photogrammetry is the most flexible and potentially accurate method for close range applications and produce ability to record three-dimensional features (stereo models).
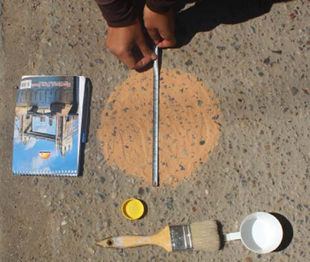
Fig. 1. The sand patch method.
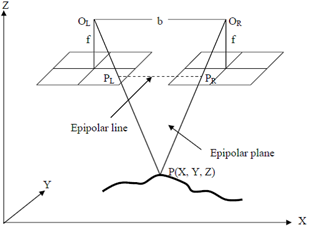
Fig. 2. Stereo imaging geometry [12].
1.4. Application of Visual Measurement
A study by [15] compares the results of two measurement methods for pavement surface macrotexture: the sand patch volumetric method and the Digital Surface Roughness Meter (DSRM, laser technique) conducted at a total of 13 different paved road sites. A coefficient of determination (R2 = 0.95) was determined between DSRM and sand patch MTD measurements. The macrotexture and microtexture depth of asphalt concrete pavement surface and cement concrete pavement surface have been investigated in the field by [16] using different methods (The Sand Patch Method, Outflow Time Method, British Pendulum Tester and Photogrammetric Technique). The test results of the four methods were correlated to the skid number.
1.5. Application of Close Range Photogrammetry for Pavement Condition Survey
[17] Proposes a new direction of technology development through the use of stereovision technology for pavement for the comprehensive survey of pavement condition. The two digital cameras are used to cover half of a lane-width, approximately two meters. The pair of images on the same pavement surface is also used to establish 3D surface model, which is then used to detect the deficiencies of the pavement surface condition. Pavement condition survey includes surface distresses, such as cracking, roughness and rutting, and other surface defects. The goal is to develop a working system that is able to establish three-dimensional (3D) surface model of pavements with image processing system.
[18] Concluded that the investigated close range photogrammetry approach showed a high potential for 3D distress detection, measurement and modelling. In their research, exploited close range photogrammetry to attempt to begin to overcome the drawback of visual inspection, using a nonmetric camera. Free positions for camera station are chosen so that the taken image maintains a common overlapping area.
1.5.1. Digital Image
A digital image is a computer – compatible pictorial rendition in which the image is divided into a fine grid of picture elements or pixels. The image consists of an array of integers, often referred to as digital numbers, each quantifying the grey level, or degree of darkness, at particular elements, [19]. The digital image may be consisted of as many thousands or millions of these pixels, the appearance is that of a continuous – tone picture. Each pixel represented by a value from 0 (dark black) to 255 (bright white), the range of values (0 to 255) can be explained by examining how computers deal with numbers. Since computers operate directly in binary number system, it is most efficient to use ranges corresponding to powers of 2. In an image, the rectangular arrays of rows and columns use as a simple rectangular coordinates system, the true origin of this coordinates system is in the upper left point of the image, [19].
1.5.2. Processing Digital Imagery and Ortho BASE Triangulation
At least two images are necessary to produce a stereo product. Digital imagery can be entered directly into soft copy photogrammetric software after images were captured. IMAGINE Ortho BASE drastically reduces the cost and time associated with triangulating. It uses a technique known as bundle block adjustment for triangulation which is used in establishing a mathematical relationship between the images contained in a project, the camera or sensor model, and the ground, ERDAS [20]. By doing so, the internal geometry of each image and the relationships between overlapping images are determined. At least 3Ground control points in overlap area are necessary to transform the image coordinates into real world coordinates. These points must be clearly visible on the photographic image, [14]. The orientation serves to relate the overlapping portions of left and right images to create the stereo model. After performing relative orientation; the images were then displayed simultaneously to allow generated common points to be identifiable on the stereo overlap for each image. This enabled the overlapping portions of both image to be merged together to provide a 3D stereo image, Absolute orientation was the final orientation process carried out to tie the 3D stereo image into a real world coordinates system, [13].
2. Materials and Methods
2.1. Total Station Device
Topcon's Total Station (GTS-235) is an electronic/optical instrument used in modern surveying. It is an electronic total stations to feature wireless operation. Coordinates of an unknown point relative to a known coordinate can be determined using the total station as long as a direct line of sight can be established between the two points. To determine an absolute location a Total Station requires line of sight observations and must be set up over a known point or with line of sight to 2 or more points with known location as directed by [21]. Fig.3 shows the GTS-235 Total station devise used in this study.
2.2. Differential Global Positioning System (DGPS)
GPS is to provide 3-D positioning, navigation and velocity data for land. GPS consists of three distinct segments: the space segment (satellites), the control segment (ground tracking and monitoring stations), and the user segment (air, land, and sea-based receivers). A ground-based static or roving GPS receiver is simply a range measurement device, distances are measured between the receiver antenna and satellites in view, and the position is determined from the adjusted intersections of the range vectors. These distances are determined in the DGPS receiver by precisely measuring the time it takes a coded signal to travel from the satellites to the receiver antenna. Fig.4 shows the DGPS devise implemented in this work.
2.3. Digital Camera
A frame was designed to hold the camera by fixing the height of photo exposure to (1m.), the desired focal length of the camera is (24mm), photo overlapping (60%). Therefore, the base line become (37.5cm.). Fig.5 shows the non- metric DSLR camera implemented in the work. The close range Photogrammetric technique was performed in this work by using non-metric camera of type (Canon EOS 600D).
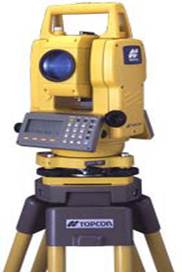
Fig. 3. Total Station device.
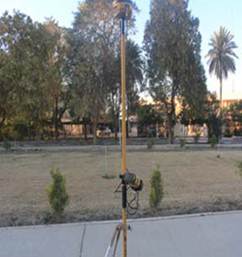
Fig. 4. DGPS device.
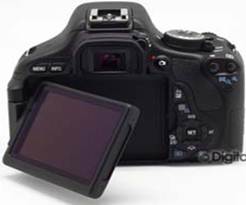
Fig. 5. Canon EOS 600D Camera.
2.4. Measurements of Ground Control Points
Fig. 6. Ortho-rectified Image showing Ground control points on pavement surface.
Photogrammetric fieldwork began with creation of certain distribution of control points around the area of distress. Ground control points are necessary for photo triangulation computations. At least three ground control points (GCPs) spread across each image were marked and measured with a Total Station device (TOPCON, GTS 235) shown in Fig.3. Triangulation was performed by Ortho BASE project in ERDAS IMAGINE software [20] to estimate the (X, Y, Z) locations of tie points in stereo model, and the exterior orientation parameters (EOP) of images can be computed. The distribution of the ground control points, in the adjusted stereo model was shown in Fig.6. Generally 3GCPs in overlap area must be identified in each image of stereo pair and several tie points are additional points were measured on stereo image. After performing triangulation with ERDAS IMAGINE software, ortho-images were created. Window measurement tool in ortho-rectified image provides all the fundamental quantitative measurement functions of each single stereo model that is necessary to measure width, lengths, area and other distress condition.
2.5. Manual Data Collection
One of the common methods of obtaining pavement texture information is by visual inspection of pavement surface, which was done by a walking along the pavement sections and selecting the spots for macrotexture assessment. Stereo images capture and sand patch test were conducted for each of the 28 selected spots on the pavement surface for the two types of pavement.
Table 1. Macrotexture variables for asphalt concrete pavement surface.
| Section | Rutting Sample ID. | Area (m2) | Depth (mm) | Intensity (%) | ||||
| From | To | Visual technique | Photo technique | Visual technique | Photo technique | Visual technique | Photo technique | |
| 0+450 | 0+500 | 17 | 8.47 | 8.39 | 0.73 | 0.64 | 5.81 | 5.65 |
| 18 | 11.05 | 10.58 | 0.90 | 0.83 | ||||
| 0+700 | 0+750 | 25 | 15.0 | 14.69 | 0.84 | 0,76 | 13.35 | 13.10 |
| 26 | 26.4 | 25.92 | 1.10 | 0.96 | ||||
| 1+300 | 1+350 | 78 | 2.04 | 1.97 | 0.95 | 0.83 | 1.88 | 1.15 |
| 32 | 1.98 | 1.97 | 0.74 | 0.64 | ||||
| 39 | 2.38 | 2.34 | 0.96 | 0.81 | ||||
| 2+150 | 2+200 | 56 | 42.0 | 41.39 | 1.37 | 1.22 | 19.17 | 18.90 |
| 57 | 8.16 | 7.97 | 1.12 | 1.05 | ||||
| 59 | 7.40 | 7.32 | 0.61 | 0.67 | ||||
| 60 | 7.64 | 7.57 | 0.66 | 0.64 | ||||
| Regression model | Y = 0.034 +1.015 X | Y = 0.015 + 1.099 X | Y = 0.543 + 0.980 X | |||||
| Coefficient of determination R2 | 0.999 | 0.982 | 0.999 | |||||
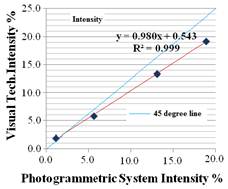
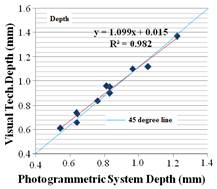
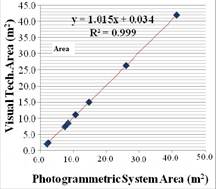
Fig. 7. Asphalt Concrete Macrotexture Variables Assessed by Both Techniques.
3. Discussion of Test Results
3.1. Macrotexture of Asphalt Concrete Pavement
Table 1 shows the assessment of Macrotexture area, depth and intensity using both testing methods (photogrammetric and sand patch MTD). Fig. 7 shows the results obtained by using both methods, it shows high correlation as indicated by high coefficient of determination R2 = (0.999), (0.982), (0.999) for area, depth and intensity respectively. The Macrotexture intensity is higher when close range photogrammetry technique is implemented as indicated by 45° line. The exposed area is higher when visual technique is adopted, on the other hand, the shallow depth of macrotexture is more pronounced with visual technique, while the profound depth of macrotexture could be better detected by close range photogrammetry as indicated by the 45° line. Such result agrees with the work reported by [3; 8; 16; 22]. The area in Table 1 represents the part of roadway section where the test was conducted, the depth represents the macrotexture depth of the pavement, while the intensity is the percent of occurrence of the macrotexture depth within the measured area.
3.2. Macrotexture of Cement Concrete Pavement
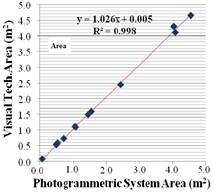
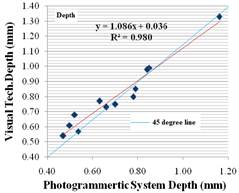
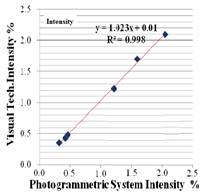
Fig. 8. Cement Concrete Macrotexture Variables Assessed by Both Techniques.
Table 2. Macrotexture Variables for Cement Concrete Pavement Surface.
| Section | Rutting Sample ID. | Area (m2) | Depth (mm) | Intensity (%) | ||||
| From | To | Visual technique | Photo technique | Visual technique | Photo technique | Visual technique | Photo technique | |
| 0+300 | 0+350 | 6 | 0.59 | 0.53 | 0.99 | 0.85 | 1.69 | 1.60 |
| 11 | 0.09 | 0.08 | 0.75 | 0.70 | ||||
| 12 | 4.31 | 4.05 | 0.80 | 0.78 | ||||
| 14 | 0.73 | 0.72 | 0.77 | 0.63 | ||||
| 0+350 | 0+400 | 31 | 1.10 | 1.09 | 0.54 | 0.47 | 0.36 | 0.33 |
| 0+450 | 0+500 | 16 | 4.11 | 4.09 | 1.33 | 1.16 | 1.22 | 1.21 |
| 1+350 | 1+400 | 40 | 4.66 | 4.55 | 0.68 | 0.52 | 2.09 | 2.06 |
| 41 | 2.46 | 2.44 | 0.61 | 0.50 | ||||
| 1+400 | 1+450 | 46 | 1.49 | 1.47 | 0.85 | 0.79 | 0.43 | 0.42 |
| 2+200 | 2+250 | 61 | 1.11 | 1.05 | 0.73 | 0.66 | 0.48 | 0.46 |
| 62 | 0.54 | 0.50 | 0.98 | 0.84 | ||||
| 63 | 1.60 | 1.56 | 0.57 | 0.54 | ||||
| Regression model | Y = 0.005 + 1.026 X | Y = 0.036 + 1.086 X | Y = 0.01 + 1.023 X | |||||
| Coefficient of determination R2 | 0.998 | 0.980 | 0.998 | |||||
Table 3. Summary of regression models obtained.
| Distress type | Area of pavement surface | Surface texture depth | Intensity | |||
| Regression model | R 2 | Regression model | R 2 | Regression model | R 2 | |
| Asphalt concrete surface | Y= 0.034 + 1.015 X | 0.999 | Y= 0.015 + 1.099 X | 0.980 | Y= 0.543 + 0.980 X | 0.999 |
| Cement concrete surface | Y= 0.005 + 1.026 X | 0.998 | Y= 0.036 + 1.086 X | 0.980 | Y= 0.01 + 1.023 X | 0.998 |
Table 2 shows the assessment of Macrotexture area, depth and intensity using both testing methods (photogrammetric and sand patch MTD) for cement concrete pavement surface. Fig.8. shows the results obtained by using both methods, it shows high correlation as indicated by high coefficient of determination R2 = (0.998), (0.980), (0.998) for area, depth and intensity respectively. The shallow depth of macrotexture is more pronounced with visual technique, while the profound depth of macrotexture could be better detected by close range photogrammetry as indicated by the 45° line. Table 3 summarizes the regression models obtained. Such findings are in agreement with [4; 9; 14; 23] work. The area in Table 2 represents the part of roadway section where the test was conducted, the depth represents the macrotexture depth of the pavement, while the intensity is the percent of occurrence of the macrotexture depth within the measured area.
4. Conclusions
Based on the testing program, the following conclusion could be drawn:
1. Stereo close range system and ERDAS IMAGINE software had proved the ability to yield more correlated results as compared to the visual method in the research area.
2. Photogrammetric approach is efficient in evaluating the Asphalt concrete surface macrotexture with a high coefficient of determination ranged between (0.980 - 0.999), and the cement concrete pavement with a high coefficient of determination ranged between (0.980 – 0.998), as compared to the traditional method of visual evaluation and sand patch method.
3. The photogrammetric technique may be implemented in monitoring the pavement surface condition and may replace the traditional visual assessment. The photogrammetric technique will provide a permanent documentation of the pavement surface condition, which could be referred when needed, while it is lower labour consuming.
4. For cement concrete pavement, the shallow depth of macrotexture is more pronounced with visual technique, while the profound depth of macrotexture could be better detected by close range photogrammetry as indicated by the 45° line.
5. For asphalt concrete pavement, the Macrotexture intensity is higher when close range photogrammetry technique is implemented as indicated by 45° line. The exposed area is higher when visual technique is adopted.
References
- Wallman C. (2001), "Friction measurement methods and the correlation between road friction and traffic safety", VTI Development AB, Project: Friction and traffic safety, Project code- 80435.
- Bazlamit S. and Reza F. (2005), "Changes in Asphalt Pavement Friction Components and Adjustment of Skid Number for Temperature", Journal of Transportation Engineering© ASCE / June 2005.
- Sarsam S.; Daham A.; Ali A. (2015) "Implementation of Close Range Photogrammetry to Evaluate Distresses at Asphalt Pavement Surface", Journals Pub, International Journal of Transportation Engineering and Traffic System JTETS, Vol. 1: Issue 1. P31-44.
- Sarsam S.; Daham A.; Ali A. (2015) "Comparative Assessment of Using Visual and Close Range Photogrammetry Techniques to Evaluate Rigid Pavement Surface Distresses", STM Journals, Trends in Transport Engineering and Applications TTEA, Volume 2, Issue 2. P 28-36.
- Sandberg U. (1997), "Influence on Road Surface Texture on Traffic Characteristics Related to Environment, Economy, and Safety. A State-of-the-art Study Regarding Measures and Measuring Methods". VTI notat 53A. Swedish National Road and Transport Research.
- Shalaby A. and El Gendy (2008), Characterizing Pavement Surface Texture Using the Photometric Stereo Technique". Technical report, USA. WINNIPEG, MB CA.
- Sullivan, B.W. (2010), "Development of a Fundamental Skid Resistance in Asphalt Mix Design Procedure", Pavement Management Service, Sydney, Australia. http://www.fugropms.com.au/downloads/papers/PaperDesignofAsphaltToMeetFrictionalRequirements.pdf
- Sarsam S. I. (2012), "Field evaluation of Asphalt Concrete Pavement surface texture and skid characteristics", Proceedings, 5th Eurasphalt & Eurobitume Congress, 13-15th June 2012, Istanbul, Turkey.
- Sarsam S. I. (2009), "Modelling Asphalt pavement surface texture using field measurements", Proceedings, TRB – Conference, Developing a research agenda for Transportation infrastructure preservation and renewal, Washington D.C., November 12-13.
- Doty R. (1974), "A Study of the Sand Patch and Outflow Meter Methods of Pavement Surface Texture Measurement", ASTM Annual Meeting Symposium on Surface Texture and Standard Surfaces, Washington.
- ASTM, American Society for Testing and Materials (2009). Annual Book of ASTM Standards, "Road and Paving Materials; Vehicle-Pavement System", 04.03.T321-07.
- Mikhail E. M., Bethel J. S. and McGlone J. C., (2001). "Introduction to Modern Photogrammetry". New York: John Wiley & Son, Inc., USA.
- Chai L. T., (2005) "Evaluation of cracks and disintegration using Close Range Digital Photogrammetry and Image Processing Technique", M.Sc. Thesis, Department of Civil Engineering, College of Engineering, University technology Malaysia, April.
- Burson E., (2001) "Geospatial Data Concrete, Analysis, and Procedural Standards for Cultural Resources Site Monitoring", Contract No. DACW38-98-D-0003, miscellaneous reports of investigations number 218, Geo-Marine, Texas.
- China S. and James D. (2012) "Comparison of Laser Based and Sand Patch Measurements of Pavement Surface Macrotexture", DOI: 10.1061/ (ASCE) TE.1943-5436.0000315, American Society of Civil Engineers.
- Al shareef H. N., (2011) "Assessing Asphalt and Concrete Surface Texture in the Field", M.Sc. Thesis, Department of Civil Engineering, the University of Baghdad.
- Wang K. and W. Gong (2002) "Automated Pavement Distress Survey, A Review and a New Direction", Pavement Evaluation Conference, Virginia, 2002. http://Pms.Nevadadot.Com/2002/43.
- Ahmed M.F.M.; Haas, C.T.,(2010) "The Potential of Low Cost Close Range Photogrammetry towards Unified Automatic Pavement Distress Surveying". Proceedings of the Annual Waterloo Demographic Centre Conference
- Wolf R., Dewitt A.,(2000) "Elements of Photogrammetry with Application in GIS", 3rd edition. Boston: McGraw-Hill, USA. (2000).
- ERDAS, Inc., (2003). "IMAGINE Ortho BASE User’s Guide", ERDAS IMAGINE V8.4, Atlanta, Georgia.
- Davis J., (2010) "Topcon GTS-235, Total Station Guide" San Francisco State University IGISc.
- Henault J. (2011), "Characterizing the Macrotexture of Asphalt Pavement Designs in Connecticut", Research Project: SPR-2243, Report 2, Report No. CT-2243-2-10-3.
- Flintsch G., León E., McGhee K., and Al-Qadi I. (2003), "Pavement Surface Macrotexture Measurement and Application", TRB, Volume 1860.


