
International Journal of Materials Chemistry and Physics, Vol. 1, No. 2, October 2015 Publish Date: Jul. 29, 2015 Pages: 99-109
Extraction of Cellulose Nano Crystalline from Cotton by Ultrasonic and Its Morphological and Structural Characterization
Ismail K. Ibrahim (Al-Khateeb)*, Sabri M. Hussin, Yusra M. Al-Obaidi
Chemistry Dept., College of Science, University of Anbar, Ramadi, Iraq
Abstract
Cellulose nano-crystals (CNCs) were obtained from native cotton fibers by sulphuric acid hydrolysis with range of 30% to 60%, followed by sonication using ultrasonic technology. Nano cellulose has been characterized by transmission electron microscopy (TEM) scanning electron microscopy (SEM) and atomic force microscopy (AFM), X-ray diffraction (XRD), and Fourier transformed infrared (FTIR) spectra. TEM and SEM showed nano fibres - like morphology for low acid concentration, while increasing the acid rate to 40% - 60% showed rod-like shape particles and spherical nano particles. Nano cellulose was quite different from that of unsonicated samples. X-ray diffraction data showed that the fibres had been transformed from cellulose (native) to nano cellulose crystal structure, which manifests significant conversion of cellulose. Nano cellulose exhibited identical FTIR spectra quite different from that of unsonicated samples.
Keywords
Cellulose Nano-Crystals, Acid-hydrolysis, Sonication
Received: July 2, 2015
Accepted: July 15, 2015
Published online: July 29, 2015
@ 2015 The Authors. Published by American Institute of Science. This Open Access article is under the CC BY-NC license. http://creativecommons.org/licenses/by-nc/4.0/
1. Introduction
Among the various organic nano particles, cellulose nano particles have encountered an enormous consideration for diverse causes. Nevertheless, cellulose has several substantial practical applications such as being renewable, biodegradable, environmentally friendly, low-priced, and possessing enormous mechanical strength (1). Cellulose is the most abundant polymer and it is the main component of most plant biomass (2). A number of residual plants have been chosen as a source for the production of cellulose nano particles such as corn cobs, rice straw, banana stems, sugar beet, soy hulls and many others (3). Nano cellulose and its derivatives presents a new brand of nano technology that appear to have very wide applications in a variety of materials related domains where physical characteristics such as strength, weight, rheology, and optical properties can be affected in a very positive manner (4). Also, the cellulose nano crystal (CNC) is one of the strongest and stiffest organic molecules, that has a modulus of 145 GPa and a strength estimated at 7500 MPa. CNCs have high surface areas (~250 m2/g), hydrophilic, and quite amenable to surface activation. CNCs are long, thin rods (5).
Nano cellulose can be classified according to various factors such as shape, size and structure. For the shape characteristic, there are basically three types: sheet, spherical and whiskers. It is obvious that micro fibrillated nano cellulose (MFC) shape is sheet alike while microcrystalline cellulose exists in two forms; spherical and whisker. It should be noted that within each structure of nano cellulose there is a distribution of lengths, width, and percent crystallinity. These structures have various varieties such as (particle-like, rod-like, web-like and fibre-like). MFC has two forms; web-like and fibre-like, while NFC due to its structure has the form of fibre-like only (6, 7, 8).
2. Materials and Methods
(a). Preparations of CNC from Cotton
Cotton was collected from Anbar area, Iraq as a raw material for CNC extraction process. A modification of hydrolysis procedure for CNC preparation by emphasizing the reduction of acid concentration, elimination of dialysis and freeze-drying method compared to methods described elsewhere (9,10). The cotton samples were washed with distilled water, dried at 100 oC for 48 h and bleached at 80 oC for 4 h using 0.1 % sodium hydro chlorite. The bleached fibres were filtered and washed several times with distilled water and dried. Ten grams of bleached fibres coming from bleaching step have been hydrolyzed in 100 ml of a sulphuric acid at various concentration (30, 40, 50, 60%) using vigorous stirring. For termination of the reaction, 100 ml of deionized water was mixed with the solution, cooled at 10 oC. The pH was adjusted to 7 by using 1 % of NaOH. The suspension was filtered, collected and sonicated by Ultra Sonicator (UP400S) with amplitude 80 for different periods of time (30, 60, 120 min). The subsequent CNC was dried, converted to powder and stored for later use.
(b). Characterization
Transmission Electron Microscope (TEM), Environmental Scanning Electron Microscopy (FEI-SEM), Atomic Force Microscopy (AFM) and X-Ray Diffraction (XRD) were used for morphological characterization of CNC samples. The samples were ground, mixed with KBr, pressed into thin pellets. IR-Spectra were measured by using FTIR (model VERTEX 70) with Hyperion scanning Microscope device to monitoring the change of CNC functional groups.

Fig. 1. TEM image of CNC prepared from cotton sonicated for 120 min and 30% H2SO4.

Fig. 2. TEM image of CNC prepared from cotton sonicated for 120 min and 50% H2SO4.
3. Results and Discussions
The hydrolysis process by using H2SO4 and treated with ultrasonic prepared from cotton lead to produce nano cellulose as nano fibres and nano particles which identified by using different morphological techniques.
(a). TEM micrograph
The TEM micrographs showed a nano fibre form like with an average diameter of (19 nm) of sample 30% H2SO4 sonicated for 120 min (Fig. 1). These results are in consistent with previous researches (11,12). Increasing the concentration of acid to 40% sonicated for 120 min was produced spherical nano particles (Fig. 2) which have an average diameter of 38-70 nm. By increasing the acid concentration to 50%, a mixture of nano-particles and rod-like shape particles were generated and created a diameter of 50 nm. By continuous increasing the acid concentration to 60%, non uniform spherical nano-particles were extracted. These particles have an average diameter of (16.34 -27.49 nm).
(b). SEM micrograph.
No CNC particles were observed with unsonicated cotton sample (Fig. 3) meanwhile the fibres of the sample are long and smooth. While a change in morphology was occurred with the sonicated samples and acid hydrolysis. A cluster of nano fibres with average of diameter 28 nm and average length of 500 nm were observed with sample of CNC prepared at concentration of 30 % H2SO4 sonicated for 30 min. Also, amorphous regions were exist in the sample and distributed with the nano fibres (Fig.4). However a nano mesh network was observed within fibres by increasing the sonication time to 60 and 120 min at same acid concentration with an average length of 200 to 800 nm and 17.5 to 28.5 nm in diameter. However, the amorphous regions were completely disappeared for samples sonicated for 60 min (Fig.5). Increasing the acid concentration to 40 % at different sonication times indicated a formations of different uniforms and amorphous regions of nano fibres with an average diameter of 21 to 100 nm and branching into smaller sub nano web-like net (Figs.6 and 7). Increasing both factors, the acid concentration and sonication time, to the highest level (60 % acid and120 min) carried out a good indication for nano particle formation. These conditions grow up small nano particles at average diameter of 39 nm, and the amorphous regions completely disappeared (Fig.8). These results are in a fair to good agreement with other investigations (13,14).

Fig. 3. SEM image of unsonicated sample.

Fig. 4. SEM image of CNC prepared from cotton sonicated for 30 min and 30 % H2SO4.

Fig. 5. SEM image of CNC prepared from Cotton sonicated for 120 min and 30 % H2SO4.

Fig. 6. SEM image of CNC prepared from cotton sonicated for 30 min for 40 % H2SO4.

Fig. 7. SEM image of CNC prepared from cotton sonicated for 120 min and 40 % acid.

Fig. 8. SEM image of CNC prepared from Cotton sonicated for 120 min and 60 % acid.
(c). AFM micrograph
The morphological characteristics of cellulose nano crystals have been studied using Atomic Force Microscope (AFM) to for observing nanostructure. Figures 9 and 10 showed AFM images present a two-dimensional and three-dimensional view of the surface structure for CNC. The images confirmed that the cellulose nano crystals have a smooth surface and small particles size distribution. The particle size distributions for 120 min sonication were determined and the diameter averages of 76.29 nm, 63.73 nm, 59.58 nm and 94.26 nm for samples of 30 % acid, 40 % acid 50 % acid 60 % acid respectively (Figs.11 and 12).
(d). X-ray diffraction
Table 1. Crystanllity Index and Crystanllity Percentage of nano cellulose at different acid concentration and sonication time.
| Crystanllity % | Crystanllity Index | Treatment | |
| Sonication (min) | Acid % | ||
| 72.57 | 62.21 | Unsonicated Sample | ---- |
| 83.72 | 80.55 | 30 | 30 |
| 84.25 | 81.30 | 60 | 30 |
| 82.19 | 78.34 | 120 | 30 |
| 84.34 | 81.43 | 30 | 40 |
| 85.83 | 83.49 | 60 | 40 |
| 81.91 | 77.92 | 120 | 40 |
| 82.61 | 78.95 | 30 | 50 |
| 85.11 | 82.50 | 60 | 50 |
| 81.47 | 77.26 | 120 | 50 |
| 70.09 | 57.33 | 30 | 60 |
| 76.70 | 69.63 | 60 | 60 |
| 72.22 | 61.53 | 120 | 60 |
Four different types of crystalline allomorphs have been recognized by their characteristic of X-ray diffraction (XRD) models: celluloses I, II, III and IV. Cellulose I is the majority abundant type encountered in nature and is a mixture of two individual crystalline forms: celluloses Iα (triclinic) and Iβ (monoclinic) (15). XRD is the most extensively used to estimate the crystallinity index (CrI) and the percentage of crystalline. XRD diffractions patterns where engaged to determine the crystallinity parameters of CNC derived from cotton samples (Figs.13 and 14). The CNC samples showed three 2θ peaks, 14.6 ο, 18 ο and 22 ο, which represents typical cellulose I structure (16). The results revealed that the CrI of different CNC samples prepared under different conditions increasing with sonication time until reaching a maximum value at 60 min. However, there was a significant decrease in the CrI values at 120 min sonication time (Table 1). The micro-jet yielded by ultrasonic caviatation was destroyed the surface of cellulose, and fibrillation was obtained; hence the surface area was increased, resulting to speeding up in the oxidization reaction (17). This may be due to the mechanical tension enforced by the ultrasonic power which broke up the crystalline order of the cellulose skin rather than the interior cellulose and decreased the CrI. Additionally, the localized tremendous temperature and pressure circumstances (5000ºC and 500 atm) and the aggressive shock waves formed by cavitation might put up in the step-down of the crystalline order of cellulose (11). The diffraction peaks positioned at 2θ = 22.5ο for samples that showed a higher CrI seemed to be sharper and have a bigger magnitude than the peaks produced by others. These interpretations pointed better defined crystalline domains and are affirmed by the increase in the CrI (12). The same patterns can be applied for percentage of crystalline.

Fig. 9. AFM image of CNC prepared from cotton sonicated for 120 min and 30 % acid.

Fig. 10. AFM image of CNC prepared from cotton sonicated for 120 min and 40 % acid.

Fig. 11. Particle size distribution of CNC sonicated for 120 min and 40 % acid.

Fig. 12. Particle size distribution of CNC sonicated for 120 min and 40 % acid.

Fig. 13. X-ray diffraction patterns of unsonicated cotton.
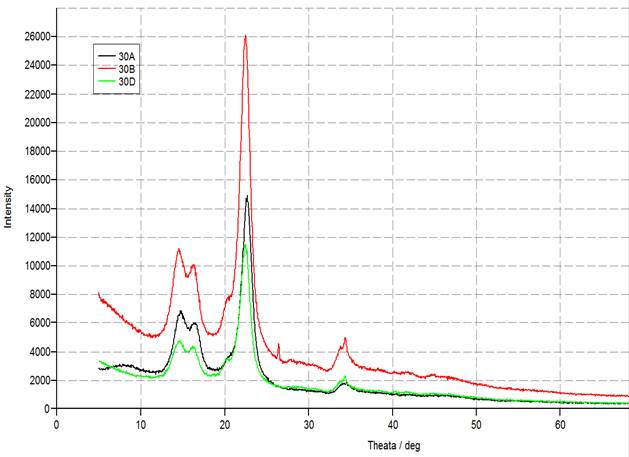
Fig. 14. X-ray diffraction nano cellulose patterns of acid 30 % at different sonification time.

Fig. 15. FTIR Spectrum of cotton raw material.

Fig. 16. FTIR Spectrum of cotton based nano cellulose with acid concentration at 30 % and sonication time at ( 30 min (60A), 60 min (60B) and 120 min (60D)).
(e). FTIR Identification
FTIR spectroscopic inquires proof about the absorption bands to characterize the prepared CNC. The strong broad with range of 3400 – 3300 cm-1 attributed to O-H stretching (18), while a peak near 2900 cm-1 assigned to the C-H stretching vibration (Figs.16-18). These peaks decreased in intensity compared to that of unsonicated raw material spectra (Fig.15). The carboxyl group absorption peak was observed at 1650 cm-1 (19) meanwhile the peak of 1730 cm-1 in the spectrum was attributed to the C═O stretching of actyl group and uranic ester groups of the hemicellulose or to the ester linkage of the carboxylic group in the lignin and hemicelluloses (20). On the other hand, the peak of 1280 cm-1 belong to C-O stretching of the aryl group in lignin (21), these peaks were totally fade away from the spectra of extracted CNC. These results suggested that all the hemicellulose and lignin have been moved out from CNC obtained specially with uppermost levels of acid concentration and sonicated time. In addition, the peaks of 1431 cm-1, 1373 cm-1 and 1317 cm-1 are associated with twisting vibrations of –CH2, C-H and C-O groups of the aromatic rings respectively. These peaks appeared at unsonicated sample as well as at CNC samples (22). The peaks located at 1031 cm-1 to 1162.9 cm-1 attributed to the deformation of the C-H rocking vibration and the C-O-C pyranose ring skeleton (4). Finally, the a absorbance peak observed at 896 cm-1 was assigned to the symmetric C-O-C stretching of β ( 1-4 )-glycosidic linkage (23), which became lower in intensity for CNC spectra compared to that of unsonicated sample.

Fig. 17. FTIR Spectrum of cotton based nano cellulose with acid concentration at 40 % and sonication time at ( 30 min (60A), 60 min (60B) and 120 min (60D)).
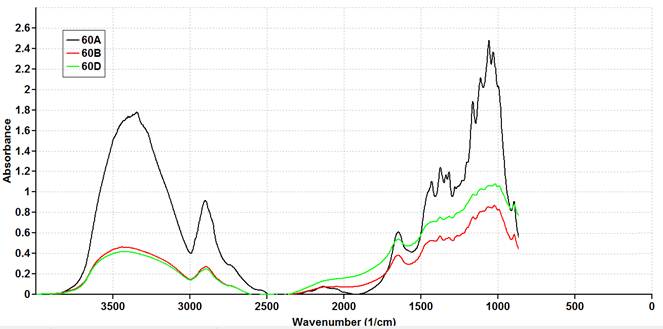
Fig. 18. FTIR Spectrum of cotton based nano cellulose with acid concentration at 60 % and sonication time at ( 30 min (60A), 60 min (60B) and 120 min (60D)).
4. Conclusions
In conclusion, this study has successfully modified the hydrolysis procedure for CNC preparation by emphasizing the reduction of acid concentration, elimination of dialysis and freeze-drying method by demonstrated the use of Sonication technique in extraction of CNC. The results indicate that the TEM, SEM, AFM, X-ray diffraction, and FTIR spectroscopy techniques confirmed the formation of cellulose nano particles followed this method. However, the best results under sonication conditions used are coming from treatment of 40% acid sonicated for 120 min. This work indicates that cellulose nano particles had a good valuable potential in the future for utilization in industrial and remedial purposes. Although cellulose nano particles of fairly well-defined dimensions were generated using this method, the exact reason for the differences in the sizes of nano particles produced using cotton has to be further investigated.
Acknowledgements
Laboratory equipments support at UNAM centre, University of Bilkent, Ankara, Turkey and the assistance of TEM laboratory at Middle East Technical University (METU), Ankara, Turkey are deeply appreciated and gratefully acknowledged.
References
- Chih-Ping Chang, I-Chen Wang, Kuo-Jung Hung. Preparation and characterization of nanocrystalline cellulose by acid hydrolysis of cotton. Taiwan J. Sci. 25: 251-64, 2010.
- E. Eduardo. Cellulose nanocrystals properties and applications in renewable nanocomposites. Ph.D. Thesis, the Graduate School of Clemson University, Clemson, USA,2011.
- Arup Mandal, Debabrata Chakrabarty. Isolation of nanocellulose from waste sugarcane bagasse (SCB) and its characterization. Carbohyd. Poly. 86 : 1291– 1299, 2011.
- Mubatmnad Shahid Nazir, Bambang Ali Wahjoedi, Abdul Wahid Yussof and Mohd Azmuddin Abdullah .Eco-friendly extraction and characterization of cellulose from oil palm empty fruit bunches. Bio Resou. 8: 2161-2172, 2013.
- Wei Kong, Tom Plant, John Simonsen, Glenn Evans. Cellulose nanocrystal electro-optic devices. J. App. Physics 2006. 97, 053101.
- Mengsheng Wang. Surface modification and characterization of nano crystalline cellulose. M. Sc. Sci. Thesis, Chalmers University of Technology, Göteborg, Sweden, 2011.
- Robert J. Moon, Ashlie Martini, John Nairn, John Simonsenf. Cellulose nanomaterials review: structure, properties and nanocomposites. Chem. Soc. Rev. 40: 3941–3994, 2011.
- Ingvild Kvien, Characterization of biopolymer based nanocomposites. Ph.D. Thesis, Norwegian University of Science and Technology, Trondheim, January 2007.
- Samit Kumar, Yuvraj Singh Negi, Jugmendra Sain Upadhyaya. Studies on characterization of corn cob based nanoparticles. Adv. Mat. Lett. 1: 246-253, 2010.
- Suh Cem Pang, Suk Fun Chin, Victor Yih. Conversion of cellulosic waste materials into nanostructured ceramics and nanocomposites", Adv. Mat. Lett., 2: 118-124, 2011.
- Hussein Oubani, Ali Abbas, Andrew Harris. Investigation on the mechanical pretreatment of cellulose by high intensity ultrasound and ball milling. Cellulose 19:855–866 2012.
- Hanieh Kargarzadeh, Ishak Ahmad, Ibrahim Abdullah, Alain Dufresne. Effects of hydrolysis conditions on the morphology, crystallinity, and thermal stability of cellulose nanocrystals extracted from kenaf bast fibers. Cellulose 19:855–866,2012.
- Shree P. Mishra, Anne-S. Manent, Bnmo Chabot, and Claude Daneault. Production of nanocellulose from native cellulose-various options utilizing ultrasound. Bio Resou. 7: 422-436, 2012.
- Mingzhu Ran, Xiaoyyan Zhou, and Minzhi Chen. Cellulose nano whiskers isolation and properties from acid hydrolysis combined with high pressure homogenization. Bio Resou. 8: 933-943, 2013.
- Sunkyu Park, John O Baker, Michael E Himmel. Cellulose crystallinity index: measurement techniques and their impact on interpreting cellulose performance. Biotech. Biofuel., 3:10,2010.
- Mingzlm Pan, Xiaoyan Zhou, and Minzhi Chen. Cellulose nanowhiskers isolation and properties from acid hydrolysis combined with high pressure homogenization. BioReso. 8: 933-943,2013.
- Zhong-Yan Qin, Guo-Lin Tong, Y. C. Frank Chin, and Jian-Cheng Zhou. Preparation of ultrasonic-assisted high carboxylate content cellulose nanocrystals by tempo oxidation. BioReso. 6: 1136-1146, 2011.
- S. Y. Cho, Y. Choi, D. Park, S. Heo, D. H. Kim, H. -J. Jin. Cellulose nanocrystals with high thermal stability and their nanocomposites with poly(lactic acid). 18th International Conference on Composite Materials, 2009.
- C.E. Ponce-Reyes, J.J. Chanona-P´erez, V. Garibay-Febles. Preparation of cellulose nanoparticles from agave waste and its morphological and structural characterization. 13: 897-906, 2014
- Mizi Fan1, Dasong Dai1, Biao Huang.Fourier Transform Infrared Spectroscopy for Natural Fibres", DOI: 10.5772/35482, Intech Open Science, May 23, 2012.
- Lukmanul Hakim Zaini, Mehdi Jonoobi, Paridah Md. Tahir. Isolation and characterization of cellulose whiskers from kenaf (Hibiscus cannabinus L.) Bast Fibers. J. Biomat. Nanobiotechn. 4: 37-44,2013.
- Yuvraj Singh Negi, Veena Choudhary, Nishi Kant Bhardwaj. Characterization of cellulose nanocrystals produced by acid-hydrolysis from sugarcane bagasse as agro-waste. J. Mat. Phys. Chem. 2, 1-8, 2014.
- Yihong Wang, Xiaoyi Wei, Jihua Li. Homogeneous isolation of nanocellulose from cotton cellulose by high pressure homogenization. J. Mat. Sci. Chem. Eng. 1, 49-52, 2013.


