
International Journal of Advanced Materials Research, Vol. 2, No. 5, September 2016 Publish Date: Jul. 27, 2016 Pages: 80-85
Theoretical Study of Phase Diagram, Lindemann Melting Temperature and Eutectic Point of Binary Alloys
Nguyen Cong Toan1, *, Nguyen Van Hung1, Nguyen Ba Duc2,
Dinh Quoc Vuong3
1Department of Physics, Hanoi University of Science, Hanoi, Vietnam
2Department of Physics, Tan Trao University, Tuyen Quang, Vietnam
3Quang Ninh Education & Training Department, Cam Pha School, Quang Ninh, Vietnam
Abstract
Abstract:In this work, a theory is derived for the calculation and analysis of phase diagram of binary alloys composed of constituent elements having the same structure and any proportion. Analytical expression of phase diagram has been derived using the ratio of root mean square fluctuation in atomic positions on the equilibrium lattice positions and the nearest neighbour distance. The theory is based on Lindemann criterion so that the calculated phase diagram provides information on Lindemann melting temperatures and eutectic point of binary alloys. Numerical results for Cs1-xRbx, Cu1-xAux, Cu1-xNix and Cr1-xCsx are found to be in good and reasonable agreement with experiment.
Keywords
Phase Diagram, Lindemann Melting Temperature, Eutectic Point, Binary Alloys
Received: June 7, 2016
Accepted: June 19, 2016
Published online: July 27, 2016
@ 2016 The Authors. Published by American Institute of Science. This Open Access article is under the CC BY license. http://creativecommons.org/licenses/by/4.0/
Contents
1. Introduction
Melting of materials has great scientific and technological interest. The problem is to understand how to determine the temperature at which a solid melts, i.e., its melting temperature. The Lindemann criterion [1, 2] is based on the concept that the melting occurs when the ratio of the root mean square fluctuation (RMSF) in atomic positions on the equilibrium lattice positions and the nearest neighbour distance reaches a threshold value. Binary alloys having liquidus consisting of two branches in their phase diagram or melting curve are called eutectics [3] and the minimum solidification temperature is called the eutectic point [3]. The binary alloy phase diagrams have been experimentally studied [4]. Phenomenological theory of the phase diagrams of the binary eutectic systems [5] has developed to show qualitatively the temperature-concentration diagrams of eutectic mixtures using a Landau-type approach, which involves a coupling between the liquid-solid transition order-parameters and a specific nonlinear dependence on concentration of the free-energy coefficients. Here the eutectic point is considered more generally as the minimum of the phase diagram or melting curve.
Many efforts have been made to study the melting problems and some results can be seen bellow. The melting curves of materials in pressure-dependence have been investigated [6], where the research is focused mainly on individual crystals (Fe and Al). The Lindemann criterion and vortex lattice phase transition in type-II superconductors have been in detail discussed [7]. Here, they found that it is important to distinguish between slightly different versions of the Lindemann criterion depending on either quenched disorder-induced and thermal fluctuations which act cooperatively or independently in destroying the lattice order. The distance fluctuation criterion for melting with comparison of square-well and Morse potential models for cluster and homopolymers [8] has been discussed to analyze a mechanism leading to melting. A generalized set of Lindemann measures, based on the positional displacements of atoms from their locations in the corresponding mechanically stable inherent structures, has been studied in the neighborhood of the melting transition for a Lennard-Jones type solid [9]. Here, the mechanism for the solid-liquid phase transition based on the Lindemann criterion has been studied using Monte-Carlo simulation. Unfortunately, a complete theory for the analytical calculation and analysis of the melting transition and phase diagram of materials, especially for alloys, is still not available.
The purpose of this work is to derive a theory for the calculation and analysis of the phase diagram or melting curve of binary alloys composed of constituent elements having the same structure and any proportion. The development presented in Sect. 2 is derivation of the analytical expressions for the atomic mean square displacement (MSD), mean lattice energy, atomic mean square fluctuation (MSF), and then the ratio of the RMSF in atomic positions on the equilibrium lattice positions and the nearest neighbour distance, from which the phase diagram or melting curves of binary alloys has resulted. The theory is based on Lindemann idea regarding the melting [1, 2] so that the derived phase diagram provides information on the Lindemann melting temperatures of the binary alloys with respect to any proportion of the constituent elements and on their eutectic points. Numerical results (Sect. 3) for the binary alloys Cs1-xRbx, Cu1-xAux, Cu1-xNix and Cr1-xCsx are compared to experiment [4] which show good and reasonable agreement.
2. Formalism
The atomic oscillating amplitude is characterized by the MSD or Debye-Waller factor (DWF) [10-15] which has the form [10]
 , (1)
, (1)
where K is the scattering vector which is equal to a reciprocal lattice vector, and ![]() is the mean atomic vibration amplitude.
is the mean atomic vibration amplitude.
If each binary alloy lattice cell contains p atoms, where on average s is the number of atoms of type 1 and (p-s) is the number of atoms of type 2 of a binary alloy, then the quantity ![]() is given by
is given by
 . (2)
. (2)
The potential energy of an oscillator is equal to its kinetic energy, so that the mean energy of atom k vibrating with wave number q has the form
![]() . (3)
. (3)
Using Eqs. (3), the mean energy of the crystal consisting of N lattice cells is given by
![]() , (4)
, (4)
where M1, M2 are the masses of atoms of types 1 and 2, respectively.
Using the relationship between ![]() and
and ![]() [12], i.e.
[12], i.e.
![]() , (5)
, (5)
and Eqs. (3) and (4), the mean energy for the atomic vibration of the qth lattice mode has resulted as
![]() . (6)
. (6)
The mean energy for this qth lattice mode with p atoms in a lattice cell calculated using the phonon energy with ![]() as the mean number of phonons has the form
as the mean number of phonons has the form
 , (7)
, (7)
so that, using Eqs. (6) and (7) it has resulted as
 . (8)
. (8)
From Eqs. (2) and (5) the mean atomic vibration amplitude for qth lattice mode is obtained
 . (9)
. (9)
To study the MSD Eq. (1) it is suitable to use the case, where all three vibrations have the same velocity [10]. Hence, it is necessary to calculate the contribution of each polarization. Taking Eq. (9) into account, and then using Eq. (8), the MSD or DWF of Eq. (1) with all three polarizations is given by
 . (10)
Transforming the sum over q into the corresponding integral, and applying this to the high temperature area (![]() ) due to the melting with
) due to the melting with ![]() being the Debye temperature, the DWF has resulted from Eq. (10) as
being the Debye temperature, the DWF has resulted from Eq. (10) as
![]() , (11)
, (11)
which is linearly proportional to the temperature T as it was mentioned already [10, 13-15].
From Eq. (10) and using Eq. (1) for W, it is given by
![]() . (12)
. (12)
The mean crystal lattice energy has been calculated as
![]() . (13)
. (13)
Using this expression and Eqs. (4) and (7), the atomic MSF is derived in the form
 , (14)
which by using Eq. (12), has resulted as
 . (15)
Here, in the binary alloy lattice cell n, the thermal vibration describing the atomic fluctuation function, denoted by number 1 for the 1st constituent element and by number 2 for the 2nd constituent element composing the binary alloy, is given by
 , (16)
![]() , (17)
, (17)
with ![]() being the lattice vibration frequency and q the wave number.
being the lattice vibration frequency and q the wave number.
Further, using W from Eq. (11) this expression has resulted as
 . (18)
Hence, at ![]() the MSF in atomic positions about the equilibrium lattice positions is determined by Eq. (18) which is linearly proportional to the temperature T.
the MSF in atomic positions about the equilibrium lattice positions is determined by Eq. (18) which is linearly proportional to the temperature T.
Therefore, at a given temperature T the quantity R defined by the ratio of the RMSF in atomic positions on the equilibrium lattice positions and the nearest neighbour distance d is given by
 . (19)
This expression for R contains the parameters p and s which are different for different binary alloy structures and the parameter m concerning the atomic mass M1 of element 1 and atomic mass M2 of element 2 composing the binary alloys. So that it represents the contribution of different binary alloys consisted of different pairs of elements having the same crystal structures.
Based on the Lindemann criterion, the binary alloy will be melted when this ratio R of Eq. (19) reaches a threshold value Rm, then the Lindemann melting temperature ![]() for a binary alloy using Eq. (19) is defined as
for a binary alloy using Eq. (19) is defined as
 , (20)
where
 . (21)
This expression for the Lindemann melting temperature can be applied to different binary alloys composed of different pairs of elements, with the atomic masses M1 and M2 having the same crystal structures defined by the parameters p and s.
If x is denoted as proportion of the mass of the element 1 in the binary alloy, then it has the form
 . (22)
From this equation the mean number of atoms of the element 1 in each binary alloy lattice cell is obtained as
 . (23)
It is considered that one element to be the host and another the dopant. Since the tendency to be the host is equal for both constituent elements, the average of the parameter m with respect to the atomic mass proportion of the constituent elements in the binary alloy is taken as
![]() . (24)
. (24)
This equation can be solved using the successive approximation. Substituting the zero-order term with s from Eq. (23), the 1st order term equation is given by
 , (25)
which provides the following solution
 , (26)
replacing m in Eq. (20) for the calculation of Lindemann melting temperature.
The threshold value Rm of the ratio of RMSF in atomic positions on the equilibrium lattice positions and the nearest neighbour distance at melting is contained in ![]() which will be obtained by an averaging procedure. The average of
which will be obtained by an averaging procedure. The average of ![]() can not be directly based on
can not be directly based on ![]() and
and ![]() because it has the form of Eq. (21) containing
because it has the form of Eq. (21) containing ![]() , i.e., the second order of
, i.e., the second order of ![]() , while the other averages have been realized based on the first order of the displacement. That is why we have to perform the average for
, while the other averages have been realized based on the first order of the displacement. That is why we have to perform the average for ![]() and then obtain
and then obtain
 , (27)
containing![]() for the 1st element and
for the 1st element and ![]() for the 2nd element, for which we use the following limiting values
for the 2nd element, for which we use the following limiting values
![]() , (28)
, (28)
containing Tm(1) and Tm(2) as melting temperatures of the 1st or doping element and of the 2nd or host element, respectively, which compose the binary alloy.
Therefore, the melting temperature of binary alloys has been obtained from the calculated ratio of RMSF in atomic positions on the equilibrium lattice positions and nearest neighbour distance Eq. (19).
The eutectic point is calculated using the condition for the minimum of the melting curve, i.e.,
 . (29)
Hence, one can determine the phase diagram or melting curves, from which the Lindemann melting temperatures of the binary alloys with respect to any proportions of their constituent elements, using Eq. (20) with Eqs. (22), (23), (26), (27), (28) and then their eutectic points using Eq. (29). The eutectic isotherm is the one for which T equals the eutectic melting temperature TE.
3. Numerical Results and Discussions
Now, the derived theory is applied to numerical calculations for binary alloys. Beside calculating the atomic number in an elementary cell of the binary alloy, the other input data are taken from Ref. 3. The numerical calculations using the derived theory are focused mainly on the phase diagram or melting curve giving the Lindemann melting temperatures with respect to any proportion of the constituent elements, and eutectic points of binary alloys. The eutectic isotherm is apparently T = TE.
The phase diagrams or melting curves of binary alloys Cs1-xRbx (Fig. 1) and Cu1-xAux (Fig. 2) calculated using the present theory correspond with experiment [4] and belong to the types [5], where their eutectic points are lower than the melting temperature of the host elements Cs and Cu and of the doping elements Rb and Au, respectively. Here, the calculated results for Cs1-xRbx (Fig. 1) are found to be in reasonable agreement with experiment [4]. Figs. 3 and 4 illustrate the phase diagrams of Cu1-xNix and Cr1-xCsx, respectively, calculated using the present theory. Here, the calculated results for Cu1-xNix (Fig. 3) agree well with experiment [4] and belong to the types [5], where the eutectic temperature is equal to the melting temperature of the host element Cu, while the calculated results for Cr1-xCsx (Fig. 4) belong to the type [5], where the eutectic point is equal to the melting temperature of the doping element Cs.
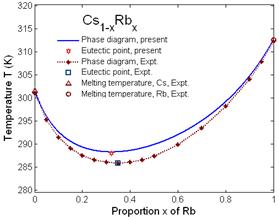
Fig. 1. Phase diagram and eutectic point of binary alloy Cs1-xRbx calculated using the present theory compared to experiment [4] and to the experimental melting temperatures of its constituent elements Cs and Rb [3].
The calculated phase diagrams or melting curves represented in Figs. 1 and 2 provide Lindemann melting temperatures of the considered binary alloys which vary with respect to increasing proportions x of the doping elements Rb, Au, Ni and Cs, between the melting temperatures of the pure host elements, when the whole elementary cell is occupied by the host atoms, and the pure doping elements, when the whole elementary cell is occupied by the doping atoms. Figs. 1 and 2 also illustrate the rate at which the atoms become more weakly bonded after Cu and Cs were mixed by the doping elements Rb and Au, respectively, because the melting temperature decreases up to the eutectic point, and more tightly bonded after the eutectic point because the melting temperature increases. Fig. 3 for Cu1-xNix shows the rate that the atoms become more tightly bonded after the host element Cu was doped by Ni because the melting temperature increases. Fig. 4 for Cr1-xCsx shows the rate that the atoms
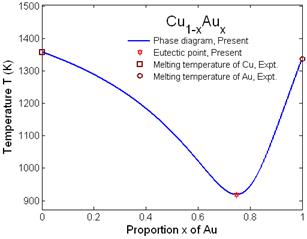
Fig. 2. Phase diagram and eutectic points of binary alloy Cu1-xAux calculated using the present theory compared to the experimental melting temperatures of its constituent elements Cu and Au [3].
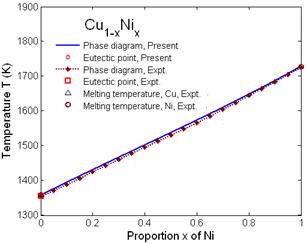
Fig. 3. Phase diagram and eutectic points of binary alloy Cu1-xNix calculated using the present theory compared to experiment [4] and to the experimental melting temperatures of its constituent elements Cu and Ni [3].
become more weakly bonded after the host element Cr was doped by Cs, because its melting temperature decreases.
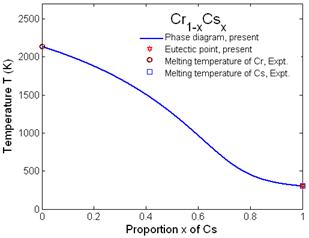
Fig. 4. Phase diagram and eutectic points of binary alloy Cr1-xCsx calculated using the present theory and to the experimental melting temperatures of its constituent elements Cr and Cs [3].
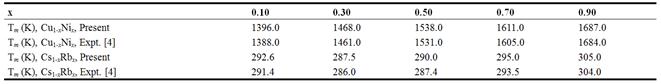
The good agreement of the Lindemann melting temperatures of Cu1-xNix and Cs1-xRbx taken from the phase diagrams or melting curves of these binary alloys calculated using the present theory for different proportions x of Ni and Rb doped in Cu and Cs, respectively, to form these binary alloys, with experiment [4] is illustrated in Table 1.
Table 1. Comparison to experiment [4] of Lindemann melting temperatures Tm (K) of Cu1-xNix and Cs1-xRbx, taken from the phase diagrams of these binary alloys calculated using the present theory with respect to different proportions x of Ni and Rb doped in the host elements Cu and Cs, respectively.
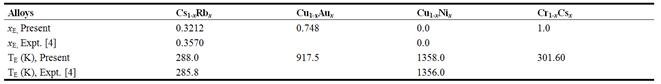
The eutectic melting temperatures TE (K) and their respective proportions xE of doping elements taken from the phase diagrams or melting curves of binary alloys Cs1-xRbx, Au1-xCux, Cu1-xNix and Cr1-xCsx calculated using the present theory are presented in Table 2, where the results for Cs1-xRbx and Cu1-xNix are found to be in good agreement with experiment [4].
Table 2. Comparison to experiment [4] of the eutectic melting temperatures TE (K) and their respective proportions xE of doping elements taken from phase diagrams of binary alloys Cs1-xRbx, Cu1-xAux, Cu1-xNix and Cr1-xCsx calculated using the present theory.
Note that the melting temperatures taken from the phase diagrams or melting curves calculated using the present theory when the whole elementary cell is occupied either by the host element or by the doping element in the considered binary alloys presented in the above Figures agree well with the experimental melting temperatures [3] of these constituent elements.
4. Conclusions
In this work, a theory for the calculation and analysis of the phase diagrams or melting curves providing information on Lindemann melting temperatures and eutectic point of binary alloys has been derived based on the Lindemann criterion. The advantage of this theory is that it provides meting temperatures of binary alloys with respect to any proportion of their constituent elements.
The calculated phase diagram or melting curve shows the rate that the atoms of binary alloys become either more tightly or more weakly bonded (the host element becomes either harder or softer) after the host element was mixed by the doping element to be a binary alloy. This property may be useful for technological applications.
The good and reasonable agreement of the phase diagrams or melting curves of binary alloys Cu1-xNix and Cs1-xRbx calculated using the present theory, as well as of the Lindeman melting temperatures and eutectic points obtained from these phase diagrams with experiment illustrate the simplicity and efficiencies of the present theory in studying the melting temperatures of binary alloys.
Acknowledgments
The authors thank Prof. J. J. Rehr and Prof. P. Fornasini for useful comments.
References
- Gillvarry J. J. The Lindemann and Gruneisen laws. Phys. Rev. 1956, 102, 308-316.
- Ross Marvin. Generalized Lindemann melting law. Phys. Rev. 1969, 184(1), 233.
- Kittel Charles. Introduction to Solid State Physics. 7th Edition (Wiley&Son, New York, 1996).
- Massalski T. B. Binary Alloy Phase Diagrams, 2nd edition (ASM International Materials Parks, OH, 1990).
- Machon Denis, Toledano Pierre, Krexner Gehard.Phenomenlogical theory of phase diagrams of binary eutectic systems. Phys.Rev. B 2005,71, 024110.
- Alfe D., Vocadlo L., Price G. D., Gillan M. J. Melting curve of materials: Theory versus experiments. J. Phys.: Condens. Matter 2004, 16, S973-S982.
- Kierfeld Jan and Vinokur Valerii. Lindemann criterion and vortex lattice phase transitions in type-II superconductors. Phys. Rev. B 2004, 69, 024501.
- Zhou Yaoqi, Karplus Martin, Ball Keith D., Berry R. Stephen. The distance fluctuation criterion for melting: Comparison of square-well and Morse potential models for cluster and homopolymers. J. Chem. Phys. 2002, 116, 2323.
- Chakravarty Charutsita, Debenedetti Pablo G., Stilinger Frank H. Lindemann measures for the solid-liquid phase transition. J. Chem. Phys. 2007, 126, 204508.
- Ziman J. M.Principles of the Theory of Solids. CambrigeUniversity Press, London, 1972.
- Hung N. V. and Rehr J. J. Anharmonic correlated Einstein model Debye-Waller factors. Phys. Rev. B 1997, 56, 43.
- Daniel M., Pease D. M., Hung N. V., Budnick J. D. Local force constants of transition metal dopants in a nickel host: Comparison to Mossbauer studies. Phys. Rev. B 2004, 68, 134414.
- Hung N. V. and Fornasini P. Anharmonic effective potential, correlation effects, and EXAFS cumulants calculated from a Morse interaction potential for fcc metals. Phys. Soc. Jpn. 2007, 76, 084601.
- Hung N. V., Tien T. S., Duc N. B., Vuong D. Q. High-order expanded Debye-Waller factors of hcp crystals based on classical correlated Einstein model. Mod. Phys. Lett.B 2014, 28, 1450174.
- Trung N. B.; Hung N. V.; Khoa H. D.Temperature dependence of high-order expanded anharmonic correlated Debye model Debye-Waller factor of metallic Copper. Int. J. Adv. Mater. Research. 2016, 2(4), 52-58.


