International Journal of Advanced Materials Research, Vol. 1, No. 3, July 2015 Publish Date: Jul. 28, 2015 Pages: 113-119
Characterization of Some Nigerian Local Clays for Electrical Porcelain Applications
J. E. O. Ovri*, C. Onuoha
Department of Materials and Metallurgical Engineering, Federal University of Technology, Owerri, Imo state, Nigeria
Abstract
Clays from Ibere and Awo-omama were characterized for electrical porcelain application. Test samples were made by varying the compositions of feldspar and quartz required to form mouldable plastic bodies with each clay. The following properties were determined: electrical resistivity, apparent porosity, water absorption and linear shrinkage. This characterization was carried out for both the locally made porcelains and the Power Holding Company of Nigeria (PHCN) (standard) porcelain. Results obtained showed that, for both clays, apparent porosity, water absorption and electrical resistivity increased with increase in the composition of the non-plastic materials (feldspar and quartz) while linear shrinkage decrease with increase in non-plastic materials. Also, for both clays, samples containing 50-70% clays, 20-30% feldspar and 10-20% quartz were found to yield results that compared well with results found in the literature as well as results obtained for PHCN (Standard) porcelain. It is therefore concluded that both clays are suitable for electrical porcelain application.
Keywords
Porcelain, Characterization, Clay, Feldspar, Quartz, Electrical Resistivity
Received: April 8, 2015
Accepted: July 11, 2015
Published online: July 27, 2015
@ 2015 The Authors. Published by American Institute of Science. This Open Access article is under the CC BY-NC license. http://creativecommons.org/licenses/by-nc/4.0/
Contents
1. Introduction 2. Materials and Methods 2.1. Materials 2.2. Sourcing of Materials 2.3. Porcelain Production 2.4. Characterization 3. Experimental Results 4. Discussion of Experimental Results 4.1. Chemical Composition 4.2. Linear Shrinkage 4.3. Apparent Porosity 4.4. Water Absorption 4.5. Electrical Resistivity 5. Conclusions Acknowledgement
1. Introduction
The term porcelain refers to a wide range of ceramic products that have been fired at high temperature to achieve vitreous or glassy qualities such as translucence and low porosity. Porcelains are vitrified and fine grained ceramic white wares, used either glazed or unglazed. They are widely used in household, laboratory and industrial applications. For technical purposes, porcelain products are designated as electrical, chemical, mechanical, structural and thermal wares 1,2.
The primary components of electrical porcelain are clays, feldspar and flint (quartz or silica), all characterized by small particle sizes. The clay gives plasticity to the ceramic mixtures while flint or quart maintains the shape of the formed article during firing and feldspar serves as flux, which is added to decrease firing temperature and thus to reduce cost by saving fuel (energy)3,4.
Electrical porcelains are widely used as insulators in electrical power transmission system due to the high stability of their electrical, mechanical and thermal properties in the presence of harsh environments5. These are some of the reasons for their continued use over the centuries despite the emergence of new materials like plastics and composites. They form a large base of the commonly used ceramic insulators for both low and high tension insulation. They are considered to be one of the most complex ceramic systems6.By varying the proportions of the three main ingredients (clay, feldspar and quartz), it is possible to emphasize the thermal, dielectric or mechanical properties of the porcelain. For electrical insulation applications, porcelains are expected to meet minimum specification of the latter two, dielectric and mechanical properties 2,7.
The porcelain need of Nigeria – a developing industrial nation-is potentially enormous, especially in realization of present government`s 7-point agenda which include rural electrification .The country expends a lot of foreign exchange importing porcelain. Yet, a lot of clay deposit abounds in the country, which can be developed to meet our local needs 8.
The possibility of developing some of these mineral resources for the production of porcelain locally is the focus of this research.
2. Materials and Methods
2.1. Materials
The materials and equipment used for this research include a hoe or spade, raw (as-minded clay), an AAS, pan mill, ATMS sieves, hydraulic moulding press, electric furnace and oven, electric water heater, digital weighing balance, drying cloth, strong thread or fine cord, multimeter, spring balance and x-ray diffractometer.
2.2. Sourcing of Materials
Awo–omama clay was sourced from Umuejike deposit, Awo-omama in Oru East Local Government Area of Imo State, Nigeria. Ibere clay sources from Umulu deposit, Ibere, Ikwuano Local Government Area, Abia State, while feldspar and quartz were bought from a dealer at Umuahia, Abia State. Their chemical compositions are given in Table 1.
Table 1. Chemical Composition of Raw Materials (AAS).
| Composition (%) | Awo-Omama | Ibere | Feldspar | Quartz |
| SiO2 | 53.54 | 43.94 | 63.40 | 97.42 |
| Al2O3 | 27.75 | 26.54 | 17.32 | 0.15 |
| Fe2O3 | 0.92 | 0.48 | 0.83 | 0.46 |
| MgO | 0.93 | 1.61 | 0.24 | - |
| CaO | 1.35 | 3.37 | 0.42 | - |
| Na2O | 0.16 | 0.28 | 1.75 | - |
| K2O | 0.57 | 0.77 | 14.86 | - |
| LOI (H2O) | 11.20 | 16.00 | 0.51 | 0.42 |
LOI=Lost On Ignition
2.3. Porcelain Production
The production procedure followed in this work includes sample preparation, moulding (pressing), drying and firing. This is shown in Figure 1.
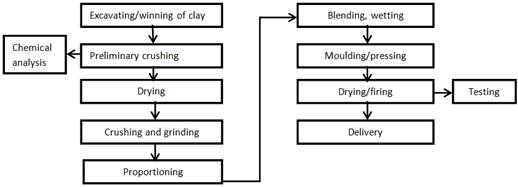
Fig. 1. Flow diagram for porcelain production.
Porcelain bodies were formulated by varying the composition of the plastic (Clay) and the non-plastic (feldspar and quartz) materials. The blending was done as given in Table 2.
Table 2. Porcelain Body Formulations.
| Sample | Clay (%) | Feldspar (%) | Quartz (%) |
| 0 | 100 | 0 | 0 |
| 1 | 90 | 5 | 5 |
| 2 | 80 | 15 | 5 |
| 3 | 70 | 20 | 10 |
| 4 | 60 | 25 | 15 |
| 5 | 50 | 30 | 20 |
| 6 | 50 | 25 | 25 |
| 7 | 50 | 20 | 30 |
| 8 | 50 | 15 | 35 |
| 9 | 50 | 35 | 15 |
The pressing was carried out using a Buehler Hydraulic press. The mould used measured 32mm internal diameter. A required quantity of plastic moulding mass was put into the mould and compressed under a pressure of 2.5MPa and thereafter extruded and dried.
The green samples were all fired in the same heating sequence for 8 hours 30 minute as follows:
At the rate of 1500C/hr to the temperature of 1,2000C, followed by soaking at 1,2000C for 15 minutes and subsequent cooling to ambient temperature.
2.4. Characterization
2.4.1. Linear Shrinkage Measurement
The green and fired dimensions were noted using a vernier caliper. Linear shrinkage for each sample was computed as a percentage of the original green dimension; using the equation:
L.S. = ![]() (1)
(1)
Where ∆L =change in length
L = original length
2.4.2. Apparent Porosity and Water Absorption Measurement
These were determined in one and same test in accordance with ASTM C 20- 80a9. The samples were oven – dried over 12 hours at 1050C in preparation for the test. They were taken directly from the oven for the test. The dry weight in air (Wda) was measured using a spring balance, after which the samples were transferred into and suspended in a vessel of boiling water for 1hr. After boiling, the specimens were left to cool to room temperature measured while still immersed in the water. After a day, the weight in water (Wsw) was measured. Each specimen was removed from the water and the surface gently cleaned with a damp cloth, and it was weighed in air to determine the saturated weight (Wsa).
The apparent porosity, AP, of each sample was calculated using the following relation:
![]() (2)
(2)
The water absorption, Aw, of each specimen was calculated using the results of the same text via relation:
![]() (3)
(3)
2.4.3. Determination of Electrical Resistivity
The electrical resistivity, ℓ, was also determined. This was done using a multimeter (Fluke-27 Multimeter). The multimeter measures directly resistances ranging from 0Ω to 200MΩ and so could not give direct resistance values of readings for the samples because of the very high resistance values of insulators. Therefore, the multimeter was re-set to the conductance mode to get direct readings. The resistances and hence resistivities of the samples were thus calculated using the following relations:
![]() (4)
(4)
Thus, resistance was therefore calculated as the inverse conductance (G), and resistivity was therefore calculated from the resistance value using the relation:
![]() (5)
(5)
Where
R = resistance (Ω)
G = Conductance (S)
ℓ = resistivity (Ω-m)
A = area (mm2)
L = length (mm).
3. Experimental Results
The results of the characterization of the clays are given in Tables 3 to 7 and displayed in figures 2 to7.
Table 3. Linear shrinkage results.
| Description | Awo-Omama | Ibere | ||||
| Lg (mm) | Lf (mm) | L.S (%) | Lg (mm) | Lf (mm) | L.S (%) | |
| 0 | 42.00 | 36.00 | 14.29 | 34.00 | 29.00 | 14.71 |
| 1 | 39.45 | 34.30 | 13.05 | 35.70 | 31.00 | 13.17 |
| 2 | 36.00 | 32.00 | 11.11 | 32.10 | 28.20 | 12.15 |
| 3 | 37.46 | 34.00 | 9.24 | 31.00 | 28.00 | 9.68 |
| 4 | 39.83 | 36.50 | 8.36 | 36.00 | 33.00 | 8.33 |
| 5 | 39.80 | 36.90 | 7.29 | 35.00 | 33.20 | 5.14 |
Note: Lg = green length ; Lf = fired length; L.S. = Linear Shrinkage = ![]()
Table 4. Apparent Porosity Results.
| Sample | Variable | Awo-Omama | Ibere |
| 0 | Wda(g) | 42.00 | 37.00 |
| Wsw(g) | 22.40 | 20.50 | |
| Wsa(g) | 43.90 | 39.00 | |
| AP(%) | 8.84 | 10.81 | |
| 1 | Wda(g) | 39.70 | 41.00 |
| Wsw(g) | 22.00 | 21.00 | |
| Wsa(g) | 42.00 | 43.60 | |
| AP(%) | 14.00 | 11.50 | |
| 2 | Wda(g) | 43.70 | 40.20 |
| Wsw(g) | 24.00 | 20.21 | |
| Wsa(g) | 47.00 | 43.00 | |
| AP(%) | 14.35 | 12.20 | |
| 3 | Wda(g) | 43.50 | 42.00 |
| Wsw(g) | 24.20 | 20.50 | |
| Wsa(g) | 47.40 | 45.50 | |
| AP(%) | 16.81 | 14.00 | |
| 4 | Wda(g) | 43.00 | 41.70 |
| Wsw(g) | 24.70 | 20.80 | |
| Wsa(g) | 47.80 | 45.80 | |
| AP(%) | 19.90 | 16.40 | |
| 5 | Wda(g) | 42.80 | 41.50 |
| Wsw(g) | 23.00 | 20.00 | |
| Wsa(g) | 48.00 | 46.00 | |
| AP(%) | 20.80 | 17.30 |
Table 5. Water Absorption Results.
| Sample | Variable | Awo-Omama | Ibere |
| 0 | Wda(g) | 42.00 | 37.00 |
| Wsw(g) | 22.40 | 20.50 | |
| Wsa(g) | 43.90 | 39.00 | |
| Aw(%) | 4.52 | 5.41 | |
| 1 | Wda(g) | 39.70 | 41.00 |
| Wsw(g) | 22.00 | 21.00 | |
| Wsa(g) | 42.00 | 43.60 | |
| Aw(%) | 7.14 | 6.34 | |
| 2 | Wda(g) | 43.70 | 40.20 |
| Wsw(g) | 24.00 | 20.21 | |
| Wsa(g) | 47.00 | 43.00 | |
| Aw(%) | 7.55 | 7.00 | |
| 3 | Wda(g) | 43.50 | 42.00 |
| Wsw(g) | 24.20 | 20.50 | |
| Wsa(g) | 47.40 | 45.50 | |
| Aw(%) | 8.97 | 8.33 | |
| 4 | Wda(g) | 43.00 | 41.70 |
| Wsw(g) | 24.70 | 20.80 | |
| Wsa(g) | 47.80 | 45.80 | |
| Aw(%) | 11.16 | 9.83 | |
| 5 | Wda(g) | 42.80 | 41.50 |
| Wsw(g) | 23.00 | 20.00 | |
| Wsa(g) | 48.00 | 46.00 | |
| Aw(%) | 12.15 | 10.84 |
Table 6. Electrical Resistivity Results.
| Sample | Variables | Awo-Omama | Ibere |
| 0 | Area (m2) | 0.000491 | 0.000577 |
| Length (mm) | 36.00 | 29.00 | |
| Conductance, G (nS) | 1.90 | 2.52 | |
| Resistance, R (MΩ) | 526.3157 | 396.8253 | |
| Resistivity, ℓ (Ω-m x 107) | 0.613 | 0.790 | |
| 1 | Area (m2) | 0.0005311 | 0.0005813 |
| Length (mm) | 34.30 | 31.00 | |
| Conductance, G (nS) | 1.75 | 1.48 | |
| Resistance, R (MΩ) | 571.4285 | 675.6756 | |
| Resistivity, ℓ (Ω-m x 107) | 0.885 | 1.267 | |
| 2 | Area (m2) | 0.0006382 | 0.0006327 |
| Length (mm) | 32.00 | 28.20 | |
| Conductance, G (nS) | 1.83 | 1.92 | |
| Resistance, R (MΩ) | 546.4480 | 520.8333 | |
| Resistivity, ℓ (Ω-m x 107) | 1.090 | 1.187 | |
| 3 | Area (m2) | 0.0006427 | 0.0006838 |
| Length (mm) | 34.00 | 28.00 | |
| Conductance, G (nS) | 2.00 | 2.10 | |
| Resistance, R (MΩ) | 500.0000 | 476.1904 | |
| Resistivity, ℓ (Ω-m x 107) | 0.945 | 1.203 | |
| 4 | Area (m2) | 0.0007071 | 0.0007071 |
| Length (mm) | 36.50 | 33.00 | |
| Conductance, G (nS) | 1.67 | 2.30 | |
| Resistance, R (MΩ) | 598.8023 | 434.7826 | |
| Resistivity, ℓ (Ω-m x 107) | 1.160 | 0.932 | |
| 5 | Area (m2) | 0.0007071 | 0.0007071 |
| Length (mm) | 36.90 | 33.20 | |
| Conductance, G (nS) | 1.82 | 1.53 | |
| Resistance, R (MΩ) | 549.4505 | 653.5946 | |
| Resistivity, ℓ (Ω-m x 107) | 1.053 | 1.392 |
Table 7. Properties of PHCN Porcelain.
| Wda(g) | 42.60 |
| Wsw(g) | 24.30 |
| Wsa(g) | 46.20 |
| AP(%) | 16.43 |
| Aw(%) | 8.43 |
| Area (m2) | 0.0011 |
| Length (mm) | 0.076 |
| Conductance, G (nS) | 3.2 |
| Resistance, R (MΩ) | 312.5 |
| Resistivity, ℓ (Ω-m x 107) | 0.4523 |
4. Discussion of Experimental Results
4.1. Chemical Composition
In general, the chemical composition of the clays (Awo-omama: 53.54%SiO2, 27. 75% Al2O3 and Ibere: 43.94%SiO2, 26.54%Al2O3) are in qualitative agreement with the results reported by Chester10 who had a range of values of 46-62%SiO2, 25-39% Al2O3 and Grimshaw11 who had values of 40-60%SiO2, and 25-45%AI2O3 for these refractories materials.
4.2. Linear Shrinkage
It could be observed that, for the clays studied, the highest linear shrinkage was recorded for 100% clay (Figure 2). This is due to the high plasticity of the clays. As inert materials were progressively incorporated, the shrinkage decreased progressively. This signifies that addition of non-plastic materials results to decrease in plasticity and hence linear shrinkage. This is in agreement with Kingery7, who reported a reduction in both linear and volume shrinkage with the addition of grot or flint to clay.
The linear shrinkage values obtained for Awo-omama clay (7.27–9.24%) and Ibere (8.33-9.68%) compared favourably with the values of 7 – 10% reported by Chester10. These values were recorded for samples 3, 4 and 5 whose compositions range from 50-70% clay, 20-30% feldspar and 10-20% quartz.
Recommended linear shrinkage is necessary to ensure dimensional stability of the product Kingery12,13.
4.3. Apparent Porosity
Apparent porosity increased with increase in the non-plastic materials, with those of Awo–omama clay being more significant (Figure 3). This is based on the fact that the non-plastic materials increased the total silica and alumina contents of the clays leading to a reduction in the plasticity of the clay which in turn results to increase in their apparent porosity.
Apparent porosity values recorded for the clays (Awo-omama: 16.81 – 20.80% and Ibere: 14.00-17.30%) are in agreement with the values obtained for PHCN porcelain (16.82%).
4.4. Water Absorption
Similarly, water absorption capacity increased progressively as more non-plastic material was incorporated (Figure 4). As said earlier, this results to increase in apparent porosity which in turn results to the existence of more pore spaces, thereby facilitating water absorption when the article is exposed to moisture.
Again, water absorption values obtained for the Clays (Awo-omama: 8.97%-12.15%; Ibere:8.33-10.84%) are in conformity with value obtained for PHCN porcelain (standard) (8.20%). For electrical application, porcelains should have very low water absorption capacity because the presence of water reduces the electrical resistance of the product. As stated earlier, porosity, which is necessary in electrical porcelains, increases water absorption capacity, which is not necessarily beneficial. In order to obtain the needed porosity for optimum electrical resistance with little or no water absorption capacity, electrical porcelains are usually glazed.

Fig. 2. Linear shrinkage as a function of total non-plastic content.

Fig. 3. Apparent Porosity as a function of total non-plastic content.

Fig. 4. Water Absorption as a function of total non-plastic content.

Fig. 5. Electrical Resistivity as a function of Total non-plastic content.

Fig. 6. Summary of Properties of porcelain formulations for Awo-omama.

Fig. 7. Summary of Properties of porcelain formulations for Ibere.
4.5. Electrical Resistivity
The electrical resistivity increased progressively as the composition of the non-plastic material increased. This is due to the highly porous nature of the porcelain product (Figure 5).
Electrical resistivities recorded for the clays (Awo–omama: 0.61-1.05 x10⁷Ω-m: Ibere: 0.79-1.39 x 10⁷Ω-m) are in agreement with the value obtained for PHCN porcelain (0.45 x 10⁷Ω-m) and those reported by Khanna14 who had a range of values of 104Ω-m - 1018Ω-m. A summary of the properties of porcelain formulations for Awo-omama are given in Figure 6 while those for Ibere are in Figure 7. The value obtained in this investigation are within the reported values for the standard (PHCN) and others. The higher the electrical resistivity, the better the porcelain. Hence, porcelain pin insulators made from these local clays yielded higher electrical resistivities and are better than those of the imported PHCNs.
5. Conclusions
The investigation has shown that results obtained for locally made porcelain insulators consisting 50-70% clay, 20-30% feldspar and 10-20% quartz compared well with results of both previous works and the PHCN porcelain. Therefore, it is possible to replace PHCN porcelain with porcelain insulators made from the local clays investigated provided the recommended compositional specifications are followed.
Acknowledgement
We are indebted to the communities where these clay deposits are located, for allowing us collect as much quantity as was needed. We acknowledge the assistance of Erosion Control Centre, Materials Engineering Laboratory and Physics Department of Federal University of Technology, Owerri; Central Laboratory of National Root Crop Research Institute, Umudike and Advanced Physics Laboratory of Sheda Science and Technology Centre (SHESTCO), Abuja.
References
- Rado, P.(1969). An Introduction to the Technology of Pottery, First Edition Oxford: Pergamon.
- Barsoum, M. W. (1997), Fundamentals of Ceramics New York: McGraw-Hill pp. 8, 9, 74-79.
- Olupot, P.W. (2006), Assessment of Ceramic Raw Materials in Uganda for Electrical Porcelain. Licentiate Thesis in Materials Science, Department of Material Science and Engineering, Royal Institute of Technology (KTH) Stockholm, Sweden.
- Brady, G. S and CLAUSER, H. R (eds.) (1979), Materials Handbook New York: McGraw-Hill Pp. 410-411
- Dana, K., DAS, S. (2004), Effect of Substitution of Fly Ash for quartz in Triaxial Kaolin-quartz-feldpar System’’. Journal of the European Ceramic Society 24, Pp. 3169-3175.
- Reed, J.S. (1988). Introduction to the Principles of Ceramic Processing New York: John Wiley. Chapters 3,5-7,13,16.
- McKelvery,V.E.1986),Mineral Resources: Definitions, Uses, Classification and Future Availability in Bever, M.B (ed.), Encyclopaedia of Materials Science and Engineering, vol. 4.Pp 3073-81.
- MSMDNG.COM (2005) Federal Ministry of Solid Minerals Development profile of Solid Minerals Deposits in Nigeria[ On-line ], Available: (http://www.msmdng.com)
- Annual Book of ASTM Standards, (1982) (20-80a) part 17: Refractories, Glass, Ceramic Materials, Carbon and Graphite Products Philadelphia: ASTM. PP. 7-9, 18, 51-55, 59-61, 190-93, 498-510.
- Chester, J. H (1973), Refractories, Production and Properties The Iron and Steel Institute, London, pp. 4-13,295-315
- Grimshaw, R. W (1971), The Chemistry and Physics of Clay and Allied Ceramic Materials, 4th Edition Revised New York: Wiley Interscience, p. 15
- Kingery, W.D. (1967), Introduction to Ceramics. John Wiley and Sons Inc.; New York.
- Ovri, J.E.O (1997), Sintering and Mechanical Strength of a Nigerian Clay: Journal Engineering Research No. 2, Pp. 53-64.
- Khanna, O.P. (2001), Mat. Sci. and Met. Rev. and Enlarg. Edit., Dhamput RAI Publs (P) Ltd. New Delhi,Pp161-163.


