
International Journal of Advanced Materials Research, Vol. 1, No. 3, July 2015 Publish Date: Jun. 6, 2015 Pages: 86-94
Parametric Optimization of End Milling of Al/SiCp Composites Using Nsga-II
R. Arokiadass*
Department of Mechanical Engineering, St. Anne’s College of Engineering and Technology, Tamilnadu, India
Abstract
This experimental work presents a technique to determine the better surface quality by controlling the flank wear and surface roughness of Al/SiCp composites using TiN coated solid carbide end mill cutters. In machining operations, achieving desired surface quality features of the machined product is really a challenging job. Because, these quality features are highly correlated and are expected to be influenced directly or indirectly by the direct effect of process parameters or their interactive effects. Thus the four input process parameters such as spindle speed, feed rate, depth of cut and content of silicon carbide have been selected to minimize the flank wear and surface roughness simultaneously by using the central composite design (CCD) using Response surface methodology (RSM). Mathematical models for flank wear and surface roughness were obtained to predict values of VBmax and Ra and. ANOVA analyses were also performed to obtain for significant parameters influencing flank wear and surface roughness. The Non-dominated Sorting Genetic Algorithm (NSGA-II) tool was used to optimize the end milling process parameters to minimize VBmax and Ra. A non-dominated solution set has been obtained and reported.
Keywords
Received: March 30, 2015
Accepted: May 6, 2015
Published online: June 3, 2015
@ 2015 The Authors. Published by American Institute of Science. This Open Access article is under the CC BY-NC license. http://creativecommons.org/licenses/by-nc/4.0/
1. Introduction
Metal matrix composites (MMC) are a relatively new class of materials characterized by lighter weight and greater strength and wear resistance than those of conventional materials. Due to their superior strength and stiffness, MMCs have good potential for application in the automotive and aerospace industries [1–3]. One factor that prevents more manufacturers from embracing MMC technology is the difficulty of machining these materials. The machining of MMCs is very difficult due to the highly abrasive and intermittent nature of the reinforcements and it brings many undesirable results such as rapid tool wear, a rough surface finish on finished components.
The end milling process is one of the most fundamental metal removal operations used in the manufacturing industry because of its ability to remove material faster and giving reasonably good surface quality [4]. It is used in a variety of manufacturing industries including aerospace and automotive sectors, where quality is an important factor in the production of slots, pockets, precision moulds and dies. Greater attention is given to dimensional accuracy and surface roughness of products by the industry these days. Moreover, surface finish influences mechanical properties such as fatigue behaviour, wear, corrosion, lubrication and electrical conductivity. Thus, measuring and characterizing surface finish can be considered for predicting machining performance [5].
Many researchers have studied the end milling process in the past few years. Kumar Reddy et al. [6] studied quality of components produced during end milling of Al/SiC particulate metal matrix composites (PMMCs). The results showed that the presence of the reinforcement enhances the machinability in terms of both surface roughness and lower tendency to clog the cutting tool, when compared to a non-reinforced Al alloy. These results would serve to understand that the end milling machining process can provide better inputs to ensure better machining of Al/SiC PMMC and are expected to lead technological and economical gains with the use of Al/SiC PMMC in various industrial applications by replacing Al alloys.
Tamer Ozben et al.[7]investigated the mechanical properties and the effects of machining parameters on tool wear and surface roughness of silicon carbide particulate (SiCp) reinforced aluminum MMC for different volume fraction. It was observed that the increase in reinforcement addition produced better mechanical properties such as impact toughness and hardness. The machinability properties of the selected material were studied and higher SiCp reinforcement produced a higher tool wear. The surface roughness was generally affected by feed rate and cutting speed.
Sahin [8] studied the effect of different particle sizes of SiC and machinability properties of these Al-MMC materials. It was noticed that the hardness and density of Al-MMC increased by addition of SiC-p. Alauddin et al. [9] established a mathematical model that predicts the surface roughness of 190 BHN steel after end milling. The prediction model was expressed via cutting speed, feed rate and depth of cut. The researchers also used response surface methodology (RSM) to explore the effect of such cutting parameters as cutting speed, feed rate and depth of cut on surface roughness.
Fuh and Hwang [10] used RSM to construct a model that can predict the milling force in end milling operations. They considered the speed of spindle rotation, feed per tooth and axial and radial depth of cut as the three major factors that affect the milling force. Comparison between the experimental data and the values predicted by this prediction model showed the model accuracy to be as high as 95%.
However, for the practical machining of Al/SiCp, optimal process parameters must be determined to achieve less tool wear, good surface finish, etc. This paper discusses the application of the Non-dominated Sorting Genetic Algorithm (NSGA-II) to optimize the machining parameters for machining Al/SiCp composites with multiple characteristics.
The principles of multiple performance optimization differ from those of single performance optimization. In multi performance optimization, there is more than one objective function, each of which may have a different optimal solution. Most of the time these objectives conflict with one another (i.e., optimizing one objective compromises the other objectives) [11,12].In the present study optimization techniques are required to identify the optimal combination of parameters for minimizing the tool flank wear and minimizing the surface roughness in end milling process. Quite a few researchers have tried to optimize the machining performance by adopting different optimization techniques.
Ghani [13] used Taguchi optimization methodology to optimize cutting parameters while end milling AISI H13 steel with TiN coated P10 carbide insert under dry cutting condition. The milling parameters to be optimization were cutting speed, feed rate and depth of cut. The results of the study showed that low resultant forces and a good surface finish can be obtained when using a high speed, a low feed and a low depth of cut. Suresh et al. [14] adopted a two stage approach towards optimizing for surface roughness. Experimental results were used to build two mathematical models for surface roughness by a regression method according to RSM. The second-order mathematical model obtained was then taken as an objective function and optimized with a GA to obtain the machining conditions for a desired surface finish. Karthikeyan et al developed a polynomial model for the various EDM characteristics such as metal removal rate, tool wear rate and surface roughness in terms of the process parameters such as volume fraction of SiC, current and pulse time. The models were used to optimize the EDM characteristics using non-linear goal programming [15].
In single objective optimization, one attempts to obtain the best design or decision, which is usually the global minimum or maximum depending on the optimization problem. In the case of multiple objectives, there may be one solution, which is the best with respect to all objectives. In end milling process, it is difficult to find a single optimal combination of parameters for both tool flank wear and surface roughness as the parameters influence them differently. Hence, there is a need for a multi-objective optimization method to arrive at the solutions to this problem.
The main purpose of this work is to study the intervening variables in end milling of LM25 Al reinforced with various percentage weight of SiCp (5, 10, 15, 20 and 25) on flank wear (VBmax), and surface roughness (Ra) using TiN coated solid carbide end mill cutters. Owing to a great number of variables and a variety of products, optimal machining performance is rarely achieved. It is necessary to investigate how the erosion parameters affect the machining process. The results will provide significant information to achieve optimal performance in the process [16]. This paper discusses the application of the non-dominated sorting genetic algorithm (NSGA-II) to optimize the machining parameters for end milling of composites with multiple characteristics. The principles of multiple performance optimizations differ from those of single-performance optimization. In multi-performance optimization, there is more than one objective function, each of which may have a different optimal solution. Most of the time these objectives conflict with one another (i.e. optimizing one objective compromises the other objectives) [11,12]. The genetic algorithm (GA) is an evolutionary algorithm. It is based on the mechanics of natural selection and it combines the characteristics of direct search and probabilistic selection methods. It is a very simple yet powerful tool for obtaining global optimum values for multi-model and combinatorial problems [15]. In a typical multi-objective optimization problem, there exists a set of solutions which are superior to the other solutions in the search space, when all objectives are considered, but which are inferior to other solutions in the space with respect to one or more objectives. These are known as Pareto optimal solutions or non-dominated solutions. Since none of the solution in the non-dominated set is absolutely better than any other, any one of them is an acceptable solution [11]. The experiments were designed using response surface methodology (RSM). The process parameters: spindle speed, feed rate, depth of cut and content of silicon carbide were optimized with multiple response characteristics including flank wear (VBmax) and surface roughness (Ra). Models were developed for VBmax and Ra. These models were used for optimization by which the optimum parameter settings were obtained with a view to minimizing VBmax and minimizing Ra. The NSGA-II algorithm was used to optimize the end milling process parameters. The method presented here may be useful in a machine and/or manufacturing shop.
2. Experimental Work
The work material used for the present investigation is LM 25 Al reinforced with various percentage weight of SiCp (5, 10, 15, 20 and 25) of 25µm particle size manufactured through stir-casting route. Microscopic examinations of the specimens were carried out using a scanning electron microscope (SEM). The typical microstructures of the LM25Al alloy with different percentage weight of SiCp composites are shown in Fig.1.
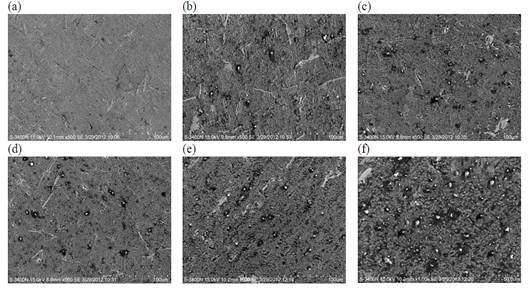
Fig. 1. SEM micrographs of LM 25 Al alloy reinforced with (a) LM25 Al alloy; (b) 5% SiC; (c) 10% SiC; (d) 15% SiC; (e) 20% SiC and (f) 25% SiC.
The size of the specimen used for machining is100mm×50mm×40mm. For machining operation a HASS CNC tool room mill was used and the tool material was TiN coated solid carbide end mill cutter having diameter of 12 mm, helix angle of 45°, rake angle of 10° and number of flutes 4. The machining parameters used and their levels were presented in Table1.
Table 1. Experimental parameters and their levels.
| Factor | Unit | Notation | Levels | ||||
| -2 | -1 | 0 | +1 | +2 | |||
| Spindle speed | rpm | N | 2000 | 2500 | 3000 | 3500 | 4000 |
| Feed rate | mm/rev | f | 0.02 | 0.03 | 0.04 | 0.05 | 0.06 |
| Depth of cut | mm | d | 0.5 | 1 | 1.5 | 2 | 2.5 |
| Content of SiCp | %wt. | S | 5 | 10 | 15 | 20 | 25 |
Experiments were conducted according to central composite second order rotatable design (CCD) as depicted in Table 2. In the present study, the machining performance was evaluated by the following responses.
Table 2. Experimental data according to central composite second order rotatable design.
| Exp.No. | Coded factors | Actual factors | Flank wear, VBmax (mm) | Surface roughness, Ra(µm) | ||||||
| X1 | X2 | X3 | X4 | N | f | d | S | |||
| 1 | -1 | -1 | -1 | -1 | 2500 | 0.03 | 1 | 10 | 0.174 | 3.924 |
| 2 | 1 | -1 | -1 | -1 | 3500 | 0.03 | 1 | 10 | 0.234 | 3.295 |
| 3 | -1 | 1 | -1 | -1 | 2500 | 0.05 | 1 | 10 | 0.212 | 4.427 |
| 4 | 1 | 1 | -1 | -1 | 3500 | 0.05 | 1 | 10 | 0.241 | 4.193 |
| 5 | -1 | -1 | 1 | -1 | 2500 | 0.03 | 2 | 10 | 0.185 | 3.891 |
| 6 | 1 | -1 | 1 | -1 | 3500 | 0.03 | 2 | 10 | 0.242 | 3.307 |
| 7 | -1 | 1 | 1 | -1 | 2500 | 0.05 | 2 | 10 | 0.22 | 4.228 |
| 8 | 1 | 1 | 1 | -1 | 3500 | 0.05 | 2 | 10 | 0.247 | 4.113 |
| 9 | -1 | -1 | -1 | 1 | 2500 | 0.03 | 1 | 20 | 0.174 | 3.924 |
| 10 | 1 | -1 | -1 | 1 | 3500 | 0.03 | 1 | 20 | 0.357 | 3.797 |
| 11 | -1 | 1 | -1 | 1 | 2500 | 0.05 | 1 | 20 | 0.327 | 4.648 |
| 12 | 1 | 1 | -1 | 1 | 3500 | 0.05 | 1 | 20 | 0.362 | 4.583 |
| 13 | -1 | -1 | 1 | 1 | 2500 | 0.03 | 2 | 20 | 0.308 | 4.342 |
| 14 | 1 | -1 | 1 | 1 | 3500 | 0.03 | 2 | 20 | 0.363 | 3.844 |
| 15 | -1 | 1 | 1 | 1 | 2500 | 0.05 | 2 | 20 | 0.334 | 4.697 |
| 16 | 1 | 1 | 1 | 1 | 3500 | 0.05 | 2 | 20 | 0.369 | 4.715 |
| 17 | -2 | 0 | 0 | 0 | 2000 | 0.04 | 1.5 | 15 | 0.208 | 4.752 |
| 18 | 2 | 0 | 0 | 0 | 4000 | 0.04 | 1.5 | 15 | 0.31 | 3.863 |
| 19 | 0 | -2 | 0 | 0 | 3000 | 0.02 | 1.5 | 15 | 0.261 | 3.242 |
| 20 | 0 | 2 | 0 | 0 | 3000 | 0.06 | 1.5 | 15 | 0.309 | 4.395 |
| 21 | 0 | 0 | -2 | 0 | 3000 | 0.04 | 0.5 | 15 | 0.259 | 4.274 |
| 22 | 0 | 0 | 2 | 0 | 3000 | 0.04 | 2.5 | 15 | 0.291 | 4.296 |
| 23 | 0 | 0 | 0 | -2 | 3000 | 0.04 | 1.5 | 5 | 0.178 | 3.387 |
| 24 | 0 | 0 | 0 | 2 | 3000 | 0.04 | 1.5 | 25 | 0.392 | 4.256 |
| 25 | 0 | 0 | 0 | 0 | 3000 | 0.04 | 1.5 | 15 | 0.269 | 4.253 |
| 26 | 0 | 0 | 0 | 0 | 3000 | 0.04 | 1.5 | 15 | 0.275 | 4.247 |
| 27 | 0 | 0 | 0 | 0 | 3000 | 0.04 | 1.5 | 15 | 0.278 | 4.371 |
| 28 | 0 | 0 | 0 | 0 | 3000 | 0.04 | 1.5 | 15 | 0.277 | 4.283 |
| 29 | 0 | 0 | 0 | 0 | 3000 | 0.04 | 1.5 | 15 | 0.271 | 4.281 |
| 30 | 0 | 0 | 0 | 0 | 3000 | 0.04 | 1.5 | 15 | 0.285 | 4.229 |
| 31 | 0 | 0 | 0 | 0 | 3000 | 0.04 | 1.5 | 15 | 0.267 | 4.249 |
2.1. Tool Flank Wear
Keeping tool wear to a minimum is an important criterion, since it will affect the part size and surface quality of products [19]. There are four general wear zones on a typical cutting tool viz: crater wear, flank wear, nose radius wear and notch wear. Among these, flank wear is the most important and gives an overall indication of the wear process. Flank wear produces wear lands on the side and end flanks of the tool because of the rubbing action of the machined surface, which has been considered in this work and measured using a toolmaker’s microscope.
2.2. Average Surface Roughness
Surface finish is another important aspect in the machining of composites. The average surface roughness (Ra), which is mostly used in industry, is taken up for the present study. The roughness was measured a number of times and averaged [20]. The surface roughness was measured with a sampling length of 10 mm. The average surface roughness was measured using a Talysurf tester. The experimental results are presented in Table 2.
3. Statistical Modeling
The statistical models based on the second-order polynomial equations were developed for VBmax and Ra using the experimental results and are given below:
![]() (1)
(1)
![]() (2)
(2)
4. Optimization
To optimize the process parameters in end milling of LM25 Al/SiCp composites, a non-dominated sorting genetic algorithm was used. The objective sets for the present study were as follows: 1) Minimization of the tool flank wear; 2) Minimization of average surface roughness.
The two-objective genetic algorithm optimization method used is a fast, elitist non-dominated sorting genetic algorithm (NSGA-II) developed by Deb et al [21]. This algorithm uses the elite-preserving operator, which favors the elites of a population by giving them an opportunity to be directly carried over to the next generation [22].
5. NSGA-II Algorithm
The non-dominated sorting genetic algorithm has been criticized for its high computational complexity, lack of elitism and its choice of the optimal parameter value for sharing parameter σ. The NSGA-II is a modified version, which has a better sorting algorithm, incorporates elitism and does not require the choosing of a sharing parameter a priori. There are two key concepts in NSGA-II: a fast non-dominated sorting of the population and a crowding distance.
5.1. Non-dominated Sort
The initialized population is sorted based on non-domination. The non-domination is an individual and is said to dominate another if its objective function is no worse than the other and at least in one of its objective functions is better than the other. The fast-sort algorithm is described as below [23].
Fast-non-dominated-sort (P)
For each individual p in main population P do the following
Initialize Sp = 0 this contains all the individuals, i.e., being dominated by p
Initialize np = 0 np is the number of individuals that dominate p
for each q∊P
if (p≺q)then if p dominates q then
Sp = Sp![]() {q} add q to set Sp
{q} add q to set Sp
else if (q≺p) then if q dominates p then
np = np+1 increment np
if np = 0 then p is a member of the first front
F1 = F1∪{p} Update the first front set by adding pto the front one. This is carried out or all individuals in main population P.
i=1 Initialize the front counter i to one(i=1). Following is carried out while the ithfront is non-empty Fi≠0
Q = 0 the set for storing the individuals for (i+1)thfront
for each p∈Fi for each individual p in Fi
for each q∈Sp modify each member from the set Sp
nq = nq−1 decrement nq by one
if nq = 0 then nq if is zero, q is a member of a list Q
Q = Q∪q
i = i+1 Increment the front counter by one
Fi = Q Current front is formed with all members of Q
5.2. Crowding Distance
In NSGA-II, in addition to the fitness value, a new parameter called "crowding distance" is calculated for each individual. The crowding distance is a measure of how close an individual to its neighbours. Crowding distance is assigned front wise: comparing the crowding distance between two individuals in a different front is meaningless. The basic idea behind the crowding distance is finding the Euclidean distance between each individual in a front based on their m objectives in m-dimensional hyperspace.
Initially, a random parent population of P0, of size Nis generated. The population is sorted based on non-domination level. Each solution is assigned a fitness level, and the best level is 1. Thus, minimization of fitness is assumed. Binary tournament selection, recombination and mutation operators are implemented to generate the child Q0, of size N. The procedure for the remaining generation (for t≥ 1) is as follows [20]:
Step 1: First a combined population (parent and offspring) Rt = Pt![]() Qt of size 2N is formed, which is sorted according to a fast non-domination procedure. This results in different non-dominated fronts F1, F2 etc;
Qt of size 2N is formed, which is sorted according to a fast non-domination procedure. This results in different non-dominated fronts F1, F2 etc;
Step 2: The new parent population Pt+1 is formed by adding solutions from the first front F1 and continuing until the size exceeds N;
Step 3: The solutions of the last accepted front are sorted according to a crowded comparison criterion (≥n) and the first N points are picked;
Step 4: The population Pt+1 of size N is constructed using the above method in which selection, crossover and mutation are used to create the new population Qt+1 of size N.
It is important to mention here that the non-dominated sorting in step 1 and the filling up of population Pt+1 can be performed together. Each time a non-dominated front is found, its size can be checked to see whether it can be included in the new population. If not, then no more sorting is needed. This will reduce the run time of the algorithm. This procedure is repeated for subsequent generations.
6. Discussion
The end milling characteristics of LM25Al/SiCp composites were studied. The second order polynomial models were developed for VBmax and Ra. The fit summary indicates that the quadratic model is statistically significant for analysis of VBmax. The value of R2 is over 99.37%, which indicates that the developed regression model is adequately significant at a 95% confidence level. It provides an excellent relationship between the process parameters and the VBmax. An analysis of variance (ANOVA) was performed for VBmax and the results are presented in Table 3.
Table 3. Test results of ANOVA.
| Source | Degree of freedom | Sum of squares | Mean sum of squares | F-value | P-value | ||||
| VBmax | Ra | VBmax | Ra | VBmax | Ra | VBmax | Ra | ||
| Linear | 4 | 0.096584 | 4.13710 | 0.000317 | 0.093795 | 8.13 | 17.75 | 0.001 | 0.000 |
| Square | 4 | 0.000966 | 0.58771 | 0.000242 | 0.146929 | 6.20 | 27.81 | 0.003 | 0.000 |
| Interaction | 6 | 0.000903 | 0.25414 | 0.000150 | 0.042356 | 3.86 | 8.02 | 0.014 | 0.000 |
| Lack of fit | 10 | 0.000396 | 0.07119 | 0.000040 | 0.007119 | 1.04 | 3.20 | ||
| Error | 6 | 0.000228 | 0.01336 | 0.000038 | 0.002226 | ||||
| Total | 30 | 0.099077 | 5.06350 | ||||||
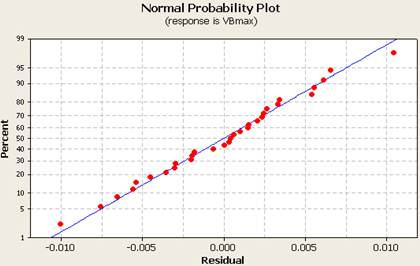
Fig. 2. Normal probability plot for Vbmax.
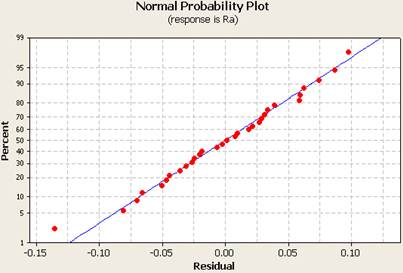
Fig. 3. Normal probability plot for Ra.
The normal probability plot for VBmax is presented in Fig.2. It can be noticed that the residuals fall on a straight line, which means that the errors are normally distributed and the regression model is well fitted with the observed values.
Similarly, the value of R2 for Ra is 98.33%, which means that the regression model provides an excellent explanation of the relationship between the independent variables (factors) and the response Ra. The associated P-value for the model is lower than 0.05 (i.e. level of significance α=0.05, or 95% confidence), which indicates that the model can be considered statistically significant. The ANOVA table for the quadratic model for Ra is presented in Table 3. Fig.3 displays the normal probability plot for Ra. It is observed that the residuals are distributed normally and in a straight line, and hence the model is adequate.
In the present work, a non-dominated sorting genetic algorithm, NSGA-II, was used to optimize multiple performances using the second-order models created. The NSGA-II algorithm ranked the individuals and also in Ref. [20]. The control parameters in NSGA-II were adjusted to obtain the best performance. The parameters used are: probability of crossover of 0.9 with distribution index of 20, mutation probability of 0.25 and population size of 100. It was found that the above control parameters produce better convergence and distribution of optimal solutions. The 1 000 generations were generated to obtain the true optimal solution. The non-dominated solution set obtained over the entire optimization is shown in Fig. 4. This figure
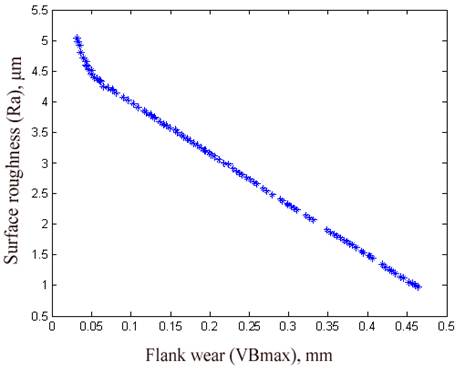
Fig. 4. Optimal chart obtained through NSG.
shows the formation of the Pareto front leading to the final set of solutions. 31 out of 100 sets were presented in Table 4. Since none of the solutions in the non-dominated set is absolutely better than any other, any one of them is the "better solution". As the best solution can be selected based on individual product requirements, therefore the process engineer must select the optimal solution from the set of available solutions. If the engineer desires to have a better surface finish, lower flank wear, a suitable combination of variables can be selected from Table 4. From the experimental results presented in Table 2, the parameters listed in the experiment number 19 lead to minimum Ra of 3.242 μm and the corresponding VBmax of 0.261mm, where the spindle speed, feed rate, depth of cut and content of silicon carbide are 3000 RPM, 0.02mm/rev, 1.5 mm and 15%wt. respectively. By using NSGA-II, the optimized Ra value very close to the experimental value has been selected from Table 4. For trail No. 29, the Ra value is 3.108 μm and the corresponding VBmax is 0.203mm, and the pertinent parameters are spindle speed, feed rate, depth of cut and content of silicon carbide, which are 3000.05 RPM, 0.02 mm/rev, 1.52mm and 14.70%wt., respectively. This indicates that the values obtained from the optimization technique are in close agreement with the experimental values and more or less for the same parameter settings.
Table 4. Optimal combinations of parameters for end milling process.
| Ex.no | Spindle speed, rpm | Feed rate, mm/rev | Depth of cut, mm | Content of SiCp, %wt. | VBmax, mm | Ra, µm |
| 1 | 3190.71 | 0.02 | 01.814 | 5.00 | 0.296 | 2.313 |
| 2 | 4000.00 | 0.02 | 0.520 | 5.02 | 0.462 | 0.933 |
| 3 | 2083.40 | 0.02 | 01.100 | 9.80 | 0.100 | 3.992 |
| 4 | 2453.54 | 0.02 | 0.900 | 12.40 | 0.176 | 3.353 |
| 5 | 2317.97 | 0.02 | 1.560 | 1.02 | 0.143 | 3.621 |
| 6 | 3370.46 | 0.02 | 14.800 | 5.00 | 0.334 | 1.991 |
| 7 | 3864.34 | 0.02 | 0.730 | 12.00 | 0.419 | 1.265 |
| 8 | 3606.53 | 0.02 | 1.010 | 5.00 | 0.378 | 1.629 |
| 9 | 3404.33 | 0.02 | 1.320 | 5.00 | 0.340 | 1.941 |
| 10 | 3587.40 | 0.02 | 1.390 | 5.04 | 0.371 | 1.679 |
| 11 | 3511.76 | 0.02 | 11.600 | 5.04 | 0.358 | 1.795 |
| 12 | 3896.76 | 0.02 | 10.400 | 5.01 | 0.426 | 1.236 |
| 13 | 3330.32 | 0.02 | 12.800 | 5.00 | 0.321 | 2.105 |
| 14 | 3700.76 | 0.02 | 2.060 | 5.04 | 0.392 | 1.505 |
| 15 | 3432.30 | 0.02 | 0.850 | 5.00 | 0.345 | 1.897 |
| 16 | 3668.26 | 0.02 | 1.720 | 5.00 | 0.386 | 1.546 |
| 17 | 2231.51 | 0.02 | 1.900 | 5.00 | 0.128 | 3.752 |
| 18 | 2768.04 | 0.02 | 1.150 | 6.01 | 0.223 | 2.943 |
| 19 | 2262.21 | 0.02 | 1.500 | 5.00 | 0.134 | 3.705 |
| 20 | 2870.31 | 0.02 | 1.590 | 6.05 | 0.241 | 2.785 |
| 21 | 3727.67 | 0.02 | 1.470 | 5.01 | 0.397 | 1.455 |
| 22 | 3490.82 | 0.02 | 1.700 | 5.04 | 0.354 | 1.827 |
| 23 | 2158.13 | 0.02 | 12.600 | 5.00 | 0.115 | 3.866 |
| 24 | 3959.32 | 0.02 | 0.670 | 5.02 | 0.438 | 1.103 |
| 25 | 2624.65 | 0.02 | 0.520 | 5.00 | 0.198 | 3.155 |
| 26 | 3581.01 | 0.02 | 0.800 | 5.00 | 0.372 | 1.668 |
| 27 | 2427.93 | 0.02 | 2.200 | 5.00 | 0.171 | 3.393 |
| 28 | 2589.93 | 0.02 | 1.900 | 5.00 | 0.191 | 3.211 |
| 29 | 3000.05 | 0.02 | 1.520 | 14.70 | 0.203 | 3.108 |
| 30 | 2356.41 | 0.02 | 1.090 | 5.00 | 0.151 | 3.559 |
| 31 | 2333.66 | 0.02 | 1.040 | 5.00 | 0.147 | 3.594 |
Table 5. Validation test results.
| Spindle speed (rpm) | Feed rate (mm/rev) | Depth of cut (mm) | Content of SiCp (%wt.) | VBmax, mm | Ra, µm | ||||
| Predicted | Actual | Error % | Predicted | Actual | Error % | ||||
| 3000.05 | 0.020 | 1.52 | 14.7 | 0.203 | 0.211 | 4 | 3.108 | 3.195 | 3 |
The verification of the test results under the selected optimum conditions for the cases of VBmax and Ra are shown in Table 5. The predicted machining performance is compared with the actual machining performance and a good agreement is obtained between their performance. From the analysis of Table 5, it can be observed that the calculated error is small. The error between the experimental and the predicted values for VBmax and Ra lie within 4% and 3%, respectively. Obviously, this confirms excellent reproducibility of the experimental conclusions.
7. Conclusions
1) The end milling process parameters were optimized by using non-dominated sorting genetic algorithm (NSGA-II), and a non-dominated solution set was obtained. The second order polynomial models developed for VBmax and Ra were used for optimization.
2) The choice of one solution over the other depends on the process engineer’s requirements. If the requirement is a lower Ra or lower VBmax, a suitable combination of variables can be selected.
3) The optimized value of Ra obtained through NSGA-II is 3.108 μm and the corresponding VBmax is0.203mm, and the pertinent parameters are spindle speed, feed rate, depth of cut and content of silicon carbide, which are 3000.05 rpm, 0.02 mm/rev, 1.520mm and14.7%wt., respectively.
4) Optimization will help to increase production rate considerably by reducing machining time. The objectives such as VBmax and Ra were optimized using amulti-objective optimization method, non-dominating sorting genetic algorithm-II. A Pareto-optimal set of 100solutions was obtained.
References
- Kennedy, F.E., Balbahadur, A.C. & Lashmore, D.S. (1997). The friction and wear of Cu-based silicon Carbide particulate metal matrix composites for brake applications. Wear, 203/204, pp.715- 721.
- Ravikiran, A. & Surappa, M.K. (1997). Effect of sliding speed on wear behaviour of A356 Al-30 wt.% SiCpMMC.Wear,Vol. 206, pp. 33-38.
- Allision, J.E. & Gole, G.S. (1993). Metal-matrix composites in the automotive industry: opportunities and challenges. J. Min. Met. Mater. Sci., Vol. 45(1), pp. 19–24.
- Lou, M. S. & Chen. J. C. (1999). In process surface roughness recognition system in end-milling operations. Int. J. Adv. Manuf. Technol., Vol.15, pp. 200-209.
- Suresh Kumar Reddy, N. & Venkateswara Rao, P. (2005). Selection of optimum tool geometry and cutting conditions using a surface roughness prediction model for end milling. Int. J. Adv. Manuf. Technol., Vol. 26, pp.1202–1210.
- Suresh Kumar Reddy, N., Shin, K.S. & Minyang,Y. (2008). Experimental study of surface integrity during end milling of Al/SiC particulate metal–matrix composites. J. Mater. Process. Technol., Vol. 201, pp.574–579.
- Ozben,T., Kilickap, E. & Cakır,O. (2008). Investigation of mechanical and machinability properties of SiC particle reinforced Al-MMC. J. Mater. Process. Technol., Vol. 198, pp.220–225.
- Sahin,Y. (2003). Preparation and some properties of SiC particle reinforced aluminium alloy composites. Mater. Des., Vol. 24–28, pp. 671–679.
- Alaudin, M., EI-Baradic, M.A. & Hasmi, M.S.J. (1995). Computer-aided analysis of a surface-roughness model for end milling. J. Mater. Process. Technol., Vol. 55, pp. 123-127.
- Fuh, K.H. & Hwang, R.M. (1997). Predicted milling force model for high speed end milling operation. Int. J. Mach. Tools Manuf., Vol. 37(7), pp. 969–79.
- Srinivas, N. & Kalyanmoy Deb. (1994). Multi objective optimization using non dominated sorting in genetic algorithms. Journal of Evolutionary Computation, Vol.2, No.3, pp. 221-248.
- Kanagarajan, D., Karthikeyan, R., Palanikumar, K. & Paulo Davim, J. (2008). Optimization of electrical discharge machining of WC/Co composites using non-dominated sorting genetic algorithms (NSGA-II). Int. J. Adv. Manuf. Technol., Vol.36, pp. 1124-1132.
- Ghani, J.A., Chodhury, I.A. & Hassan, H.H. (2004). Application of Taguchi method in the optimization of end milling parameters. J. Mater. Process. Technol., Vol. 145(1), pp. 84-92.
- Suresh, P.V.S., Venkateswara Rao, P. & Deshmukh, S.G. (2202). A genetic algorithmic approach for optimization of surface roughness prediction model. Int. J. Mach. Tools Manuf., Vol. 42, pp. 675–680.
- Karthikeyan, R., Raju, S. & Naagarazan, S. (2001). Optimization of electrical discharge machining characteristics of SiCp/ LM 25 Al composites using goal programming. J. mater. Sci. technol., Vol. 17, pp. 57- 60.
- Chen abd, Y. & Mahdavain, S.M. (1999). Parametric Study into Erosion Wear in a Computer Numerical Controlled Elec- tro-Discharge Machining Process. Wear, Vol. 236, No. 1-2, pp. 350-354.
- Choudhury, I.A. & EI-baradie, M.A. (1999). Machinability assessment of inconel 718 by factorial design of experiment coupled with response surface methodology. J. Mater. Process. Technol., Vol. 95, pp. 30–39.
- Palanikumar, K. (2008). Application of Taguchi and response surface methodologies for surface roughness in machining glass fiber reinforced plastics by PCD tooling. Int. J. Adv. Manuf. Technol., Vol.36, No.1-2, pp. 19-27.
- Deb, K., Pratap, A., Agarwal, S. & Meyarivan, T. (2002). A Fast and Elitist Multiobjective Genetic Algorithm:NSGA-II. IEEE Transactions on Evolutionary Computation, Vol.6(2), pp. 182-197.
- Fu, B. (2005). Piezo electric actuator design via multiobjective optimization methods [D], Germany, University of Paderborn.
- Seshadri, A. (2007). A fast elitist multi-objective genetic algorithm NSGA-II, [EB/OL]//http://www.mathworks.com. Internet specification.


