
American Journal of Mobile Systems, Applications and Services, Vol. 1, No. 3, December 2015 Publish Date: Sep. 19, 2015 Pages: 152-155
An Empirical Study on the Return Distribution of the Mobile Network Companies in Malaysia Stock Market
Lam Weng Siew*, Lam Weng Hoe
Centre for Business and Management, Department of Physical and Mathematical Science, Faculty of Science, Universiti Tunku Abdul Rahman, Kampar Campus, Perak, Malaysia
Abstract
Mobile network sector is one of the important sectors in Malaysia which provides the network communication services to the users. The investors can get the return through the investment of the mobile network companies which are listed in Malaysia stock market. However, the investors will be exposed to the risk of loss in the investment. The mean-absolute deviation model is a portfolio optimization model that has been applied in the past studies to construct the optimal portfolio which can achieve the positive return at minimum risk of loss. The objective of this paper is to study and determine the characteristic of the return distribution of the mobile network companies that listed in Malaysia stock market. Furthermore, an optimal portfolio that consists of the mobile network stocks is constructed by using the mean-absolute deviation model. The results of this study show that the return of the mobile network companies exhibits skewness and kurtosis. The return distribution for the mobile network companies are different in terms of mean, standard deviation, skewness and kurtosis. The constructed optimal portfolio is able to achieve positive return at minimum risk. This study is significant because it will benefit the investors to obtain the positive return at minimum risk through the investment of these mobile network companies in Malaysia.
Keywords
Investment, Mean, Standard Deviation, Mobile Network, Mean-Absolute Deviation Model
Received: August 31, 2015
Accepted: September 9, 2015
Published online: September 17, 2015
@ 2015 The Authors. Published by American Institute of Science. This Open Access article is under the CC BY-NC license. http://creativecommons.org/licenses/by-nc/4.0/
1. Introduction
The mobile network companies play an important role in Malaysia by providing the network communication services to the users. The mobile network issues have been studied by the past researchers in different countries [1-7]. Investors can generate the return through the investment in the mobile network companies that listed in Malaysia stock market. In stock market investment, the investors wish to minimize the investment risk and obtain the target rate of return. Risk is a chance that an actual return of the investment will be different from the expected return [8]. Portfolio optimization is an investment strategy that has been used to minimize the investment risk by constructing an optimal portfolio [9]. Konno and Yamazaki [10] have proposed the mean-absolute deviation model in portfolio optimization in order to minimize the risk and can achieve the investors target rate of return. The objective function of this model is to minimize the portfolio risk which is represented by the portfolio absolute deviation. The expected return from the investment is represented by the portfolio mean return. The mean-absolute deviation model has been studied in portfolio optimization by the past researchers [11-13]. In Malaysia, there are three main mobile network companies which are listed on Malaysia stock market. The objective of this paper is to study and determine the characteristic of the return distribution of the mobile network companies that listed in Malaysia stock market. An optimal portfolio is constructed from these mobile network companies by using the mean-absolute deviation model. The rest of the paper is organized as follows. The next section presents the materials and methods applied in this study. Section 3 discusses about the mean-absolute deviation model in constructing the optimal portfolio for the investment in mobile network companies. Section 4 shows the empirical results of this study. Finally, section 5 concludes the paper.
2. Materials and Methods
The data of this study consists of weekly return of the main mobile network companies which are listed in Malaysia stock market. The mobile network companies are Axiata Holdings (AXIATA), Maxis Berhad (MAXIS) and Telekom Malaysia Berhad (TM). The period of this study covers from January 2011 until December 2014. The characteristic of the return distribution of these three mobile network companies are studied in this paper which are mean, standard deviation, skewness and kurtosis. Mean is the average of the group of data observed [14]. Standard deviation is a measure of the dispersion of a set of data from its mean [15]. Skewness is a measure of the asymmetry of the probability distribution of a random variable about its mean [16]. Kurtosis is a measure of the peakedness of the probability distribution of a random variable [17]. The histogram for the return of these three mobile network companies are also presented in this study. The histogram is a graph that displays the data by using vertical bars of various heights to represent the frequencies of the classes [18]. The optimal portfolio is then constructed from these mobile network companies using the mean-absolute deviation model. In this study, the optimal portfolio composition, portfolio mean return and portfolio risk are computed by using the mean-absolute deviation model.
3. Mean-Absolute Deviation Model
Optimization model is a mathematical model which applies the scientific approach in decision making. It is a mathematical representation of an actual situation or problem that may be used to make better decisions. The optimization model consists of three components, which are the decision variables, constraints and objective function. The decision variables are the random variables which are determined in the decision process [19]. Constraints represents the problem or situation which must be satisfied by the decision variables [20]. Objective function is the goal that need to be achieved in solving the problem [21]. The model actually seeks to find values of the decision variables that optimize an objective function among the set of all values for the decision variables that satisfy the given constraints [22]. In portfolio management, the portfolio is constructed by determining all the decision variables through optimization model. Different optimization models have been studied by the past researchers in Malaysia stock market to construct an optimal portfolio [23-27]. The mean-absolute deviation model is one of the optimization models which is introduced by Konno and Yamazaki [10]. The mean-absolute deviation model is formulated as follow.
Minimize ![]() (1)
(1)
subject to ![]() (2)
(2)
![]() (3)
(3)
![]() (4)
(4)
xj is the weight invested in stock j,
Rj is the return of stock j,
n is the number of stocks,
E[Rj] is the mean return of stock j,
![]() is a parameter representing the target rate of return required by an investor.
is a parameter representing the target rate of return required by an investor.
Equation (1) is the objective function of the mean-absolute deviation model which minimizes the risk of the portfolio. Constraint (2) ensures the portfolio achieves the investor’s target rate of return. Constraint (3) ensures that total weights of stocks invested in the portfolio equal to one. Constraint (4) ensures that the weight invested in stock j is positive.
4. Empirical Results
Table 1 presents the summary statistics for the three mobile network companies which are AXIATA, MAXIS and TM that listed in Malaysia stock market. The mean, standard deviation, skewness and kurtosis for the three mobile network companies are the summary statistics that reported in Table 1.
Table 1. Summary Statistics for the Mobile Network Companies.


Figure 1. Histogram for the Return of AXIATA Company.
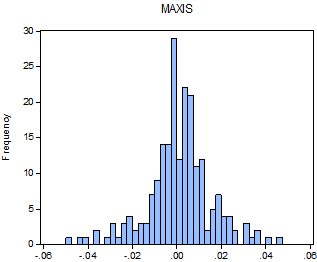
Figure 2. Histogram for the Return of MAXIS Company.
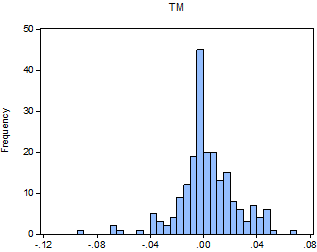
Figure 3. Histogram for the Return of TM Company.
As reported in Table 1, TM (0.0032) gives the highest mean return followed by AXIATA (0.0019) and MAXIS (0.0013). For the comparison of standard deviation, TM (0.0218) gives the highest standard deviation followed by AXIATA (0.0201) and MAXIS (0.0146). On the other hand, AXIATA (0.1551) gives the highest skewness followed by MAXIS (-0.2480) and TM (-0.4644). As for the kurtosis of the return distribution, TM (5.4544) gives the highest kurtosis followed by AXIATA (5.3338) and MAXIS (4.4718). Figure 1, 2 and 3 show the histogram for the return of AXIATA, MAXIS as well as TM respectively. Based on Table 1, the result indicates that the three mobile network companies exhibit positive and negative return.
As shown in Figure 1 to Figure 3, AXIATA, MAXIS and TM companies exhibit different return distribution in terms of mean, standard deviation, skewness and kurtosis. This implies that the return distribution for these three mobile network companies are different. Table 2 displays the optimal portfolio composition of mobile network companies which is constructed using mean-absolute deviation model.
Table 2. Optimal Portfolio Composition of Mean-Absolute Deviation Model.
| Company | Weights (%) |
| AXIATA | 19.10 |
| MAXIS | 69.86 |
| TM | 11.04 |
As reported in Table 2, the constructed optimal portfolio of the mean-absolute deviation model consists of different weights in percentage for each mobile network companies. The optimal portfolio consists of AXIATA (19.10%), MAXIS (69.86%) and TM (11.04%). MAXIS is the largest component whereas TM is the smallest component in the optimal portfolio. Table 3 shows the mean return and risk of the optimal portfolio which is constructed using the mean-absolute deviation model.
Table 3. Mean Return and Risk of the Optimal Portfolio.
| Optimal Portfolio | |
| Mean Return | 0.0016 |
| Risk | 0.0099 |
As shown in Table 3, the optimal portfolio of the mean-absolute model gives the mean return (0.0016) at the minimum risk of 0.0099. This implies that the investors can achieve the expected rate of return at the minimum risk through the investment of these mobile network companies in Malaysia stock market by using the mean-absolute deviation model.
5. Conclusion
This study discusses about the characteristic of the return distribution of the three mobile network companies which are AXIATA, MAXIS and TM that listed in Malaysia stock market. The optimal portfolio is then constructed from these mobile network companies by using the mean-absolute deviation model. The results of this study show that the return distribution of the three mobile network companies exhibit skewness and kurtosis. The return distribution for these mobile network companies are different in terms of mean, standard deviation, skewness and kurtosis. Besides that, the results show that all the mobile network companies give different weights in the optimal portfolio. This study is significant because the investors can minimize the risk of loss and achieve the target rate of return through the investment of the optimal portfolio constructed using mean-absolute deviation model. The future research of this study should be extended to other sectors for the investment other than mobile network companies for diversification.
References
- Alam, N., Jafirullah, K. J. and Hossain, A. (2012). Analytical Hierarchy Process (AHP) Approach on Consumers Preferences for Selecting Telecom Operators in Bangladesh. Information and Knowledge Management Vol. 2(4), pp 7-18.
- Ajay, Kumar, Ravi S., and Debnath, R.M. (2015). Analyzing Customer Preference And Measuring Relative Efficiency In Telecom Sector: A Hybrid Fuzzy AHP/DEA Study. Telematics and Informatics Vol. 32, pp 447-462.
- Lam, W. S., Leong, W. B., and Lam, W. H. (2015). Selection of Mobile Network Operator Based on Multi-Criteria Decision Making Model using Analytic Hierarchy Process. Mathematics and Statistics Journal Vol. 1(1), pp. 12-18.
- Leisen, B. and Vance, C. (2001). Cross-national Assessment of Service Quality in the Teecommunication Industry: Evidence from Evidence from the USA and Germany. Managing Service Quality Vol 11(5), pp. 307-317.
- Lai, F., Hutchinson, J., Li, D. and Bai, C. (2007). An empirical Assessment and Application of SERVQUAL in Mainland China’s Mobile Communication Industry. International Journal of Quality & Reliability Management Vol 24(3), pp. 244-262.
- Kollmann T. (2000). The Price/Acceptance Function: Perspectives of a Pricing Policy in European Telecommunication Markets. European Journal of Innovation Management Vol 3(1), pp. 7-14.
- Lam, W. S. and Lam, W. H. (2015). Selection of Mobile Telecommunciations Companies in Portfolio Optimization with Mean-Variance Model.American Journal of Mobile Systems, Applications and Services Vol 1(2), pp. 119-123.
- Mayo, H. B. (2008). Investments: An Introduction. 9 th Edition. South Western / Cengage Learning.
- Dougall, H. E. And Corrigan, F. J. (1978). Investments. 10 th Edition, Pearson.
- Konno, H. and Yamazaki, H. (1991). Mean-absolute deviation portfolio optimization model and ITS applications to Tokyo stock market. Management Science Vol 37(5), pp. 519-531.
- Ali, A. K. (2007).Risk and Investment Opportunities inPortfolio Optimization.European Journal of Finance and Banking ResearchVol 1(1), pp. 1-15.
- Lam, W. H. and Lam, W. S. (2015). Portfolio Optimization with Mean-Absolute Deviation Model in Malaysia Stock Market. Mathematics and Statistics JournalVol 1(3), pp. 1-3.
- Lam, W. H., Saiful, J. and Zaidi, I. (2010). An empirical comparison of different risk measures in portfolio optimization. Business and Economic Horizons vol 1, pp. 39-45.
- Freedman, D., Pisani, R. and Purves, R. (2007). Statistics. 4 th Edition, Norton & Co.
- Bluman, A. G. (2012). Elementary Statistics. 8 th Edition, Mc-Graw Hill.
- Hogg, R. V. and Tanis, E. A. (2006). Probability and Statistical Inference. 7 th Edition, Prentice Hall.
- Milton, J. S. and Arnold, J. C. (2003). Introduction to Probability and Statistics. 4 th Edition, Mc-Graw Hill.
- Wackerly, D. D., Mendenhall, W. and Scheaffer, R. L. (2002). Mathematical Statistics with Applications. 6 th Edition, Duxbury.
- Ragsdale, C. T. (2011). Managerial Decision Modelling. 6 th Edition, South Western Cengage Learning.
- Murthy, P. R. (2007). Operations Research. 2 th Edition, New Age International (P) Ltd.
- Bazaraa, M. S., Jarvis, J. J. and Sherali, H. D. (2010). Linear Programming and Network Flows. 4 th Edition, John Wiley & Sons.
- Winston, W. L. (2004). Operations Research: Applications and Algorithms. 4 th Edition. Brooks/Cole.
- Lam, W. S. and Lam, W. H. (2015). Portfolio Selection for Index Tracking Problem in Malaysian Stock Market. International Journal of Administration and Governance, vol. 1(3), pp. 15-17.
- Lam, W. S., Saiful, J. and Hamizun, I. (2014). Comparison between Two Stage Regression Model and Variance Model in Portfolio Optimization. Journal of Applied Science and Agriculture vol. 9(18), pp. 36-40.
- Lam, W. S., Saiful, J. and Hamizun, I. (2015). An empirical study on the characteristics on high risk aversion behavior in portfolio decision making, Advances in Environmental Biology vol. 9(7), pp. 17-20.
- Saiful, J., Lam, W. S. and Hamzun, I. (2015). A New Optimization Model in Enhanced Index Tracking Problem with Goal Programming Approach and Entropy Measure. Wulfenia Journal vol. 22(1), pp. 356-363.
- Lam, W. S., Saiful, J. and Hamizun, I. (2015). The impact of human behavior towards portfolio selection in Malaysia. Procedia of Social and Behavioral Sciences vol. 172, pp. 674-678.


