
American Journal of Mobile Systems, Applications and Services, Vol. 1, No. 2, October 2015 Publish Date: Aug. 23, 2015 Pages: 119-123
Selection of Mobile Telecommunications Companies in Portfolio Optimization with Mean-Variance Model
Centre for Business and Management, Department of Physical and Mathematical Science, Faculty of Science, Universiti Tunku Abdul Rahman, Perak Campus, Kampar, Perak, Malaysia
Abstract
Mobile telecommunications companies offer the network communication services to the users around the world. Maxis Berhad, Digi. Com, Telekom Malaysia and Axiata Holdings are the four mobile telecommunications companies listed on main market in Malaysia stock market. Investors can get return from investing in these mobile telecommunications companies by constructing the optimal portfolio. The selection of mobile telecommunications companies in a portfolio can be done by applying the mean-variance model. The objective of this paper is to determine the optimal portfolio composition and performance for the mobile telecommunications companies in Malaysia using mean-variance model. The results of this study show that the optimal portfolio consists of four mobile telecommunications companies with different weights to achieve the target weekly return of 0.1577% at minimum risk of 1.3226%. This implies that the mean-variance model can be applied effectively in the investment of mobile telecommunications companies in Malaysia. The significance of this study is to determine the optimal portfolio for the mobile telecommunications companies in Malaysia to achieve positive target return at minimum risk.
Keywords
Mean Return, Risk, Optimal Portfolio, Mobile Telecommunications Companies
Received: July 23, 2015
Accepted: August 12, 2015
Published online: August 19, 2015
@ 2015 The Authors. Published by American Institute of Science. This Open Access article is under the CC BY-NC license. http://creativecommons.org/licenses/by-nc/4.0/
1. Introduction
Telecommunications occurs when there is exchange of information between the devices with the application of communication technology. The communication technology transmits the information as electrical signals through a cable or in the form of electromagnetic waves [1]. Mobile telecommunications companies offer the network communication services to the users. In Malaysia, there are four mobile telecommunications companies listed on main market in Malaysia stock market. These companies are Maxis Berhad, Digi. Com, Telekom Malaysia and Axiata Holdings. The telecommunications companies provide a variety of mobile communications product and services. They offer prepaid data plans, call plans, SMS plans, postpaid data plans, devices, wireless broadband, fibre internet and residential fixed line services. Various studies of mobile telecommunications companies have been done by the past researchers in different countries [2-7]. Investors can get return from investing in the mobile telecommunications companies by constructing the optimal portfolio. Portfolio is a collection of stocks which are selected from the stock market in order to minimize the risk at the expected rate of return [8]. Risk is a chance or probability that an investment’s actual return will be different from the expected return [9]. The portfolio can be constructed by using the optimization model. An optimization model is a mathematical model which aims to find the values of decision variables that optimize an objective function among the set of all values of the decision variables that satisfy the given constraints [10]. The optimization models have been widely used in portfolio management [11-17]. Mean-variance model is one of the optimization models which has been applied in portfolio management to minimize the portfolio risk at the target rate of expected return [18,19]. In stock market investment for the mobile telecommunications companies, the selection of mobile telecommunications companies in a portfolio can be done by applying the mean-variance model. The objective of this paper is to determine the optimal portfolio composition and performance for the mobile telecommunications companies in Malaysia using mean-variance model. The rest of the paper is organized as follows. The next section describes the materials and methods used in this study. Section 3 discusses about the mean-variance model in constructing the optimal portfolio for the investment in mobile telecommunications companies. Section 4 presents the empirical results of this study. Section 5 concludes the paper.
2. Materials and Methods
In this study, the data consists of weekly price of four mobile telecommunications companies which are listed on Malaysia stock market. The period of this study covers from January 2011 until December 2014. The mobile telecommunications companies are Axiata Holdings (AXIATA), Digi. Com (DIGI), Maxis Berhad (MAXIS) and Telekom Malaysia Berhad (TM). The optimal portfolio for the mobile telecommunications companies is constructed using the optimization model. An optimization model is a mathematical model which aims to find the values of decision variables that optimize an objective function among the set of all values of the decision variables that satisfy the given constraints [10]. In portfolio construction using the optimization model, the decision variables represents the optimal portfolio composition that can be determined by solving the model. Weekly returns of the stocks for all mobile telecommunications companies such as Axiata Holdings, Digi. Com, Maxis Berhad and Telekom Malaysia Berhad are the data input to the optimization model. The return of the stocks is determined as below [20].
![]() (1)
(1)
![]() is the return of stock i at time t,
is the return of stock i at time t,
![]() is the closing price of stock i at time t
is the closing price of stock i at time t
![]() is the closing price of stock i at time t-1.
is the closing price of stock i at time t-1.
The mean return of the stock i is calculated as below [21].
![]() (2)
(2)
![]() is the mean return of stock i,
is the mean return of stock i,
![]() is the return of stock i at time t,
is the return of stock i at time t,
T is the number of observations
Figure 1 shows the construction process of the optimal portfolio for the mobile telecommunications companies using an optimization model.
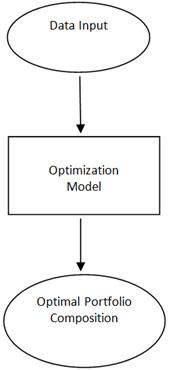
Figure 1.Construction Process of the Optimal Portfolio Composition with Optimization Model.
Based on the determination of the optimal portfolio composition using the optimization model, the mean return of the optimal portfolio is formulated as follow [22].
![]() (3)
(3)
![]() is the mean return of the optimal portfolio,
is the mean return of the optimal portfolio,
![]() is the mean return of stock i,
is the mean return of stock i,
![]() is the amount of the fund invested in stock i,
is the amount of the fund invested in stock i,
n is the number of stocks.
In this study, the portfolio composition and portfolio performance are determined by using the optimization model which is mean-variance model.
3. Mean-Variance Model
Portfolio is a collection of stocks assembled to meet one or more investment goals [8]. Portfolio construction applies the concept of diversification which was introduced by Markowitz [18]. Diversification involves the inclusion of different number of stocks in a portfolio, which is more than one stock. According to Markowitz [18], investing in a single stock is riskier than investing in a group of stocks in a portfolio. In portfolio management, diversification is the statistical concept of correlation. Correlation is a statistical measure of the relationship between two stocks [23]. If both time series of the stocks move in the same direction, they are positively correlated. However, if both time series of the stocks move in opposite direction, they are negatively correlated. The degree of correlation is measured by the correlation coefficient. The correlation coefficient ranges from +1 for perfect positive correlation to ![]() for perfect negative correlation. Zero correlations indicate that there is no linear relationship between the returns on two stocks. The lower the correlation between any two stocks, the greater the risk reduction that can be achieved by combining those stocks in a portfolio. This implies that the diversification is achieved by combining the stocks in a portfolio in such a way that the individual stock has negative correlations or low positive correlations between each other’s rates of return. Risk is a chance that an investment’s actual return will be different from the expected return [9]. The risk of a single stock is measured by standard deviation and formulated as below.
for perfect negative correlation. Zero correlations indicate that there is no linear relationship between the returns on two stocks. The lower the correlation between any two stocks, the greater the risk reduction that can be achieved by combining those stocks in a portfolio. This implies that the diversification is achieved by combining the stocks in a portfolio in such a way that the individual stock has negative correlations or low positive correlations between each other’s rates of return. Risk is a chance that an investment’s actual return will be different from the expected return [9]. The risk of a single stock is measured by standard deviation and formulated as below.
 (4)
(4)
![]() is the risk of stock i,
is the risk of stock i,
![]() is the return of stock i at time t,
is the return of stock i at time t,
![]() is the mean return of stock i,
is the mean return of stock i,
T is the number of observations
The risk of a portfolio is determined by standard deviation and formulated as below.
 (5)
(5)
![]() is the risk of the portfolio,
is the risk of the portfolio,
![]() is the return of the portfolio at time t,
is the return of the portfolio at time t,
![]() is the mean return of the portfolio,
is the mean return of the portfolio,
T is the number of observations
Based on the diversification concepts in portfolio optimization, when a portfolio contains two stocks with one stock has a higher average return than the other, the return of the portfolio increases the more in the stock with higher return and vice-versa. Besides that, when a portfolio contain two stocks with one has a higher standard deviation than the other, the standard deviation of the portfolio may rise or fall the more for the stock with higher standard deviation. The optimal portfolio can be constructed using mean-variance model. Mean-variance model is an optimization model which applies the statistical diversification concepts in portfolio construction to minimize the portfolio’s risk. The mean-variance model is formulated as follow.
Minimize ![]() (6)
(6)
subject to
![]() (7)
(7)
![]() (8)
(8)
![]() (9)
(9)
![]() is the covariance between stock
is the covariance between stock ![]() and
and ![]() ,
,
![]() is the weight invested in stock i,
is the weight invested in stock i,
![]() is the weight invested in stock
is the weight invested in stock ![]() ,
,
![]() is the expected return of stock
is the expected return of stock ![]() per period
per period
![]() is a parameter representing the target rate of return required by an investor.
is a parameter representing the target rate of return required by an investor.
Equation (6) is the objective function which minimizes the risk of the portfolio. Constraint (7) ensures the portfolio achieves the target mean return. Constraint (8) ensures that total weights of stocks invested in the portfolio is one. Constraint (9) ensures that the weight invested in stock j is non-negative. The portfolio composition and portfolio performance of the mean-variance model are computed in this study.
4. Empirical Results
Table 1 presents the summary statistics for all the mobile telecommunications companies which are listed in Malaysia stock market. The summary statistics are presented in terms of mean return and standard deviation of the mobile telecommunications companies within the study period.
Table 1. Summary Statistics for the Mobile Telecommunications Companies.
| Company Name | Mean Return (%) | Standard Deviation (%) |
| Axiata Holdings | 0.1942 | 2.0119 |
| Digi. Com | 0.0208 | 6.6629 |
| Maxis Berhad | 0.1296 | 1.4636 |
| Telekom Malaysia Berhad | 0.3185 | 2.1803 |
As shown in Table 1, all the mobile telecommunications companies give different mean return and standard deviation for the study period from January 2011 until December 2014. Telekom Malaysia Berhad generates the highest weekly mean return of 0.3185% at 2.1803% standard deviation. This is followed by Axiata Holdings which gives 0.1942% weekly mean return at 2.0119% standard deviation. Maxis Berhad generates 0.1296% weekly mean return at 1.4636% standard deviation. Digi. Com gives the lowest weekly mean return of 0.0208% at highest standard deviation of 6.6629%. This implies that the variation or fluctuation of Digi. Com’s return from the mean return is the highest among all mobile telecommunications companies. Therefore, the risk for Digi. Com is the highest among the mobile telecommunications companies.
Table 2 presents the optimal portfolio composition of mobile telecommunications companies which is constructed using mean-variance model.
Table 2. Optimal Portfolio Composition of Mean-variance Model.
| Company Name | Symbol | Weights (%) |
| Axiata Holdings | AXIATA | 21.00 |
| Digi. Com | DIGI | 2.78 |
| Maxis Berhad | MAXIS | 66.92 |
| Telekom Malaysia Berhad | TM | 9.30 |
As shown in Table 2, the weights for all the mobile telecommunications companies in the optimal portfolio composition are different. The allocations of stocks in the optimal portfolio gives the minimum risk in achieving the target return. Based on Table 2, 21.00% of the investment fund is allocated for Axiata Holdings whereas 2.78% of the investment fund is allocated for Digi. Com. Besides that, 66.92% of the investment fund is allocated for Maxis Berhad whereas 9.30% of the investment fund is allocated for Telekom Malaysia Berhad. Maxis Berhad is the most dominant stock with 66.92% in the optimal portfolio. On the other hand, Digi. Com is the smallest component in the optimal portfolio with 2.78%. Table 3 displays the summary statistics of the optimal portfolio which is constructed using the mean-variance model.
Table 3. Summary Statistics of the Optimal Portfolio.
| Optimal Portfolio | % |
| Mean Return | 0.1577 |
| Risk | 1.3226 |
Based on Table 3, the optimal portfolio of the mean-variance model gives the minimum risk of 1.3226% at weekly mean return of 0.1577%. This implies that the optimal portfolio of mobile telecommunications companies is able to achieve weekly mean return of 0.1577% at the lowest risk of 1.3226%. Therefore, the mean-variance model is suitable to be applied by the investors in portfolio management of mobile telecommunications companies.
5. Conclusion
This paper discusses about the construction of the optimal portfolio for the mobile telecommunications companies in Malaysia using mean-variance model. The results of this study show that the optimal portfolio consists of four mobile telecommunications companies with different weights to achieve the target weekly return 0.1577% at minimum risk 1.3226%. This implies that the mean-variance model can be applied effectively in the investment of mobile telecommunications companies in Malaysia. The significance of this study is to determine the optimal portfolio for the mobile telecommunications companies in Malaysia to achieve positive return at minimum risk. The future research of this study should be extended to other countries for the investment in mobile telecommunications companies.
References
- Clark, M. P. (1997). Networks and Communications: Design and Operation. Second Edition, Germany, John Wiley & Sons.
- Alam, N., Jafirullah, K. J. and Hossain, A. (2012). Analytical Hierarchy Process (AHP) Approach on Consumers Preferences for Selecting Telecom Operators in Bangladesh. Information and Knowledge Management Vol. 2(4), pp 7-18.
- Ajay, Kumar, Ravi S., and Debnath, R.M. (2015). Analyzing Customer Preference And Measuring Relative Efficiency In Telecom Sector: A Hybrid Fuzzy AHP/DEA Study. Telematics and Informatics Vol. 32, pp 447-462.
- Lam, W. S., Leong, W. B., and Lam, W. H. (2015). Selection of Mobile Network Operator Based on Multi-Criteria Decision Making Model using Analytic Hierarchy Process. Mathematics and Statistics Journal Vol. 1(1), pp. 12-18.
- Leisen, B. and Vance, C. (2001). Cross-national Assessment of Service Quality in the Teecommunication Industry: Evidence from Evidence from the USA and Germany. Managing Service Quality Vol 11(5), pp 307-317.
- Lai, F., Hutchinson, J., Li, D. and Bai, C. (2007). An empirical assessment and application of SERVQUAL in mainland China’s mobile communication industry. International Journal of Quality & Reliability Management Vol 24(3), pp 244-262.
- Kollmann T. (2000). The Price/Acceptance Function : Perspectives of a Pricing Policy in European Telecommunication Markets. European Journal of Innovation Management Vol 3(1), pp 7-14.
- Gitman, L. J., Joehnk, M. D. and Smart, L. J. (2011). Fundamentals of Investing. 11th Edition, Pearson.
- Reilly, F. K. and Brown, K. C. (2012). Investment Analysis and Portfolio Management. 10th Edition, Mason, South Western Cengage Learning.
- Taha, H. A. (2011). Operations Research: An Introduction. 9th Edition, New Jersey, Prentice Hall.
- Lam, W. S. and Lam, W. H. (2015). Portfolio Selection for Index Tracking Problem in Malaysian Stock Market. International Journal of Administration and Governance, vol. 1(3), pp. 15-17.
- Lam, W. S., Saiful, J. and Hamizun, I. (2014). Comparison between Two Stage Regression Model and Variance Model in Portfolio Optimization. Journal of Applied Science and Agriculture vol. 9(18), pp. 36-40.
- W. S. Lam, H. J. Saiful, and I. Hamizun (2014). Index Tracking Modelling in Portfolio Optimization with Mixed Integer Linear Programming. Journal of Applied Science and Agriculture vol. 9(18), pp. 47-50.
- Lam, W. S., Saiful, J. and Hamizun, I. (2015). The impact of human behavior towards portfolio selection in Malaysia. Procedia of Social and Behavioral Sciences vol. 172, pp. 674-678.
- Lam, W. S., Saiful, J. and Hamizun, I. (2015). Investigation on relationship between human behavior and portfolio selection problem in Malaysia. Advances in Environmental Biology vol. 9(7), pp. 6-10.
- Lam, W. S., Saiful, J. and Hamizun, I. (2015). An empirical study on the characteristics on high risk aversion behavior in portfolio decision making, Advances in Environmental Biology vol. 9(7), pp. 17-20.
- Saiful, J., Lam, W. S. and Hamzun, I. (2015). A New Optimization Model in Enhanced Index Tracking Problem with Goal Programming Approach and Entropy Measure. Wulfenia Journal vol. 22(1), pp. 356-363.
- Markowitz, H. M. (1952). Portfolio Selection. Journal of Finance vol. 7, pp. 77-91.
- Lam, W. H., Saiful, J. and Zaidi, I. (2010). An empirical comparison of different risk measures in portfolio optimization. Business and Economic Horizons vol 1, pp. 39-45.
- Lye, C. T. and Nurul, A. M. (2011). Performance of listed state-owned enterprises using Sortino Ratio optimization. Journal of Applied Sciences vol 11, pp. 3436-3441.
- Konno, H. and Yamazaki, H. (1991). Mean-absolute deviation portfolio optimization model and ITS applications to Tokyo stock market. Management Science vol 37(5), pp. 519-531.
- Bodie, Z., Kane, A. and Marcus, A. J. (2008). Investments. 7the Edition, New York, McGraw-Hill.
- Jones, C. P. (2010). Investments Principles and Concepts. 11th Edition, John Wiley & Sons.


